Zip Codes with the Highest Percentage of Population with a Degree in Liberal Arts and History in Grants Pass, OR
RELATED REPORTS & OPTIONS
Liberal Arts and History
Grants Pass
Compare Zip Codes
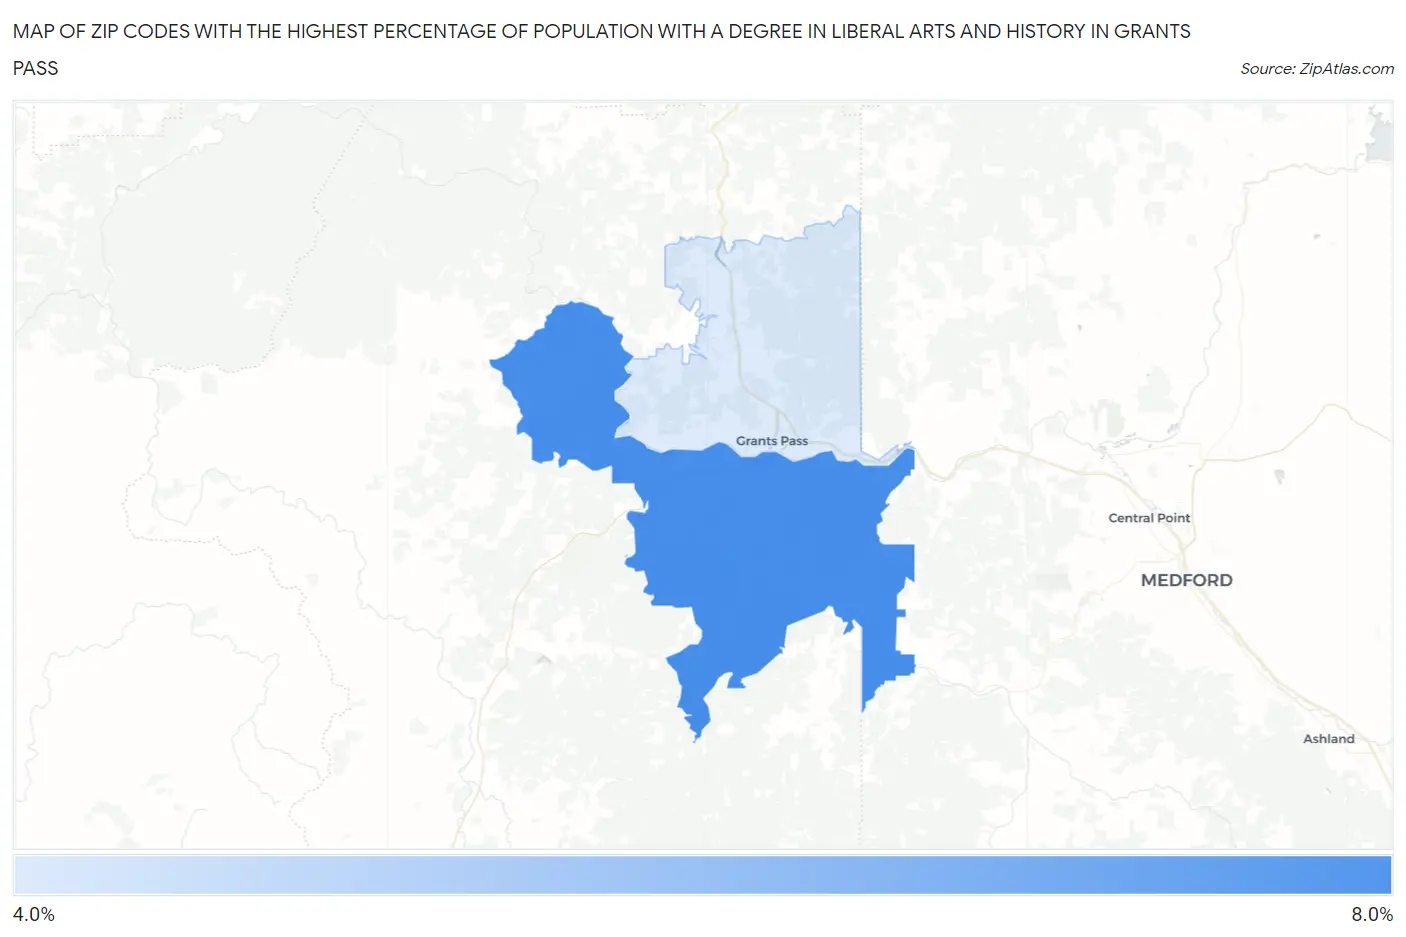
Map of Zip Codes with the Highest Percentage of Population with a Degree in Liberal Arts and History in Grants Pass
4.7%
6.8%
Zip Codes with the Highest Percentage of Population with a Degree in Liberal Arts and History in Grants Pass, OR
| Zip Code | % Graduates | vs State | vs National | |
| 1. | 97527 | 6.8% | 6.1%(+0.751)#147 | 4.9%(+1.96)#6,676 |
| 2. | 97526 | 4.7% | 6.1%(-1.39)#243 | 4.9%(-0.185)#12,371 |
1
Common Questions
What are the Top Zip Codes with the Highest Percentage of Population with a Degree in Liberal Arts and History in Grants Pass, OR?
Top Zip Codes with the Highest Percentage of Population with a Degree in Liberal Arts and History in Grants Pass, OR are:
What zip code has the Highest Percentage of Population with a Degree in Liberal Arts and History in Grants Pass, OR?
97527 has the Highest Percentage of Population with a Degree in Liberal Arts and History in Grants Pass, OR with 6.8%.
What is the Percentage of Population with a Degree in Liberal Arts and History in Grants Pass, OR?
Percentage of Population with a Degree in Liberal Arts and History in Grants Pass is 5.4%.
What is the Percentage of Population with a Degree in Liberal Arts and History in Oregon?
Percentage of Population with a Degree in Liberal Arts and History in Oregon is 6.1%.
What is the Percentage of Population with a Degree in Liberal Arts and History in the United States?
Percentage of Population with a Degree in Liberal Arts and History in the United States is 4.9%.