Zip Codes with the Highest Percentage of Population with a Degree in Liberal Arts and History in Beaverton, OR
RELATED REPORTS & OPTIONS
Liberal Arts and History
Beaverton
Compare Zip Codes
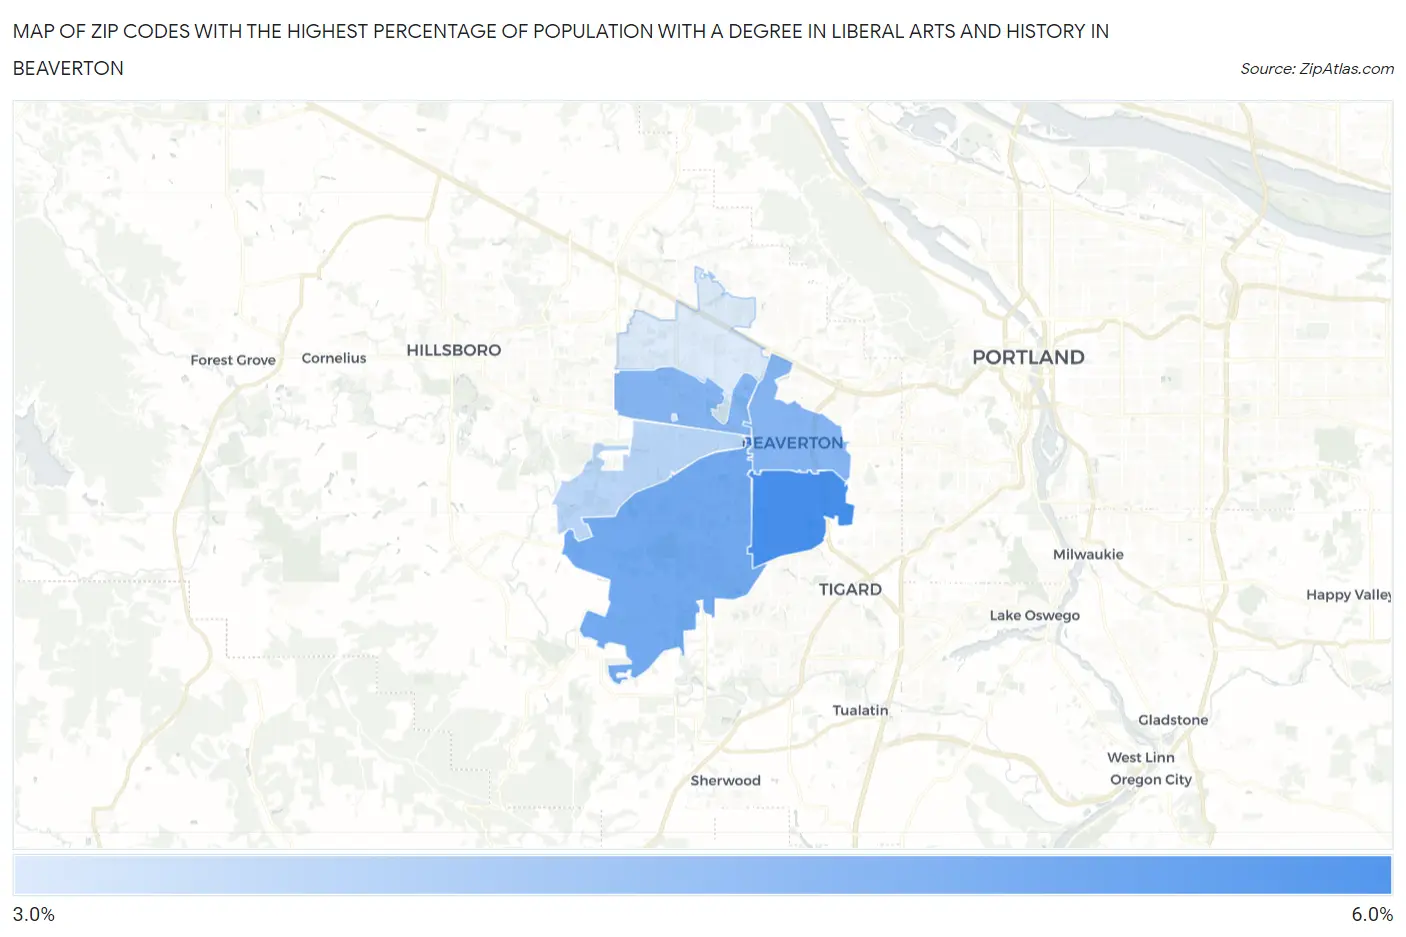
Map of Zip Codes with the Highest Percentage of Population with a Degree in Liberal Arts and History in Beaverton
3.2%
5.4%
Zip Codes with the Highest Percentage of Population with a Degree in Liberal Arts and History in Beaverton, OR
| Zip Code | % Graduates | vs State | vs National | |
| 1. | 97008 | 5.4% | 6.1%(-0.683)#213 | 4.9%(+0.524)#10,146 |
| 2. | 97007 | 4.8% | 6.1%(-1.32)#242 | 4.9%(-0.116)#12,141 |
| 3. | 97003 | 4.5% | 6.1%(-1.57)#250 | 4.9%(-0.363)#12,946 |
| 4. | 97005 | 4.5% | 6.1%(-1.57)#251 | 4.9%(-0.369)#12,959 |
| 5. | 97078 | 3.8% | 6.1%(-2.33)#275 | 4.9%(-1.12)#15,698 |
| 6. | 97006 | 3.2% | 6.1%(-2.83)#284 | 4.9%(-1.63)#17,493 |
1
Common Questions
What are the Top 5 Zip Codes with the Highest Percentage of Population with a Degree in Liberal Arts and History in Beaverton, OR?
Top 5 Zip Codes with the Highest Percentage of Population with a Degree in Liberal Arts and History in Beaverton, OR are:
What zip code has the Highest Percentage of Population with a Degree in Liberal Arts and History in Beaverton, OR?
97008 has the Highest Percentage of Population with a Degree in Liberal Arts and History in Beaverton, OR with 5.4%.
What is the Percentage of Population with a Degree in Liberal Arts and History in Beaverton, OR?
Percentage of Population with a Degree in Liberal Arts and History in Beaverton is 4.5%.
What is the Percentage of Population with a Degree in Liberal Arts and History in Oregon?
Percentage of Population with a Degree in Liberal Arts and History in Oregon is 6.1%.
What is the Percentage of Population with a Degree in Liberal Arts and History in the United States?
Percentage of Population with a Degree in Liberal Arts and History in the United States is 4.9%.