Zip Codes with the Most Immigrants from South Eastern Asia in Cuyahoga Falls, OH
RELATED REPORTS & OPTIONS
South Eastern Asia
Cuyahoga Falls
Compare Zip Codes
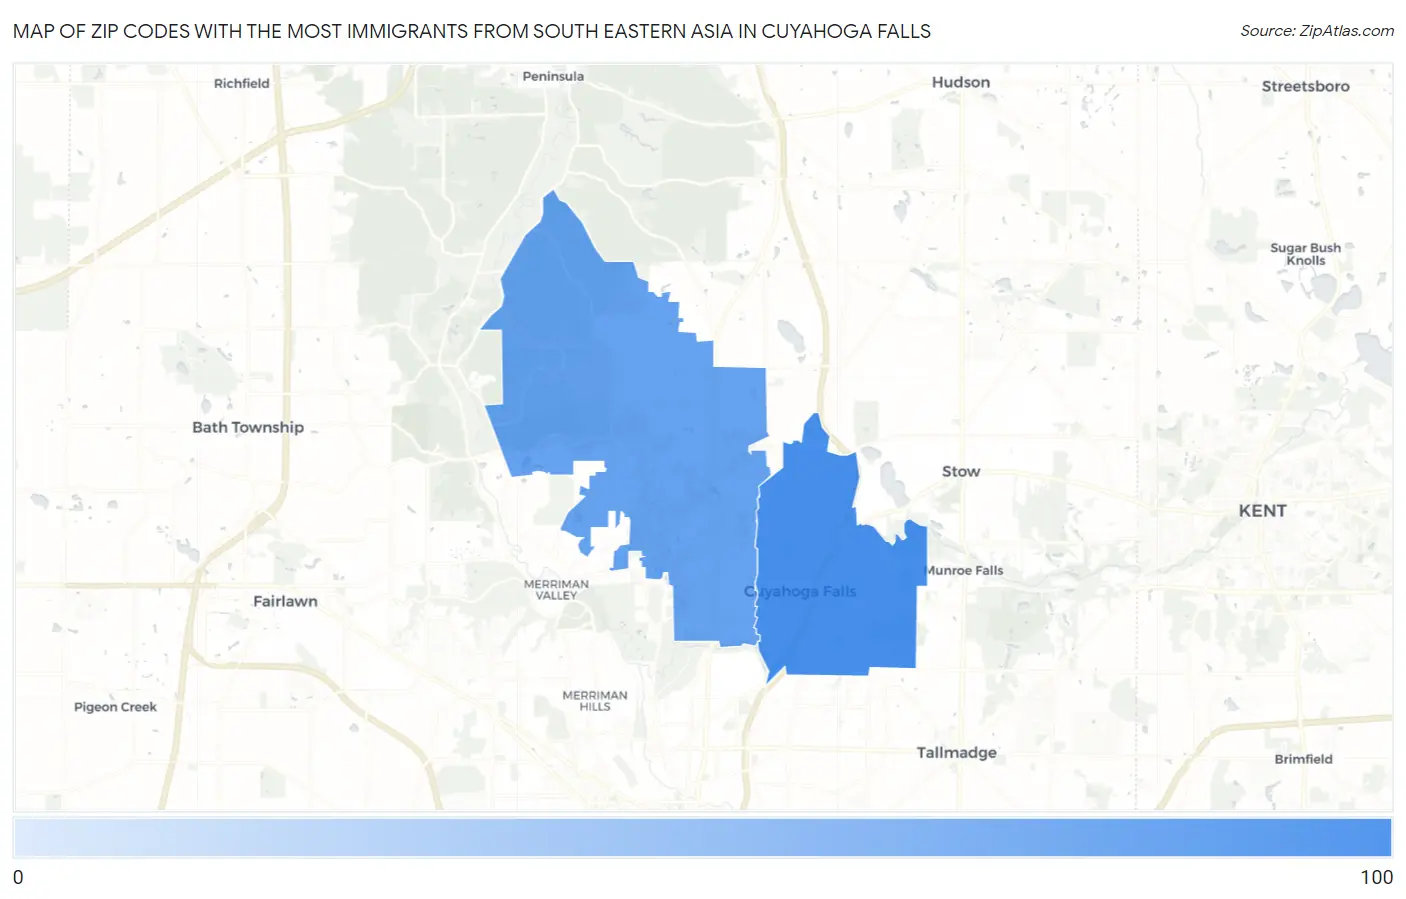
Map of Zip Codes with the Most Immigrants from South Eastern Asia in Cuyahoga Falls
35
86
Zip Codes with the Most Immigrants from South Eastern Asia in Cuyahoga Falls, OH
| Zip Code | South Eastern Asia | vs State | vs National | |
| 1. | 44221 | 86 | 41,276(0.21%)#138 | 4,292,058(0.00%)#6,325 |
| 2. | 44223 | 35 | 41,276(0.08%)#260 | 4,292,058(0.00%)#8,743 |
1
Common Questions
What are the Top Zip Codes with the Most Immigrants from South Eastern Asia in Cuyahoga Falls, OH?
Top Zip Codes with the Most Immigrants from South Eastern Asia in Cuyahoga Falls, OH are:
What zip code has the Most Immigrants from South Eastern Asia in Cuyahoga Falls, OH?
44221 has the Most Immigrants from South Eastern Asia in Cuyahoga Falls, OH with 86.
What is the Total Immigrants from South Eastern Asia in Cuyahoga Falls, OH?
Total Immigrants from South Eastern Asia in Cuyahoga Falls is 135.
What is the Total Immigrants from South Eastern Asia in Ohio?
Total Immigrants from South Eastern Asia in Ohio is 41,276.
What is the Total Immigrants from South Eastern Asia in the United States?
Total Immigrants from South Eastern Asia in the United States is 4,292,058.