Zip Codes with the Highest Percentage of Population with a Degree in Visual and Performing Arts in Cuyahoga Falls, OH
RELATED REPORTS & OPTIONS
Visual and Performing Arts
Cuyahoga Falls
Compare Zip Codes
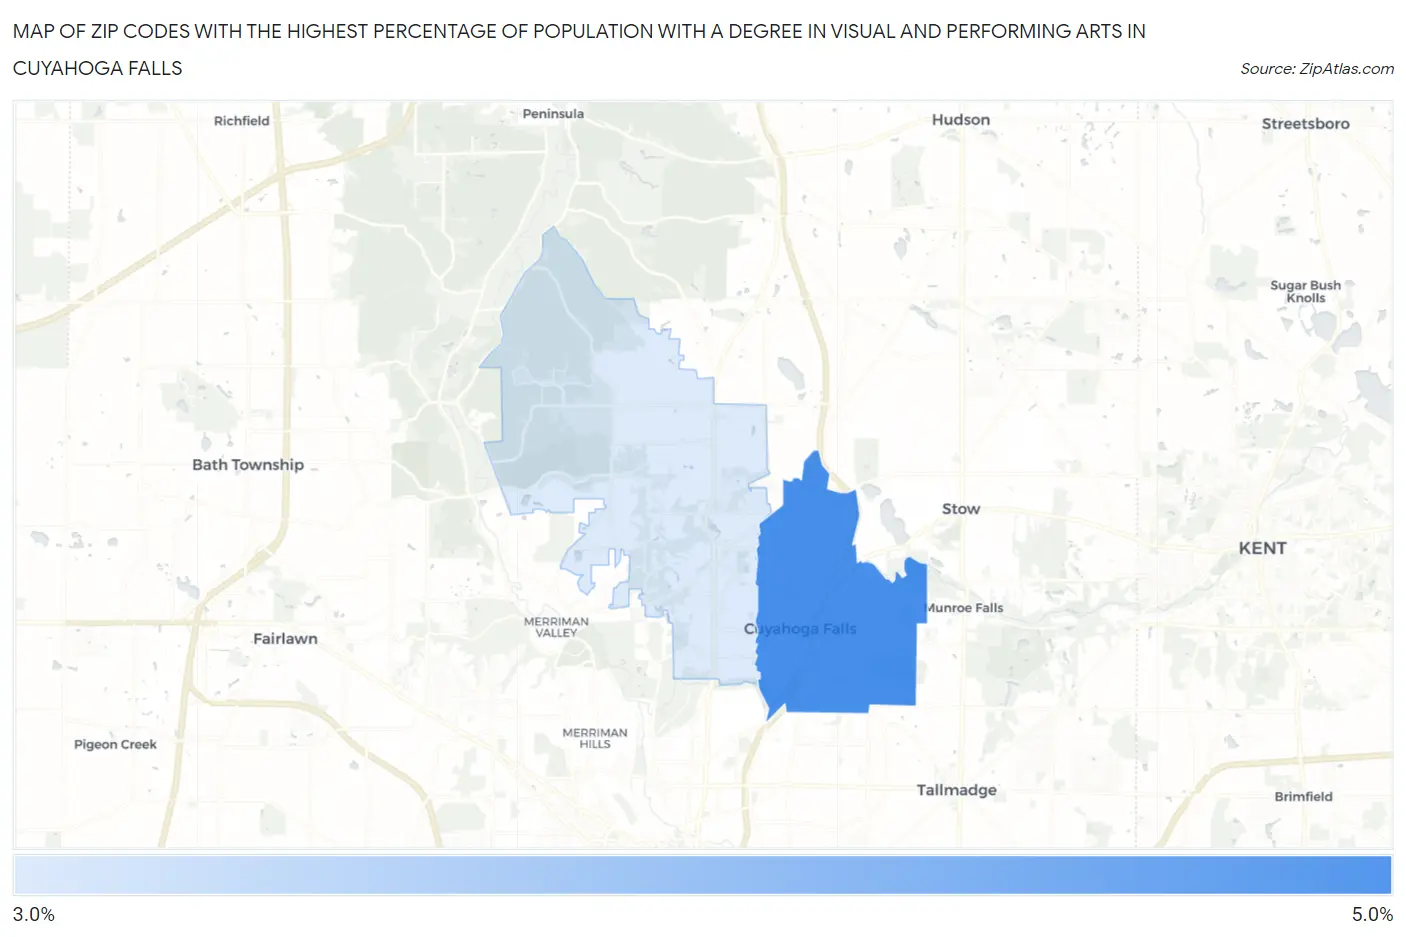
Map of Zip Codes with the Highest Percentage of Population with a Degree in Visual and Performing Arts in Cuyahoga Falls
3.5%
4.3%
Zip Codes with the Highest Percentage of Population with a Degree in Visual and Performing Arts in Cuyahoga Falls, OH
| Zip Code | % Graduates | vs State | vs National | |
| 1. | 44221 | 4.3% | 3.7%(+0.563)#303 | 4.3%(+0.022)#8,425 |
| 2. | 44223 | 3.5% | 3.7%(-0.236)#396 | 4.3%(-0.777)#10,982 |
1
Common Questions
What are the Top Zip Codes with the Highest Percentage of Population with a Degree in Visual and Performing Arts in Cuyahoga Falls, OH?
Top Zip Codes with the Highest Percentage of Population with a Degree in Visual and Performing Arts in Cuyahoga Falls, OH are:
What zip code has the Highest Percentage of Population with a Degree in Visual and Performing Arts in Cuyahoga Falls, OH?
44221 has the Highest Percentage of Population with a Degree in Visual and Performing Arts in Cuyahoga Falls, OH with 4.3%.
What is the Percentage of Population with a Degree in Visual and Performing Arts in Cuyahoga Falls, OH?
Percentage of Population with a Degree in Visual and Performing Arts in Cuyahoga Falls is 3.7%.
What is the Percentage of Population with a Degree in Visual and Performing Arts in Ohio?
Percentage of Population with a Degree in Visual and Performing Arts in Ohio is 3.7%.
What is the Percentage of Population with a Degree in Visual and Performing Arts in the United States?
Percentage of Population with a Degree in Visual and Performing Arts in the United States is 4.3%.