Zip Codes with the Highest Percentage of Households Without a Vehicle in Lyon Mountain, NY
RELATED REPORTS & OPTIONS
Households without a Cars
Lyon Mountain
Compare Zip Codes
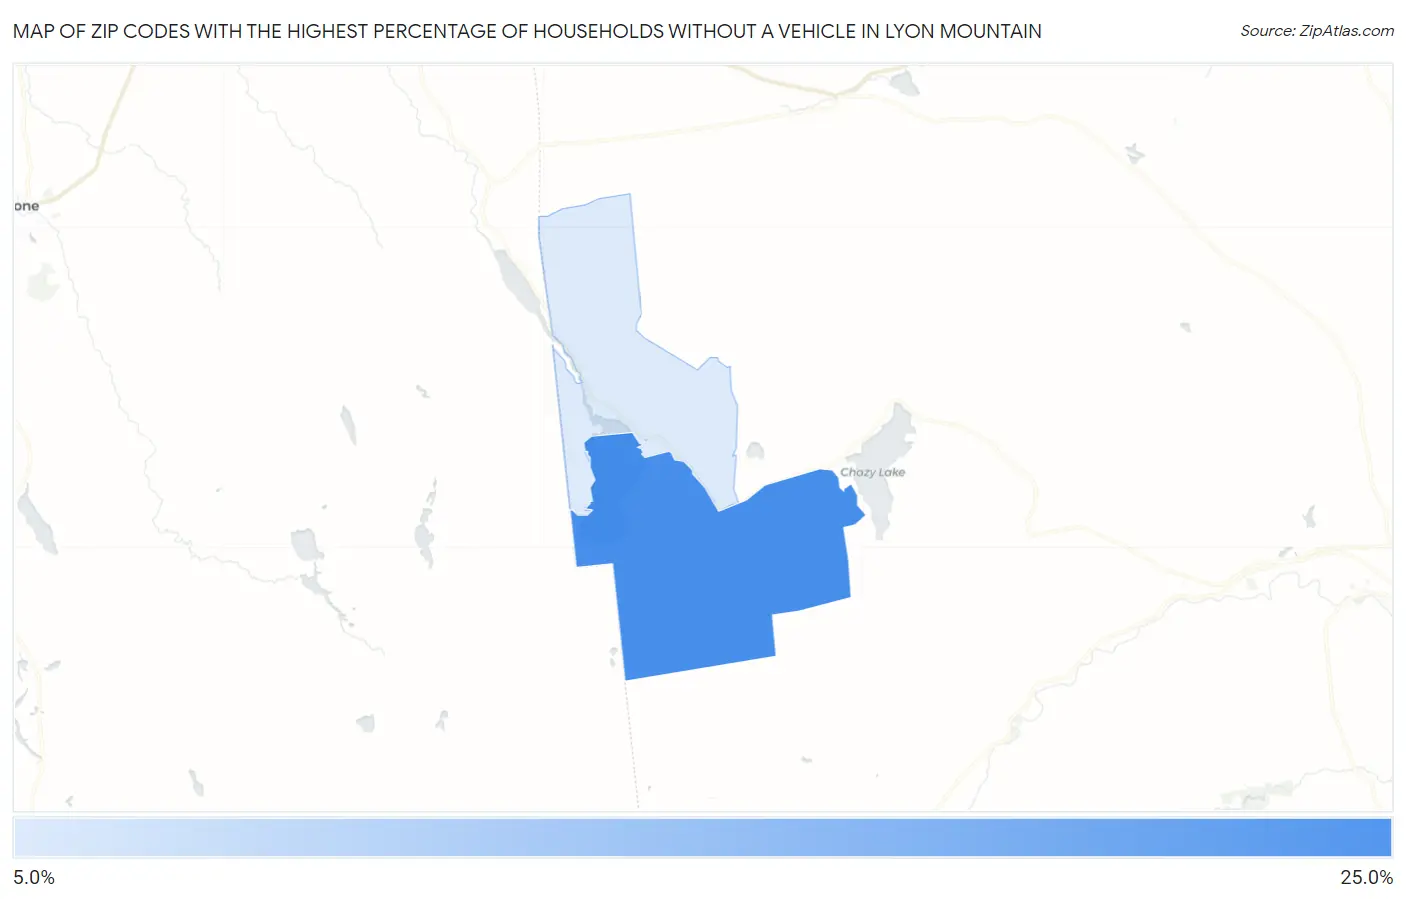
Map of Zip Codes with the Highest Percentage of Households Without a Vehicle in Lyon Mountain
7.1%
22.1%
Zip Codes with the Highest Percentage of Households Without a Vehicle in Lyon Mountain, NY
| Zip Code | Housholds Without a Car | vs State | vs National | |
| 1. | 12952 | 22.1% | 29.0%(-6.90)#229 | 8.3%(+13.8)#1,298 |
| 2. | 12955 | 7.1% | 29.0%(-21.9)#702 | 8.3%(-1.20)#8,509 |
1
Common Questions
What are the Top Zip Codes with the Highest Percentage of Households Without a Vehicle in Lyon Mountain, NY?
Top Zip Codes with the Highest Percentage of Households Without a Vehicle in Lyon Mountain, NY are:
What zip code has the Highest Percentage of Households Without a Vehicle in Lyon Mountain, NY?
12952 has the Highest Percentage of Households Without a Vehicle in Lyon Mountain, NY with 22.1%.
What is the Percentage of Households Without a Vehicle in Lyon Mountain, NY?
Percentage of Households Without a Vehicle in Lyon Mountain is 22.3%.
What is the Percentage of Households Without a Vehicle in New York?
Percentage of Households Without a Vehicle in New York is 29.0%.
What is the Percentage of Households Without a Vehicle in the United States?
Percentage of Households Without a Vehicle in the United States is 8.3%.