Zip Codes with the Highest Percentage of Population Employed in Arts, Media & Entertainment in Missoula, MT
RELATED REPORTS & OPTIONS
Arts, Media & Entertainment
Missoula
Compare Zip Codes
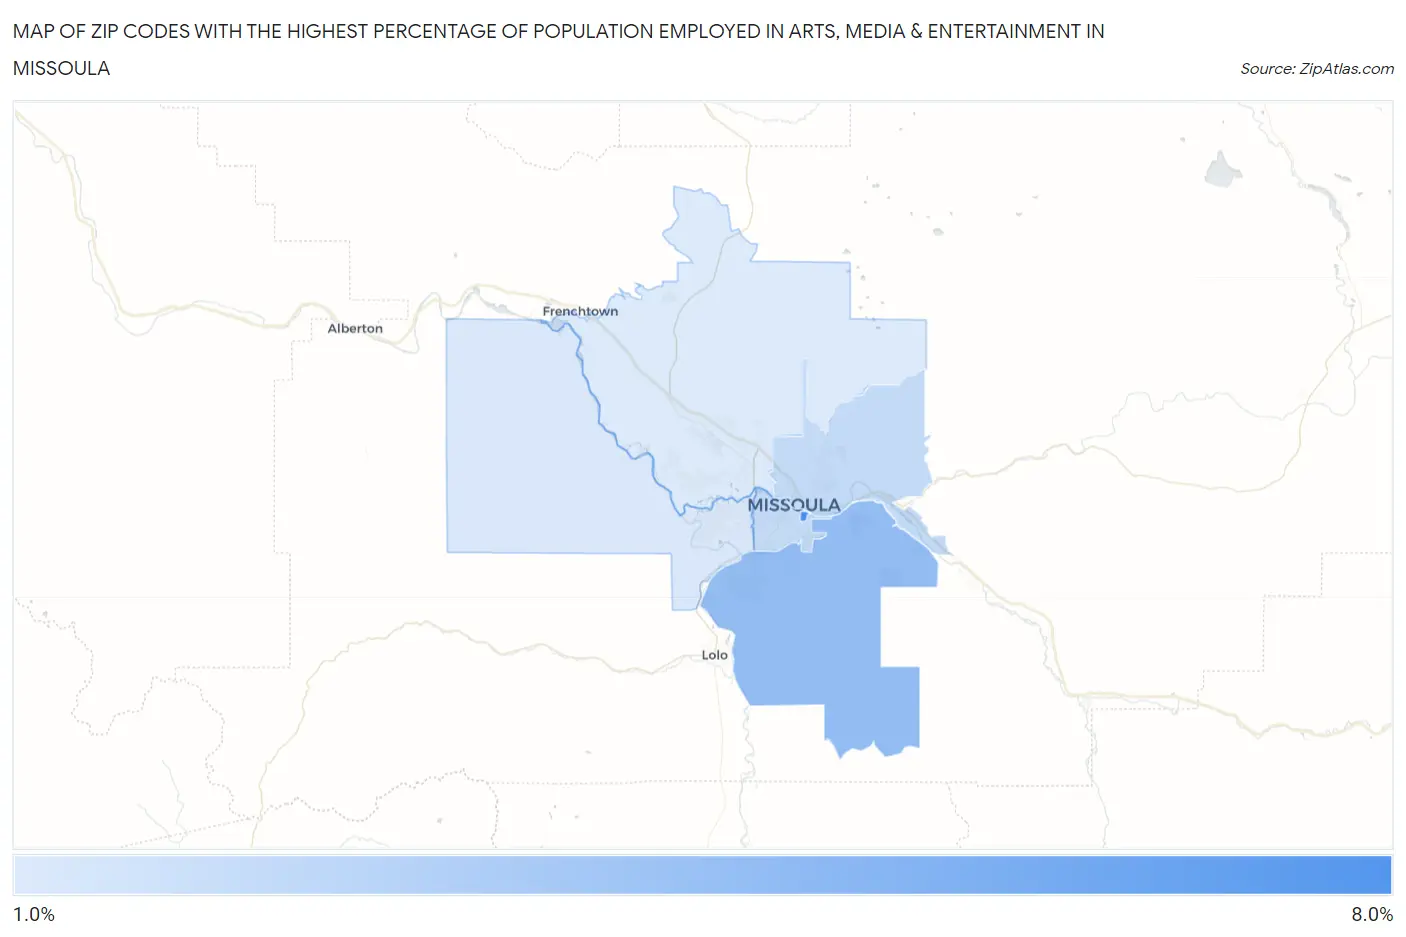
Map of Zip Codes with the Highest Percentage of Population Employed in Arts, Media & Entertainment in Missoula
1.6%
7.0%
Zip Codes with the Highest Percentage of Population Employed in Arts, Media & Entertainment in Missoula, MT
| Zip Code | % Employed | vs State | vs National | |
| 1. | 59812 | 7.0% | 2.0%(+5.08)#10 | 2.1%(+4.99)#752 |
| 2. | 59803 | 4.3% | 2.0%(+2.33)#27 | 2.1%(+2.23)#2,047 |
| 3. | 59802 | 2.5% | 2.0%(+0.543)#55 | 2.1%(+0.448)#5,525 |
| 4. | 59801 | 2.5% | 2.0%(+0.521)#57 | 2.1%(+0.427)#5,593 |
| 5. | 59804 | 1.7% | 2.0%(-0.221)#88 | 2.1%(-0.315)#9,296 |
| 6. | 59808 | 1.6% | 2.0%(-0.319)#95 | 2.1%(-0.414)#10,017 |
1
Common Questions
What are the Top 5 Zip Codes with the Highest Percentage of Population Employed in Arts, Media & Entertainment in Missoula, MT?
Top 5 Zip Codes with the Highest Percentage of Population Employed in Arts, Media & Entertainment in Missoula, MT are:
What zip code has the Highest Percentage of Population Employed in Arts, Media & Entertainment in Missoula, MT?
59812 has the Highest Percentage of Population Employed in Arts, Media & Entertainment in Missoula, MT with 7.0%.
What is the Percentage of Population Employed in Arts, Media & Entertainment in Missoula, MT?
Percentage of Population Employed in Arts, Media & Entertainment in Missoula is 2.8%.
What is the Percentage of Population Employed in Arts, Media & Entertainment in Montana?
Percentage of Population Employed in Arts, Media & Entertainment in Montana is 2.0%.
What is the Percentage of Population Employed in Arts, Media & Entertainment in the United States?
Percentage of Population Employed in Arts, Media & Entertainment in the United States is 2.1%.