Zip Codes with the Highest Percentage of Households Without a Vehicle in Saint Joseph, MO
RELATED REPORTS & OPTIONS
Households without a Cars
Saint Joseph
Compare Zip Codes
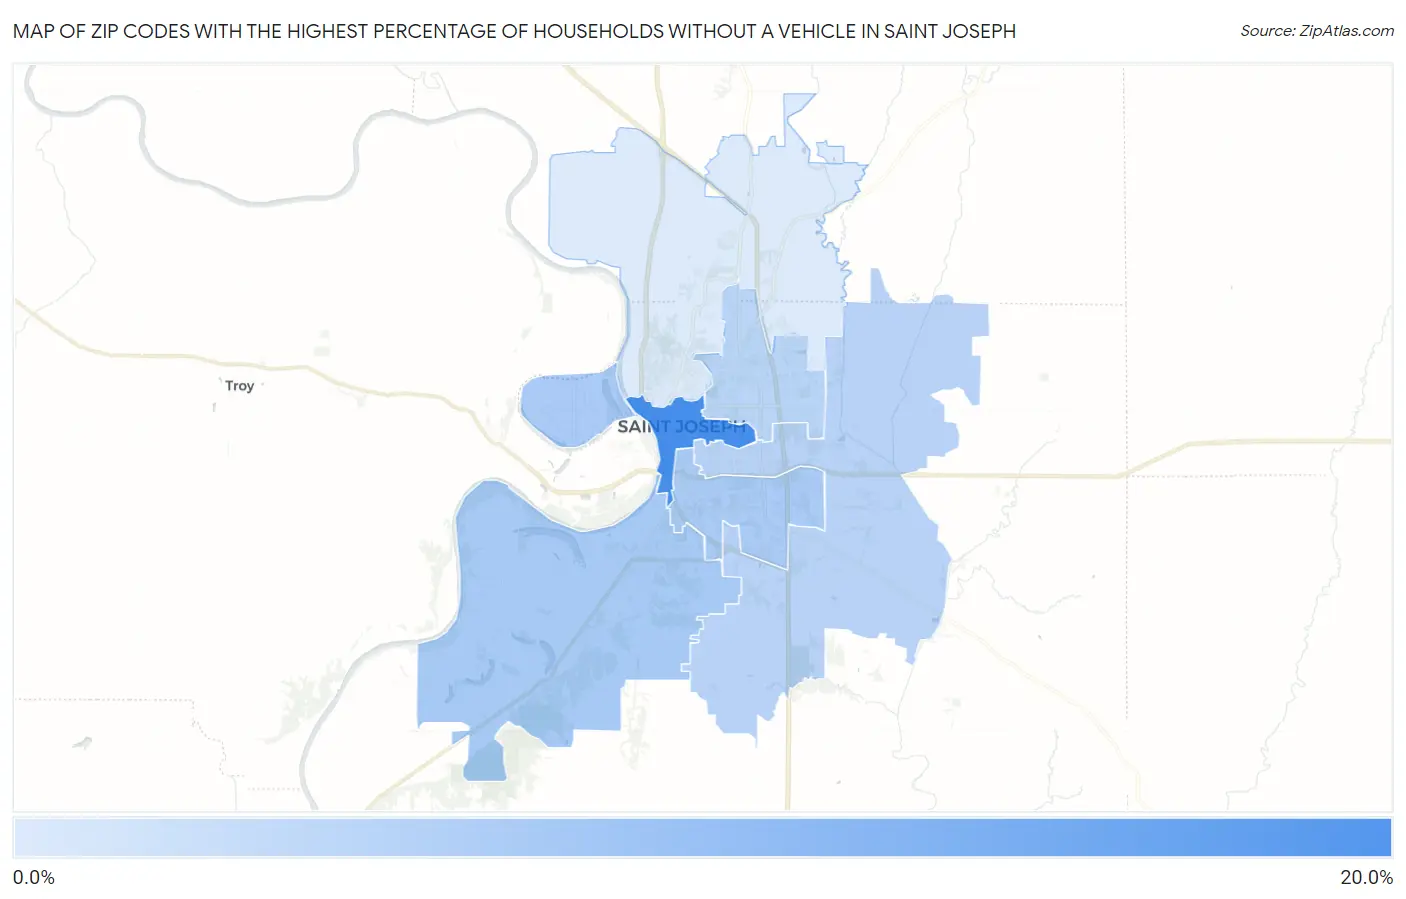
Map of Zip Codes with the Highest Percentage of Households Without a Vehicle in Saint Joseph
3.6%
19.4%
Zip Codes with the Highest Percentage of Households Without a Vehicle in Saint Joseph, MO
| Zip Code | Housholds Without a Car | vs State | vs National | |
| 1. | 64501 | 19.4% | 6.6%(+12.8)#41 | 8.3%(+11.1)#1,580 |
| 2. | 64504 | 8.9% | 6.6%(+2.30)#157 | 8.3%(+0.600)#5,865 |
| 3. | 64503 | 8.6% | 6.6%(+2.00)#166 | 8.3%(+0.300)#6,216 |
| 4. | 64507 | 7.4% | 6.6%(+0.800)#224 | 8.3%(-0.900)#7,895 |
| 5. | 64506 | 7.1% | 6.6%(+0.500)#248 | 8.3%(-1.20)#8,394 |
| 6. | 64505 | 3.6% | 6.6%(-3.00)#543 | 8.3%(-4.70)#17,064 |
1
Common Questions
What are the Top 5 Zip Codes with the Highest Percentage of Households Without a Vehicle in Saint Joseph, MO?
Top 5 Zip Codes with the Highest Percentage of Households Without a Vehicle in Saint Joseph, MO are:
What zip code has the Highest Percentage of Households Without a Vehicle in Saint Joseph, MO?
64501 has the Highest Percentage of Households Without a Vehicle in Saint Joseph, MO with 19.4%.
What is the Percentage of Households Without a Vehicle in Missouri?
Percentage of Households Without a Vehicle in Missouri is 6.6%.
What is the Percentage of Households Without a Vehicle in the United States?
Percentage of Households Without a Vehicle in the United States is 8.3%.