Zip Codes with the Highest Percentage of Population Employed in Architecture & Engineering in Saint Joseph, MO
RELATED REPORTS & OPTIONS
Architecture & Engineering
Saint Joseph
Compare Zip Codes
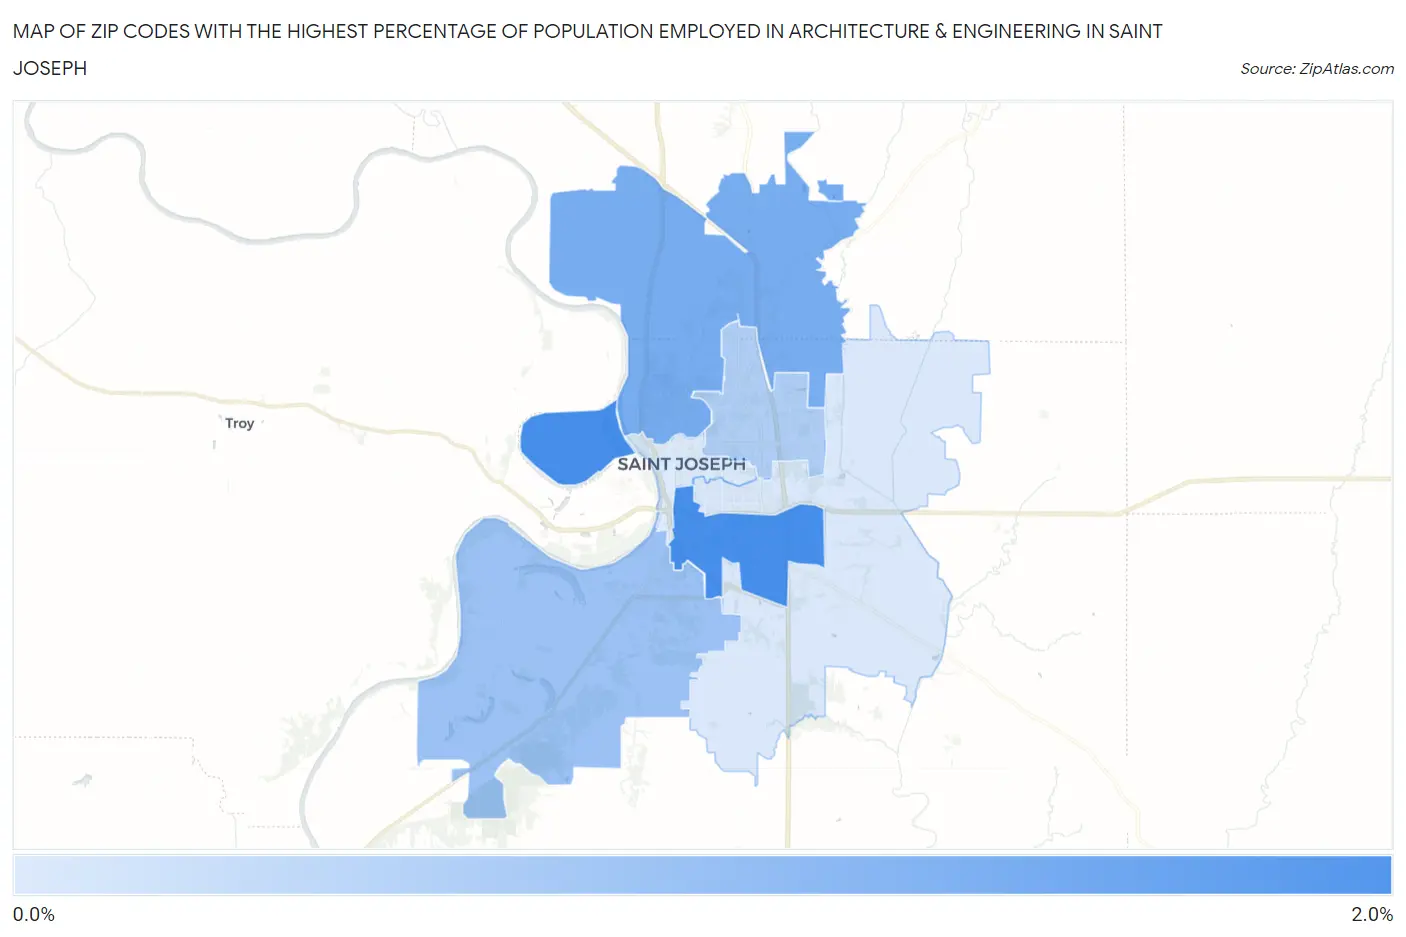
Map of Zip Codes with the Highest Percentage of Population Employed in Architecture & Engineering in Saint Joseph
0.61%
1.8%
Zip Codes with the Highest Percentage of Population Employed in Architecture & Engineering in Saint Joseph, MO
| Zip Code | % Employed | vs State | vs National | |
| 1. | 64503 | 1.8% | 1.7%(+0.110)#208 | 2.1%(-0.335)#10,751 |
| 2. | 64505 | 1.4% | 1.7%(-0.273)#265 | 2.1%(-0.718)#13,350 |
| 3. | 64504 | 1.1% | 1.7%(-0.560)#317 | 2.1%(-1.00)#15,528 |
| 4. | 64506 | 0.98% | 1.7%(-0.728)#354 | 2.1%(-1.17)#16,793 |
| 5. | 64507 | 0.63% | 1.7%(-1.07)#444 | 2.1%(-1.52)#19,382 |
| 6. | 64501 | 0.61% | 1.7%(-1.10)#449 | 2.1%(-1.54)#19,557 |
1
Common Questions
What are the Top 5 Zip Codes with the Highest Percentage of Population Employed in Architecture & Engineering in Saint Joseph, MO?
Top 5 Zip Codes with the Highest Percentage of Population Employed in Architecture & Engineering in Saint Joseph, MO are:
What zip code has the Highest Percentage of Population Employed in Architecture & Engineering in Saint Joseph, MO?
64503 has the Highest Percentage of Population Employed in Architecture & Engineering in Saint Joseph, MO with 1.8%.
What is the Percentage of Population Employed in Architecture & Engineering in Missouri?
Percentage of Population Employed in Architecture & Engineering in Missouri is 1.7%.
What is the Percentage of Population Employed in Architecture & Engineering in the United States?
Percentage of Population Employed in Architecture & Engineering in the United States is 2.1%.