Zip Codes with the Highest Percentage of Population with a Degree in Liberal Arts and History in Saint Joseph, MO
RELATED REPORTS & OPTIONS
Liberal Arts and History
Saint Joseph
Compare Zip Codes
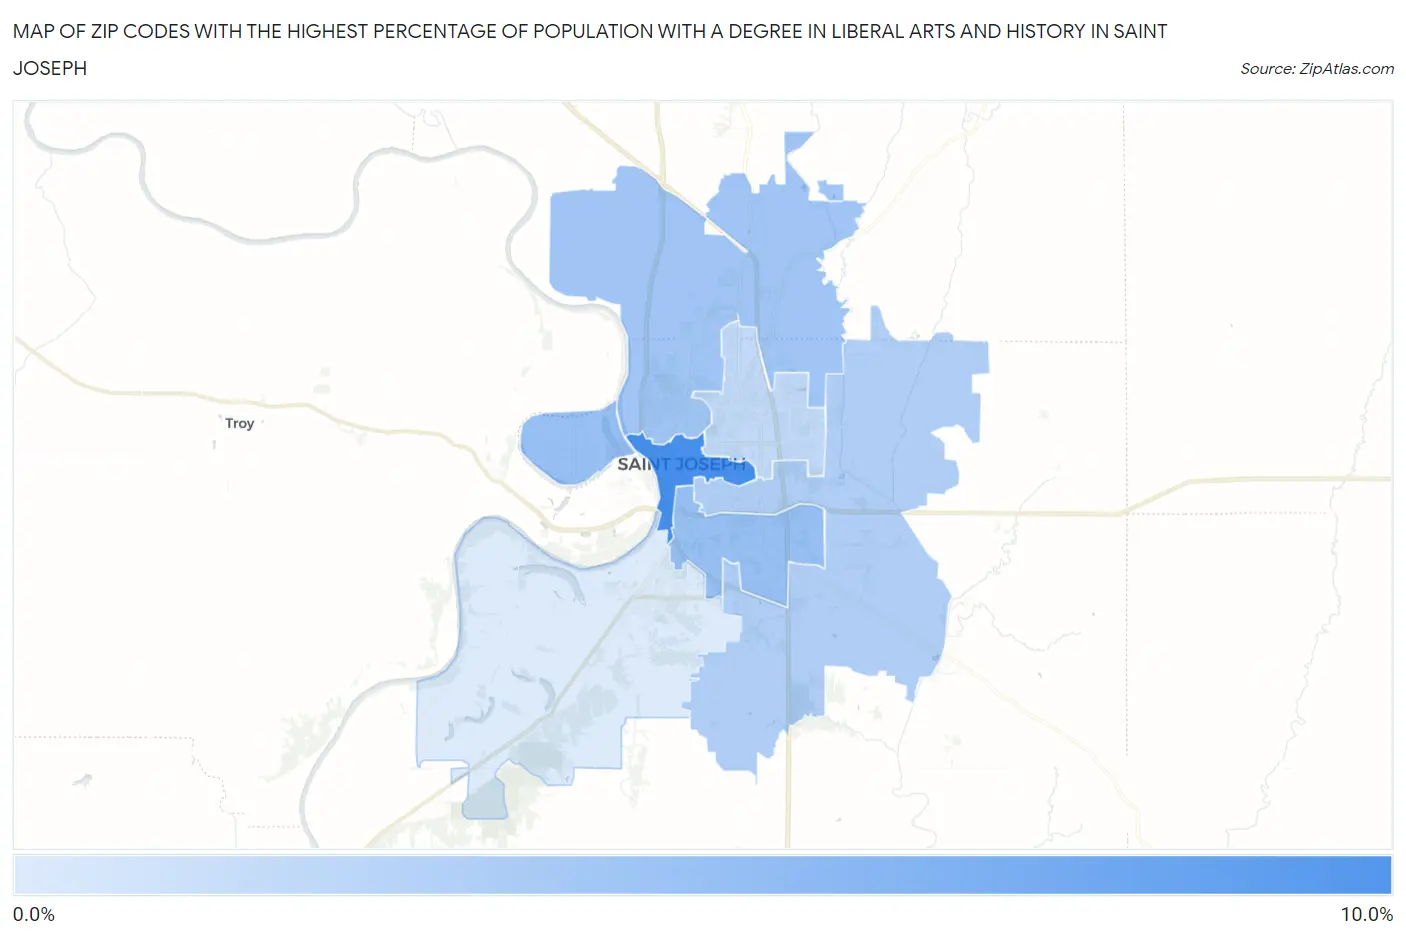
Map of Zip Codes with the Highest Percentage of Population with a Degree in Liberal Arts and History in Saint Joseph
1.4%
9.6%
Zip Codes with the Highest Percentage of Population with a Degree in Liberal Arts and History in Saint Joseph, MO
| Zip Code | % Graduates | vs State | vs National | |
| 1. | 64501 | 9.6% | 4.6%(+4.98)#108 | 4.9%(+4.68)#3,410 |
| 2. | 64503 | 5.1% | 4.6%(+0.530)#287 | 4.9%(+0.229)#11,037 |
| 3. | 64505 | 4.6% | 4.6%(+0.046)#320 | 4.9%(-0.256)#12,592 |
| 4. | 64507 | 3.8% | 4.6%(-0.765)#401 | 4.9%(-1.07)#15,502 |
| 5. | 64506 | 2.9% | 4.6%(-1.65)#478 | 4.9%(-1.95)#18,614 |
| 6. | 64504 | 1.4% | 4.6%(-3.15)#586 | 4.9%(-3.45)#22,655 |
1
Common Questions
What are the Top 5 Zip Codes with the Highest Percentage of Population with a Degree in Liberal Arts and History in Saint Joseph, MO?
Top 5 Zip Codes with the Highest Percentage of Population with a Degree in Liberal Arts and History in Saint Joseph, MO are:
What zip code has the Highest Percentage of Population with a Degree in Liberal Arts and History in Saint Joseph, MO?
64501 has the Highest Percentage of Population with a Degree in Liberal Arts and History in Saint Joseph, MO with 9.6%.
What is the Percentage of Population with a Degree in Liberal Arts and History in Missouri?
Percentage of Population with a Degree in Liberal Arts and History in Missouri is 4.6%.
What is the Percentage of Population with a Degree in Liberal Arts and History in the United States?
Percentage of Population with a Degree in Liberal Arts and History in the United States is 4.9%.