Zip Codes with the Highest Percentage of Immigrants from Asia in Saint Joseph, MO
RELATED REPORTS & OPTIONS
Asia
Saint Joseph
Compare Zip Codes
Map of Zip Codes with the Highest Percentage of Immigrants from Asia in Saint Joseph
0.15%
1.89%
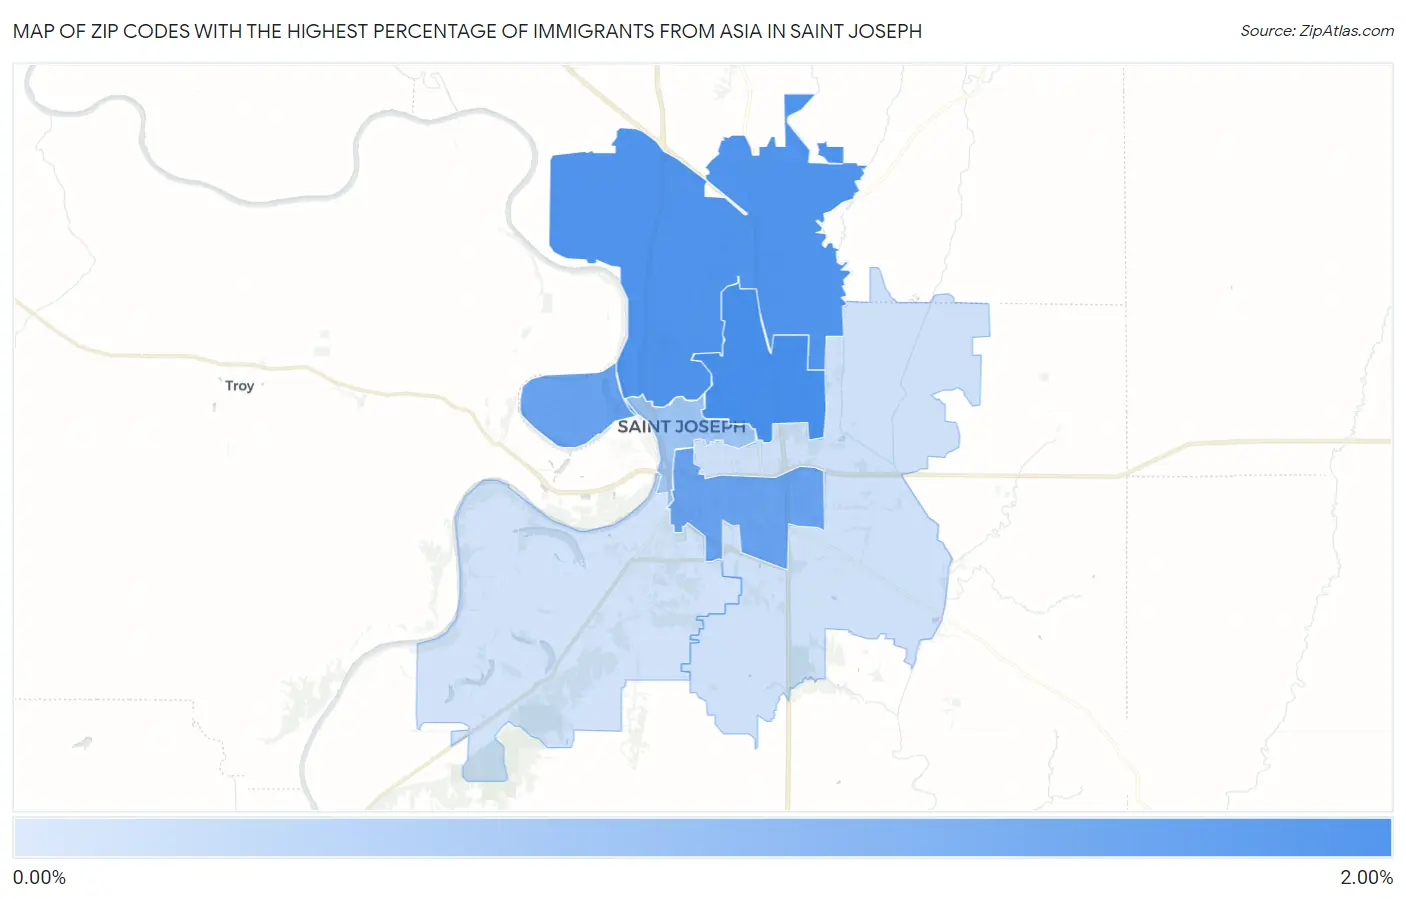
Zip Codes with the Highest Percentage of Immigrants from Asia in Saint Joseph, MO
| Zip Code | Asia | vs State | vs National | |
| 1. | 64506 | 1.89% | 1.64% (+0.255)#110 | 4.26% (-2.37)#7,086 |
| 2. | 64505 | 1.76% | 1.64% (+0.126)#117 | 4.26% (-2.50)#7,450 |
| 3. | 64503 | 1.47% | 1.64% (-0.167)#141 | 4.26% (-2.79)#8,370 |
| 4. | 64501 | 0.78% | 1.64% (-0.862)#212 | 4.26% (-3.48)#11,676 |
| 5. | 64507 | 0.17% | 1.64% (-1.46)#404 | 4.26% (-4.09)#17,410 |
| 6. | 64504 | 0.15% | 1.64% (-1.48)#414 | 4.26% (-4.11)#17,676 |
1
Common Questions
What are the Top 5 Zip Codes with the Highest Percentage of Immigrants from Asia in Saint Joseph, MO?
Top 5 Zip Codes with the Highest Percentage of Immigrants from Asia in Saint Joseph, MO are:
What zip code has the Highest Percentage of Immigrants from Asia in Saint Joseph, MO?
64506 has the Highest Percentage of Immigrants from Asia in Saint Joseph, MO with 1.89%.
What is the Percentage of Immigrants from Asia in Missouri?
Percentage of Immigrants from Asia in Missouri is 1.64%.
What is the Percentage of Immigrants from Asia in the United States?
Percentage of Immigrants from Asia in the United States is 4.26%.