Zip Codes with the Highest Percentage of Population Employed in Office & Administration in Burnsville, MN
RELATED REPORTS & OPTIONS
Office & Administration
Burnsville
Compare Zip Codes
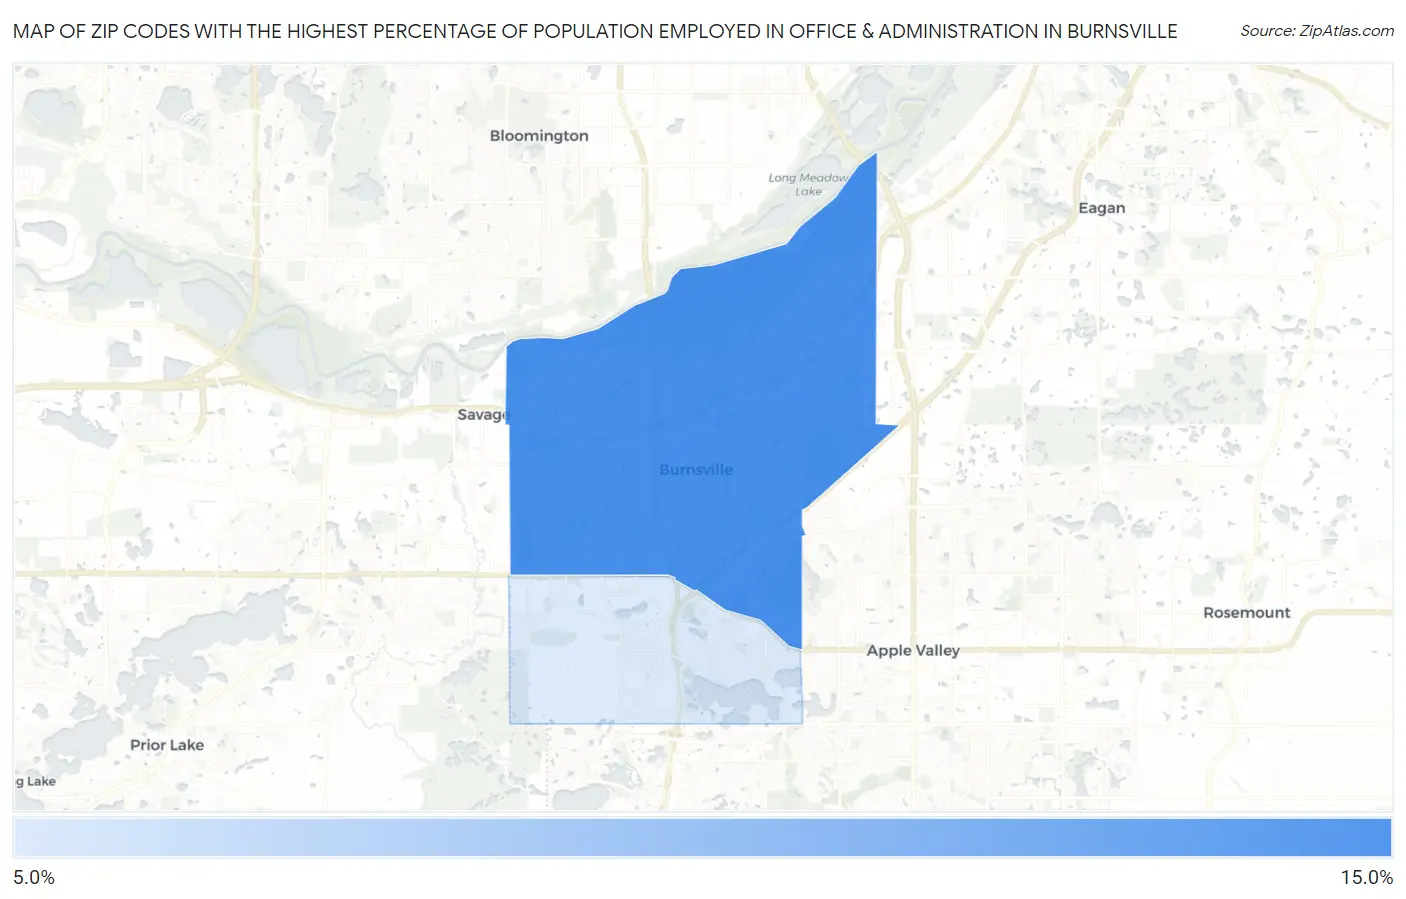
Map of Zip Codes with the Highest Percentage of Population Employed in Office & Administration in Burnsville
9.6%
12.4%
Zip Codes with the Highest Percentage of Population Employed in Office & Administration in Burnsville, MN
| Zip Code | % Employed | vs State | vs National | |
| 1. | 55337 | 12.4% | 10.3%(+2.14)#206 | 10.9%(+1.58)#9,458 |
| 2. | 55306 | 9.6% | 10.3%(-0.664)#526 | 10.9%(-1.22)#18,283 |
1
Common Questions
What are the Top Zip Codes with the Highest Percentage of Population Employed in Office & Administration in Burnsville, MN?
Top Zip Codes with the Highest Percentage of Population Employed in Office & Administration in Burnsville, MN are:
What zip code has the Highest Percentage of Population Employed in Office & Administration in Burnsville, MN?
55337 has the Highest Percentage of Population Employed in Office & Administration in Burnsville, MN with 12.4%.
What is the Percentage of Population Employed in Office & Administration in Burnsville, MN?
Percentage of Population Employed in Office & Administration in Burnsville is 11.7%.
What is the Percentage of Population Employed in Office & Administration in Minnesota?
Percentage of Population Employed in Office & Administration in Minnesota is 10.3%.
What is the Percentage of Population Employed in Office & Administration in the United States?
Percentage of Population Employed in Office & Administration in the United States is 10.9%.