Zip Codes with the Highest Percentage of Population Employed in Food Preparation & Serving in Burnsville, MN
RELATED REPORTS & OPTIONS
Food Preparation & Serving
Burnsville
Compare Zip Codes
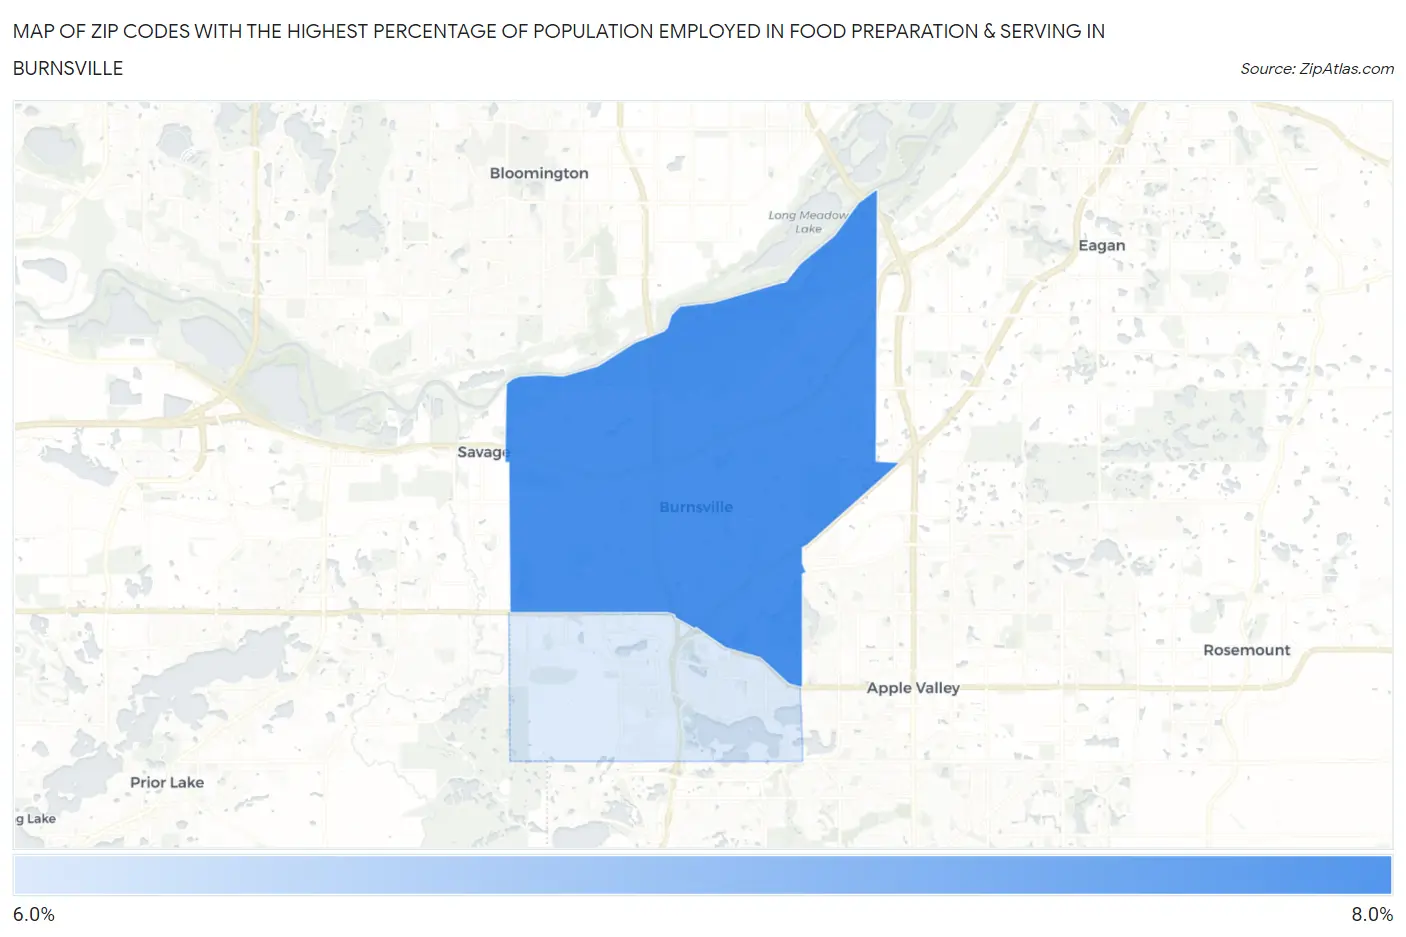
Map of Zip Codes with the Highest Percentage of Population Employed in Food Preparation & Serving in Burnsville
6.7%
7.2%
Zip Codes with the Highest Percentage of Population Employed in Food Preparation & Serving in Burnsville, MN
| Zip Code | % Employed | vs State | vs National | |
| 1. | 55337 | 7.2% | 4.7%(+2.51)#107 | 5.3%(+1.95)#6,051 |
| 2. | 55306 | 6.7% | 4.7%(+1.96)#132 | 5.3%(+1.40)#7,369 |
1
Common Questions
What are the Top Zip Codes with the Highest Percentage of Population Employed in Food Preparation & Serving in Burnsville, MN?
Top Zip Codes with the Highest Percentage of Population Employed in Food Preparation & Serving in Burnsville, MN are:
What zip code has the Highest Percentage of Population Employed in Food Preparation & Serving in Burnsville, MN?
55337 has the Highest Percentage of Population Employed in Food Preparation & Serving in Burnsville, MN with 7.2%.
What is the Percentage of Population Employed in Food Preparation & Serving in Burnsville, MN?
Percentage of Population Employed in Food Preparation & Serving in Burnsville is 7.1%.
What is the Percentage of Population Employed in Food Preparation & Serving in Minnesota?
Percentage of Population Employed in Food Preparation & Serving in Minnesota is 4.7%.
What is the Percentage of Population Employed in Food Preparation & Serving in the United States?
Percentage of Population Employed in Food Preparation & Serving in the United States is 5.3%.