Zip Codes with the Highest Percentage of Families with Income Below $10,000 in Burnsville, MN
RELATED REPORTS & OPTIONS
Family Income | $0-10k
Burnsville
Compare Zip Codes
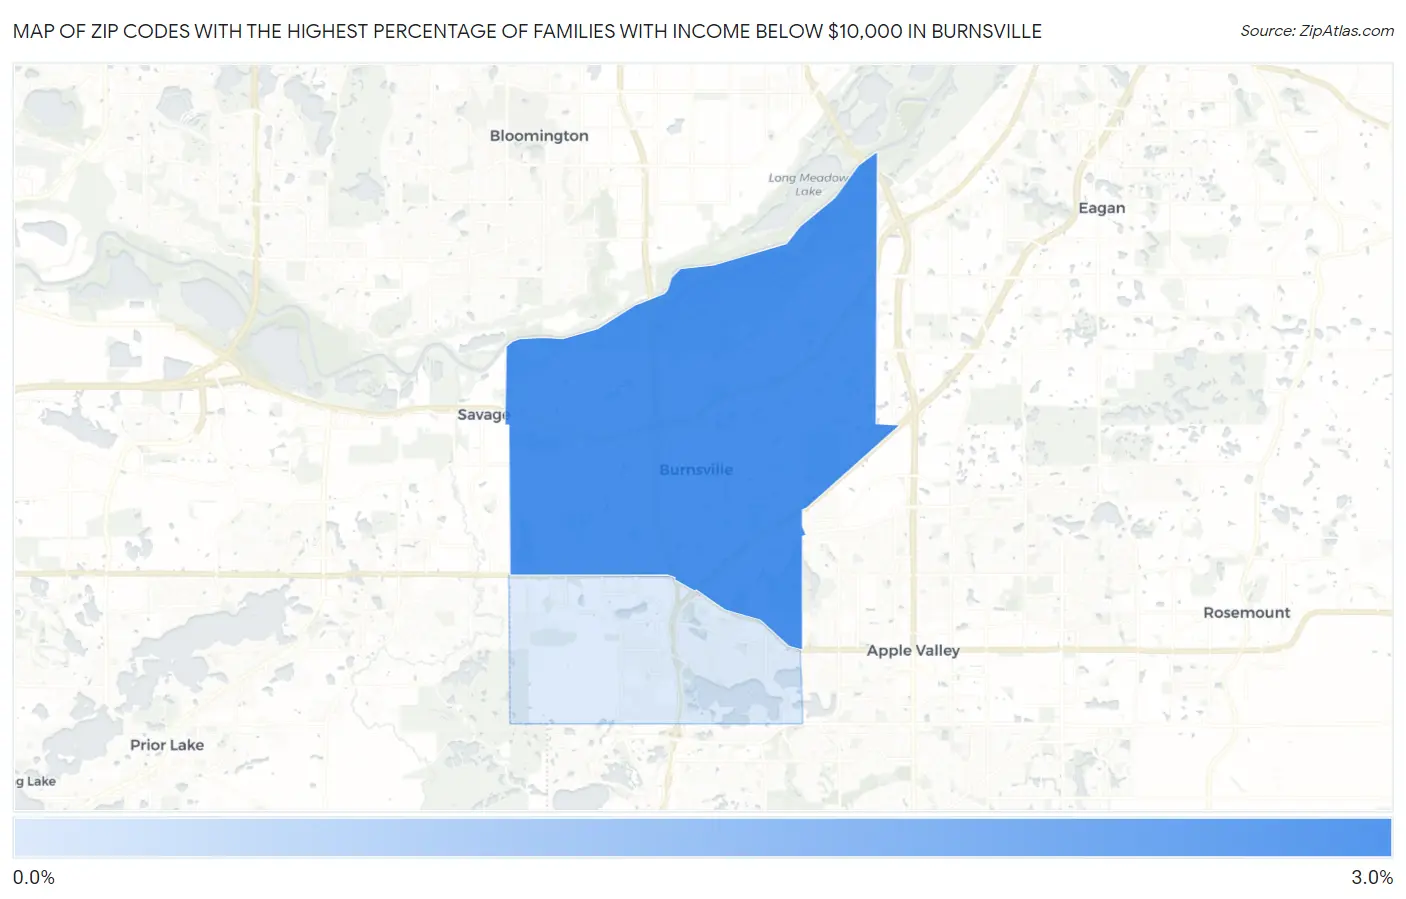
Map of Zip Codes with the Highest Percentage of Families with Income Below $10,000 in Burnsville
0.50%
2.7%
Zip Codes with the Highest Percentage of Families with Income Below $10,000 in Burnsville, MN
| Zip Code | Families with Income < $10k | vs State | vs National | |
| 1. | 55337 | 2.7% | 1.8%(+0.900)#203 | 3.1%(-0.400)#12,214 |
| 2. | 55306 | 0.50% | 1.8%(-1.30)#634 | 3.1%(-2.60)#22,684 |
1
Common Questions
What are the Top Zip Codes with the Highest Percentage of Families with Income Below $10,000 in Burnsville, MN?
Top Zip Codes with the Highest Percentage of Families with Income Below $10,000 in Burnsville, MN are:
What zip code has the Highest Percentage of Families with Income Below $10,000 in Burnsville, MN?
55337 has the Highest Percentage of Families with Income Below $10,000 in Burnsville, MN with 2.7%.
What is the Percentage of Families with Income Below $10,000 in Burnsville, MN?
Percentage of Families with Income Below $10,000 in Burnsville is 2.2%.
What is the Percentage of Families with Income Below $10,000 in Minnesota?
Percentage of Families with Income Below $10,000 in Minnesota is 1.8%.
What is the Percentage of Families with Income Below $10,000 in the United States?
Percentage of Families with Income Below $10,000 in the United States is 3.1%.