Zip Codes with the Highest Percentage of Population Employed in Legal Services & Support in White Lake, MI
RELATED REPORTS & OPTIONS
Legal Services & Support
White Lake
Compare Zip Codes
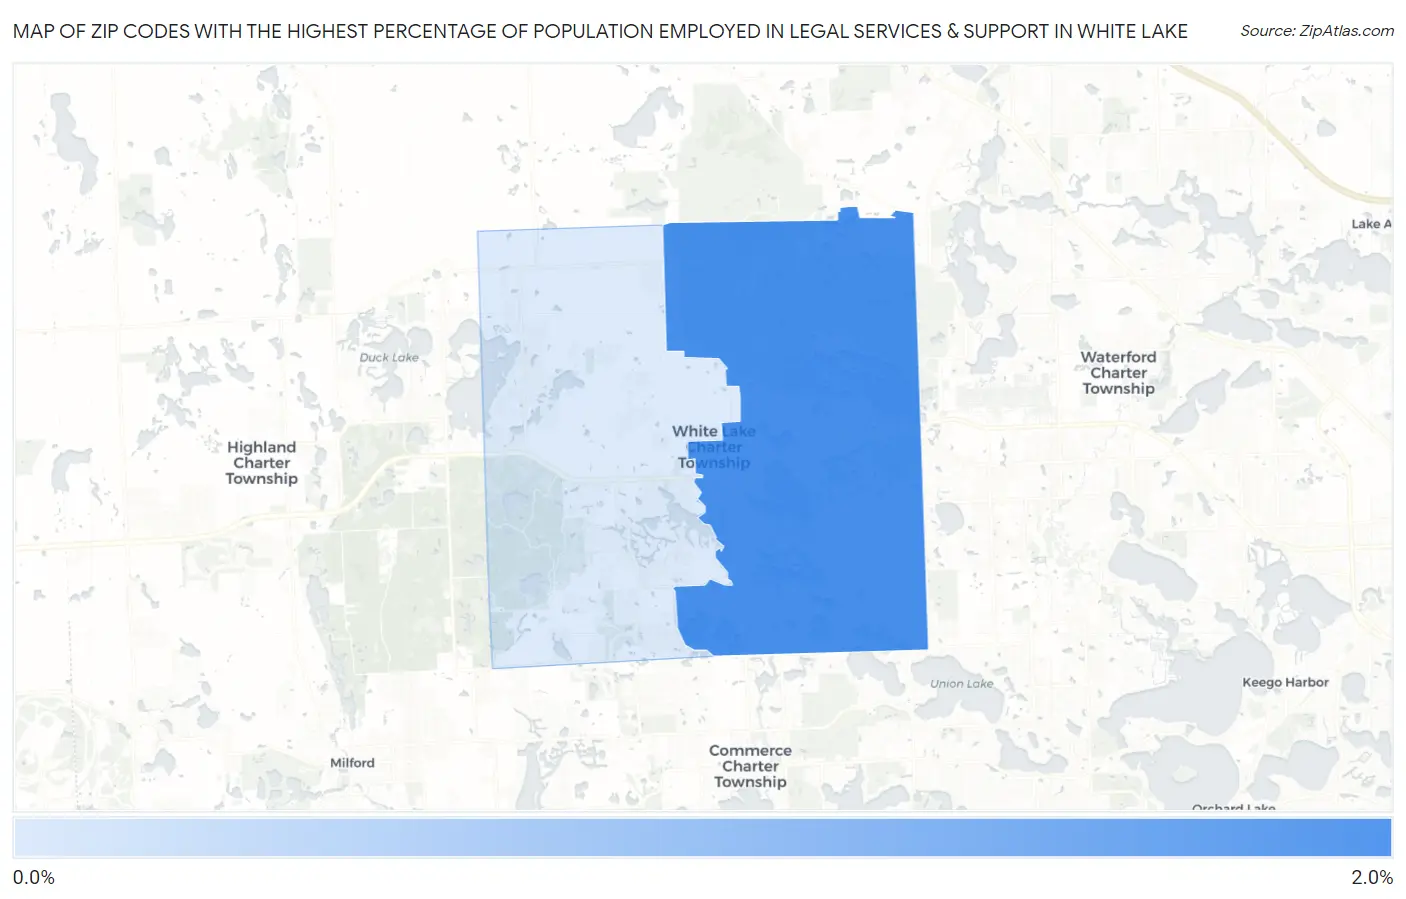
Map of Zip Codes with the Highest Percentage of Population Employed in Legal Services & Support in White Lake
0.93%
1.6%
Zip Codes with the Highest Percentage of Population Employed in Legal Services & Support in White Lake, MI
| Zip Code | % Employed | vs State | vs National | |
| 1. | 48386 | 1.6% | 0.89%(+0.667)#103 | 1.2%(+0.369)#4,836 |
| 2. | 48383 | 0.93% | 0.89%(+0.043)#216 | 1.2%(-0.255)#8,361 |
1
Common Questions
What are the Top Zip Codes with the Highest Percentage of Population Employed in Legal Services & Support in White Lake, MI?
Top Zip Codes with the Highest Percentage of Population Employed in Legal Services & Support in White Lake, MI are:
What zip code has the Highest Percentage of Population Employed in Legal Services & Support in White Lake, MI?
48386 has the Highest Percentage of Population Employed in Legal Services & Support in White Lake, MI with 1.6%.
What is the Percentage of Population Employed in Legal Services & Support in Michigan?
Percentage of Population Employed in Legal Services & Support in Michigan is 0.89%.
What is the Percentage of Population Employed in Legal Services & Support in the United States?
Percentage of Population Employed in Legal Services & Support in the United States is 1.2%.