Zip Codes with the Highest Percentage of Population Employed in Legal Services & Support in Plant City, FL
RELATED REPORTS & OPTIONS
Legal Services & Support
Plant City
Compare Zip Codes
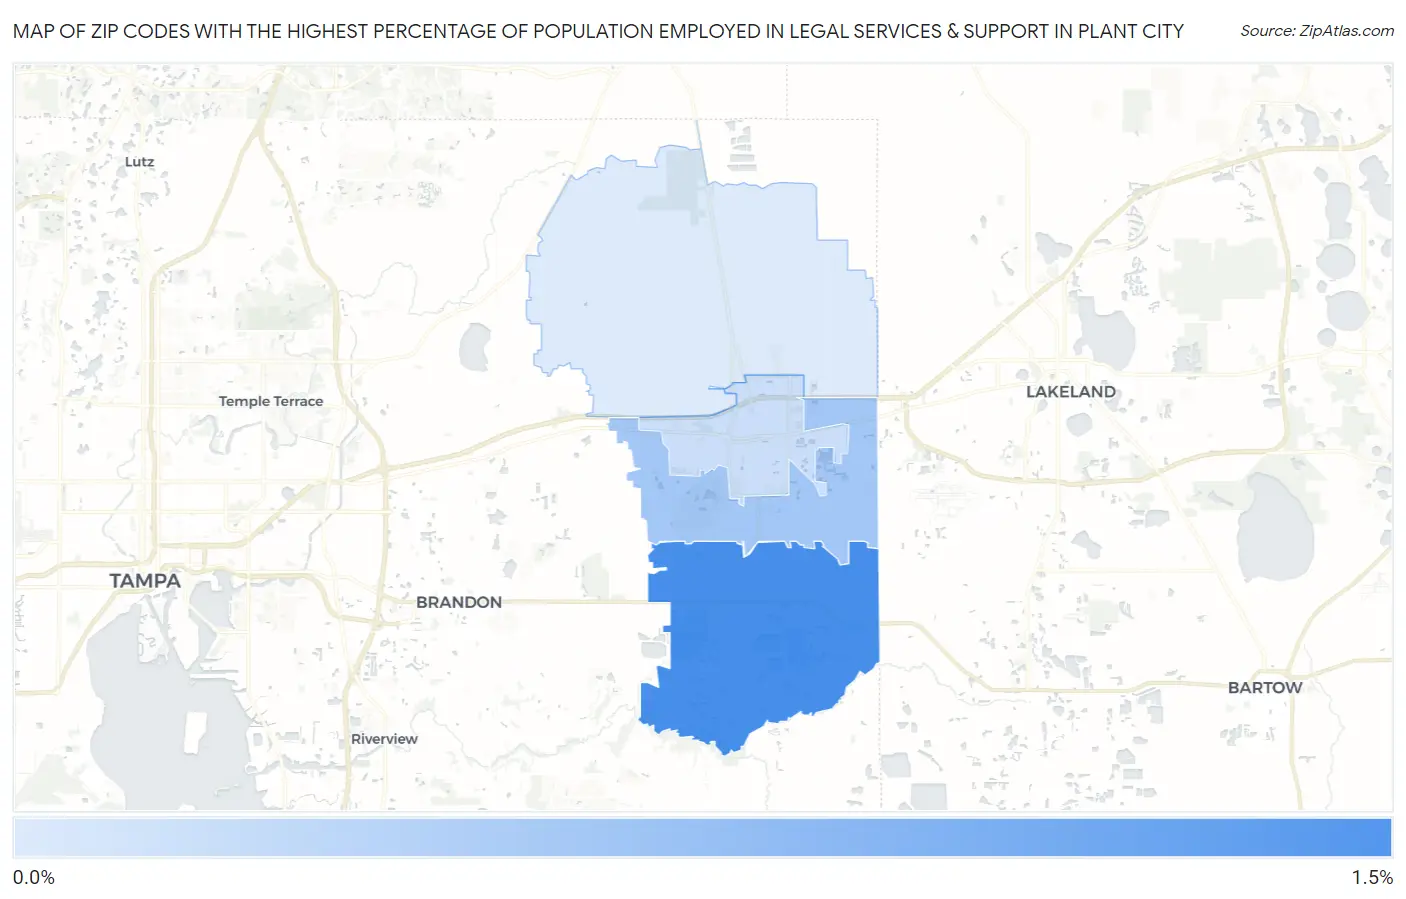
Map of Zip Codes with the Highest Percentage of Population Employed in Legal Services & Support in Plant City
0.14%
1.3%
Zip Codes with the Highest Percentage of Population Employed in Legal Services & Support in Plant City, FL
| Zip Code | % Employed | vs State | vs National | |
| 1. | 33567 | 1.3% | 1.3%(-0.007)#306 | 1.2%(+0.126)#5,893 |
| 2. | 33566 | 0.58% | 1.3%(-0.733)#602 | 1.2%(-0.600)#11,629 |
| 3. | 33563 | 0.28% | 1.3%(-1.04)#725 | 1.2%(-0.906)#15,287 |
| 4. | 33565 | 0.14% | 1.3%(-1.17)#779 | 1.2%(-1.04)#16,766 |
1
Common Questions
What are the Top 3 Zip Codes with the Highest Percentage of Population Employed in Legal Services & Support in Plant City, FL?
Top 3 Zip Codes with the Highest Percentage of Population Employed in Legal Services & Support in Plant City, FL are:
What zip code has the Highest Percentage of Population Employed in Legal Services & Support in Plant City, FL?
33567 has the Highest Percentage of Population Employed in Legal Services & Support in Plant City, FL with 1.3%.
What is the Percentage of Population Employed in Legal Services & Support in Plant City, FL?
Percentage of Population Employed in Legal Services & Support in Plant City is 0.55%.
What is the Percentage of Population Employed in Legal Services & Support in Florida?
Percentage of Population Employed in Legal Services & Support in Florida is 1.3%.
What is the Percentage of Population Employed in Legal Services & Support in the United States?
Percentage of Population Employed in Legal Services & Support in the United States is 1.2%.