Zip Codes with the Highest Percentage of Population with a Degree in Visual and Performing Arts in Clermont, FL
RELATED REPORTS & OPTIONS
Visual and Performing Arts
Clermont
Compare Zip Codes
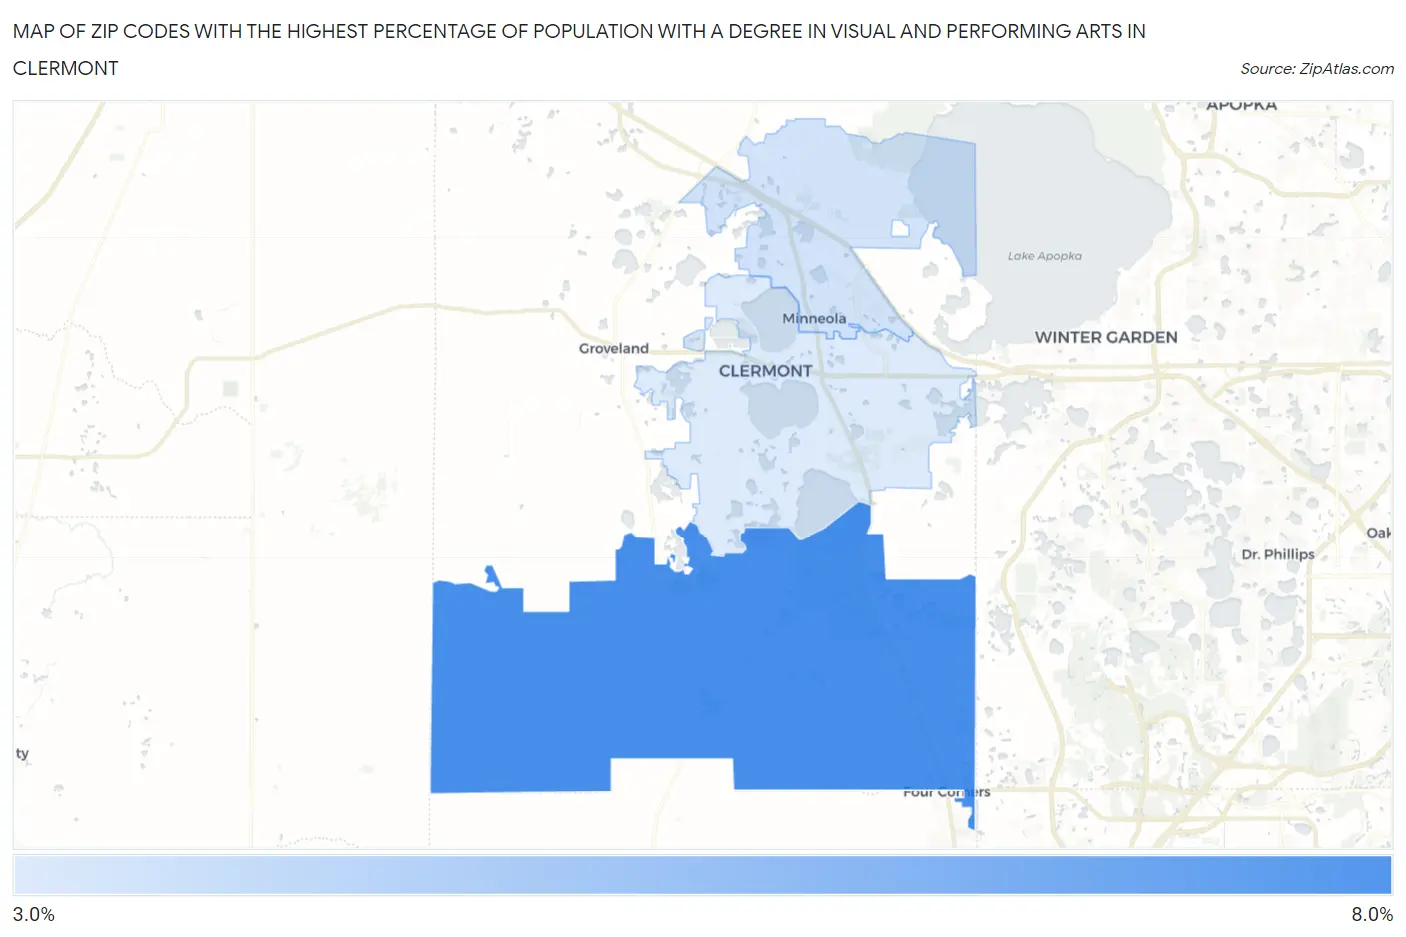
Map of Zip Codes with the Highest Percentage of Population with a Degree in Visual and Performing Arts in Clermont
3.5%
6.4%
Zip Codes with the Highest Percentage of Population with a Degree in Visual and Performing Arts in Clermont, FL
| Zip Code | % Graduates | vs State | vs National | |
| 1. | 34714 | 6.4% | 3.3%(+3.09)#69 | 4.3%(+2.19)#4,299 |
| 2. | 34715 | 3.7% | 3.3%(+0.359)#309 | 4.3%(-0.545)#10,140 |
| 3. | 34711 | 3.5% | 3.3%(+0.133)#361 | 4.3%(-0.771)#10,949 |
1
Common Questions
What are the Top Zip Codes with the Highest Percentage of Population with a Degree in Visual and Performing Arts in Clermont, FL?
Top Zip Codes with the Highest Percentage of Population with a Degree in Visual and Performing Arts in Clermont, FL are:
What zip code has the Highest Percentage of Population with a Degree in Visual and Performing Arts in Clermont, FL?
34714 has the Highest Percentage of Population with a Degree in Visual and Performing Arts in Clermont, FL with 6.4%.
What is the Percentage of Population with a Degree in Visual and Performing Arts in Clermont, FL?
Percentage of Population with a Degree in Visual and Performing Arts in Clermont is 2.0%.
What is the Percentage of Population with a Degree in Visual and Performing Arts in Florida?
Percentage of Population with a Degree in Visual and Performing Arts in Florida is 3.3%.
What is the Percentage of Population with a Degree in Visual and Performing Arts in the United States?
Percentage of Population with a Degree in Visual and Performing Arts in the United States is 4.3%.