Zip Codes with the Highest Percentage of Population Employed in Legal Services & Support in Boynton Beach, FL

RELATED REPORTS & OPTIONS

Legal Services & Support
Population
Families and Households
Female Fertility
Female Fertility (Unmarried)
Race (Community Size)
Race (Percentage)
Ancestry (Community Size)
AfricanAlbanianAmericanArabArgentineanArmenianAustralianAustrianBahamianBelgianBhutaneseBolivianBrazilianBritishBulgarianBurmeseCanadianCentral AmericanCentral American IndianCherokeeChileanColombianCroatianCubanCzechCzechoslovakianDanishDominicanDutchEastern EuropeanEcuadorianEgyptianEnglishEuropeanFinnishFrenchFrench CanadianGermanGreekGuatemalanGuyaneseHaitianHonduranHungarianIndian (Asian)IranianIraqiIrishIsraeliItalianJamaicanKoreanLaotianLatvianLebaneseLithuanianMexicanMoroccanNative HawaiianNicaraguanNigerianNorthern EuropeanNorwegianPakistaniPanamanianPeruvianPolishPortuguesePuerto RicanRomanianRussianSalvadoranScandinavianScotch-IrishScottishSerbianSlavicSlovakSouth AfricanSouth AmericanSpaniardSpanishSri LankanSubsaharan AfricanSwedishSwissSyrianThaiTrinidadian and TobagonianTurkishUkrainianUruguayanVenezuelanVietnameseWelshWest IndianYugoslavian
Ancestry (Percentage)
AfricanAlbanianAmericanArabArgentineanArmenianAustralianAustrianBahamianBelgianBhutaneseBolivianBrazilianBritishBulgarianBurmeseCanadianCentral AmericanCentral American IndianCherokeeChileanColombianCroatianCubanCzechCzechoslovakianDanishDominicanDutchEastern EuropeanEcuadorianEgyptianEnglishEuropeanFinnishFrenchFrench CanadianGermanGreekGuatemalanGuyaneseHaitianHonduranHungarianIndian (Asian)IranianIraqiIrishIsraeliItalianJamaicanKoreanLaotianLatvianLebaneseLithuanianMexicanMoroccanNative HawaiianNicaraguanNigerianNorthern EuropeanNorwegianPakistaniPanamanianPeruvianPolishPortuguesePuerto RicanRomanianRussianSalvadoranScandinavianScotch-IrishScottishSerbianSlavicSlovakSouth AfricanSouth AmericanSpaniardSpanishSri LankanSubsaharan AfricanSwedishSwissSyrianThaiTrinidadian and TobagonianTurkishUkrainianUruguayanVenezuelanVietnameseWelshWest IndianYugoslavian
Immigrant Origin (Total)
Immigrant Origin (Percentage)
Income
Income (Families)
Income (Households)
Poverty
Poverty (Families)
Unemployment
Employment Occupations
Employment Industries
Employer Class
Commute Time
Commute Means
School Enrollment
Education by Degree Field
Occupancy
Finances
Physical Characteristics
Boynton Beach
States
Florida Cities
Altamonte SpringsApopkaBoca RatonBonita SpringsBoynton BeachBradentonBrandonBrooksvilleCape CoralClearwaterClermontCocoaCoral SpringsCrestviewCrystal RiverDade CityDavenportDaytona BeachDeerfield BeachDefuniak SpringsDelandDelray BeachDeltonaEnglewoodEustisFort LauderdaleFort MyersFort PierceFort Walton BeachGainesvilleGulf BreezeHialeahHolidayHollywoodHomesteadHudsonInvernessJacksonvilleJupiterKissimmeeLake CityLake WalesLake WorthLakelandLand O LakesLargoLeesburgLehigh AcresLongwoodLutzMariannaMelbourneMerritt IslandMiamiMiami BeachMiltonNaplesNew Port RicheyNew Smyrna BeachNorth Fort MyersNorth PortOcalaOkeechobeeOrange ParkOrlandoOrmond BeachOviedoPalm BayPalm Beach GardensPalm CoastPalm HarborPanama CityPanama City BeachPensacolaPerryPinellas ParkPlant CityPompano BeachPort CharlottePort OrangePort Saint LuciePunta GordaRiverviewSaint AugustineSaint CloudSaint PetersburgSanfordSarasotaSebastianSebringSeminoleSpring HillStuartTallahasseeTampaTarpon SpringsThe VillagesTitusvilleValricoVeniceVero BeachWesley ChapelWest Palm BeachWinter HavenWinter ParkZephyrhills
Compare Zip Codes
Comparison Subject

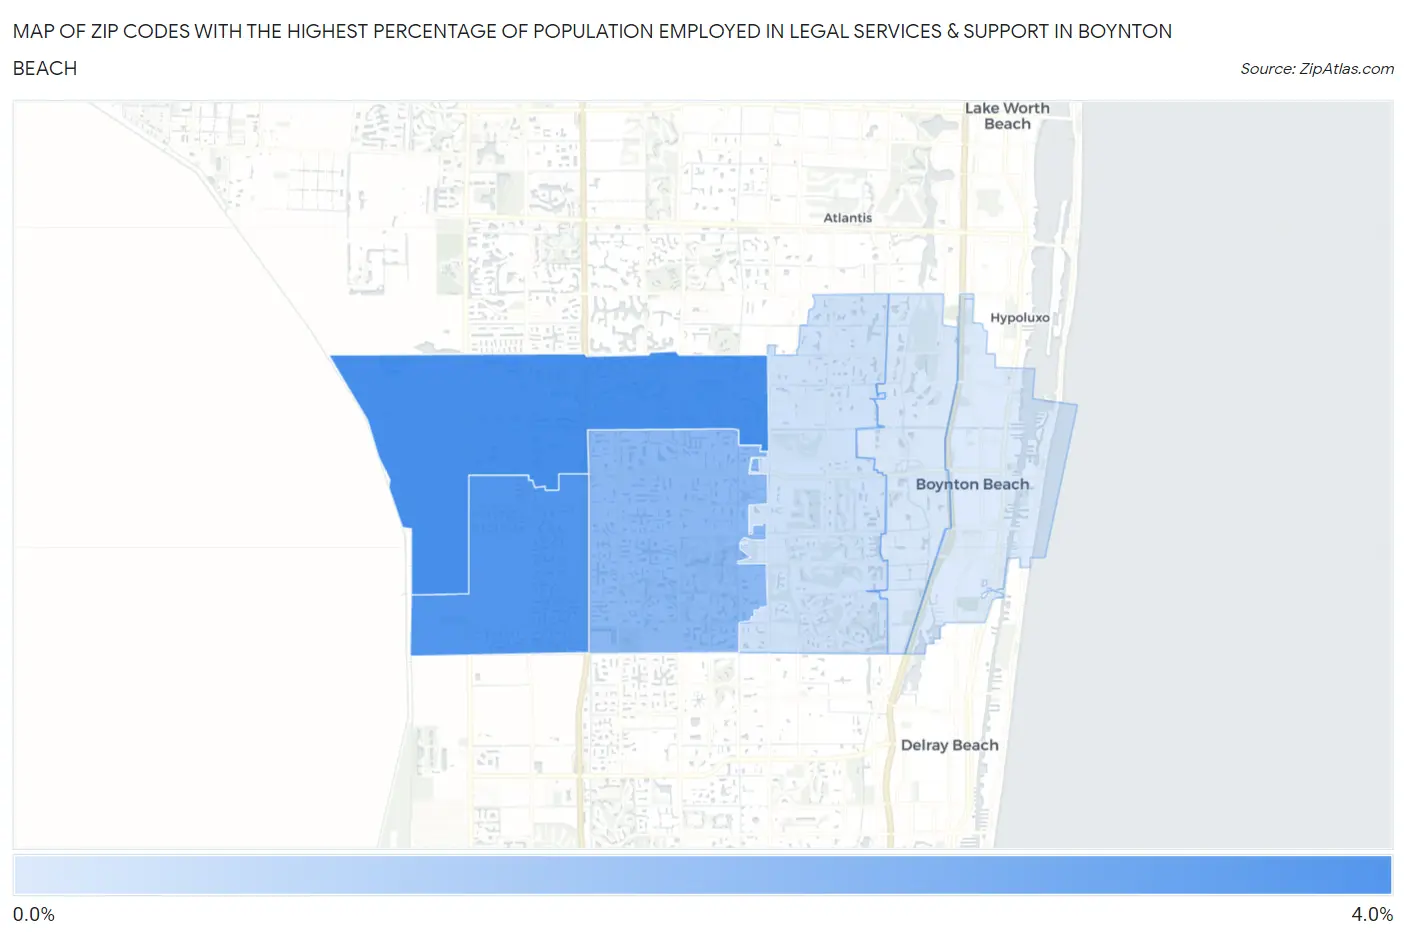
Map of Zip Codes with the Highest Percentage of Population Employed in Legal Services & Support in Boynton Beach

0.0%
4.0%
Zip Codes with the Highest Percentage of Population Employed in Legal Services & Support in Boynton Beach Map

Zip Codes with the Highest Percentage of Population Employed in Legal Services & Support in Boynton Beach, FL

Zip Code % Employed vs State vs National
1.334723.3%1.3%(+2.00)#681.2%(+2.13)#1,569
2.334733.1%1.3%(+1.77)#821.2%(+1.90)#1,767
3.334372.1%1.3%(+0.740)#1701.2%(+0.873)#3,322
4.334360.75%1.3%(-0.564)#5171.2%(-0.431)#9,895
5.334260.59%1.3%(-0.724)#5991.2%(-0.591)#11,542
6.334350.51%1.3%(-0.803)#6321.2%(-0.670)#12,442

Common Questions

What are the Top 5 Zip Codes with the Highest Percentage of Population Employed in Legal Services & Support in Boynton Beach, FL?
Top 5 Zip Codes with the Highest Percentage of Population Employed in Legal Services & Support in Boynton Beach, FL are:
#1
3.3%
#2
3.1%
#3
2.1%
#4
0.75%
#5
0.59%
What zip code has the Highest Percentage of Population Employed in Legal Services & Support in Boynton Beach, FL?
33472 has the Highest Percentage of Population Employed in Legal Services & Support in Boynton Beach, FL with 3.3%.
What is the Percentage of Population Employed in Legal Services & Support in Boynton Beach, FL?
Percentage of Population Employed in Legal Services & Support in Boynton Beach is 0.66%.
What is the Percentage of Population Employed in Legal Services & Support in Florida?
Percentage of Population Employed in Legal Services & Support in Florida is 1.3%.
What is the Percentage of Population Employed in Legal Services & Support in the United States?
Percentage of Population Employed in Legal Services & Support in the United States is 1.2%.