Immigrants from Kazakhstan vs Immigrants from Hungary Disability Age Under 5
COMPARE
Immigrants from Kazakhstan
Immigrants from Hungary
Disability Age Under 5
Disability Age Under 5 Comparison
Immigrants from Kazakhstan
Immigrants from Hungary
1.1%
DISABILITY AGE UNDER 5
99.7/ 100
METRIC RATING
51st/ 347
METRIC RANK
1.4%
DISABILITY AGE UNDER 5
1.0/ 100
METRIC RATING
251st/ 347
METRIC RANK
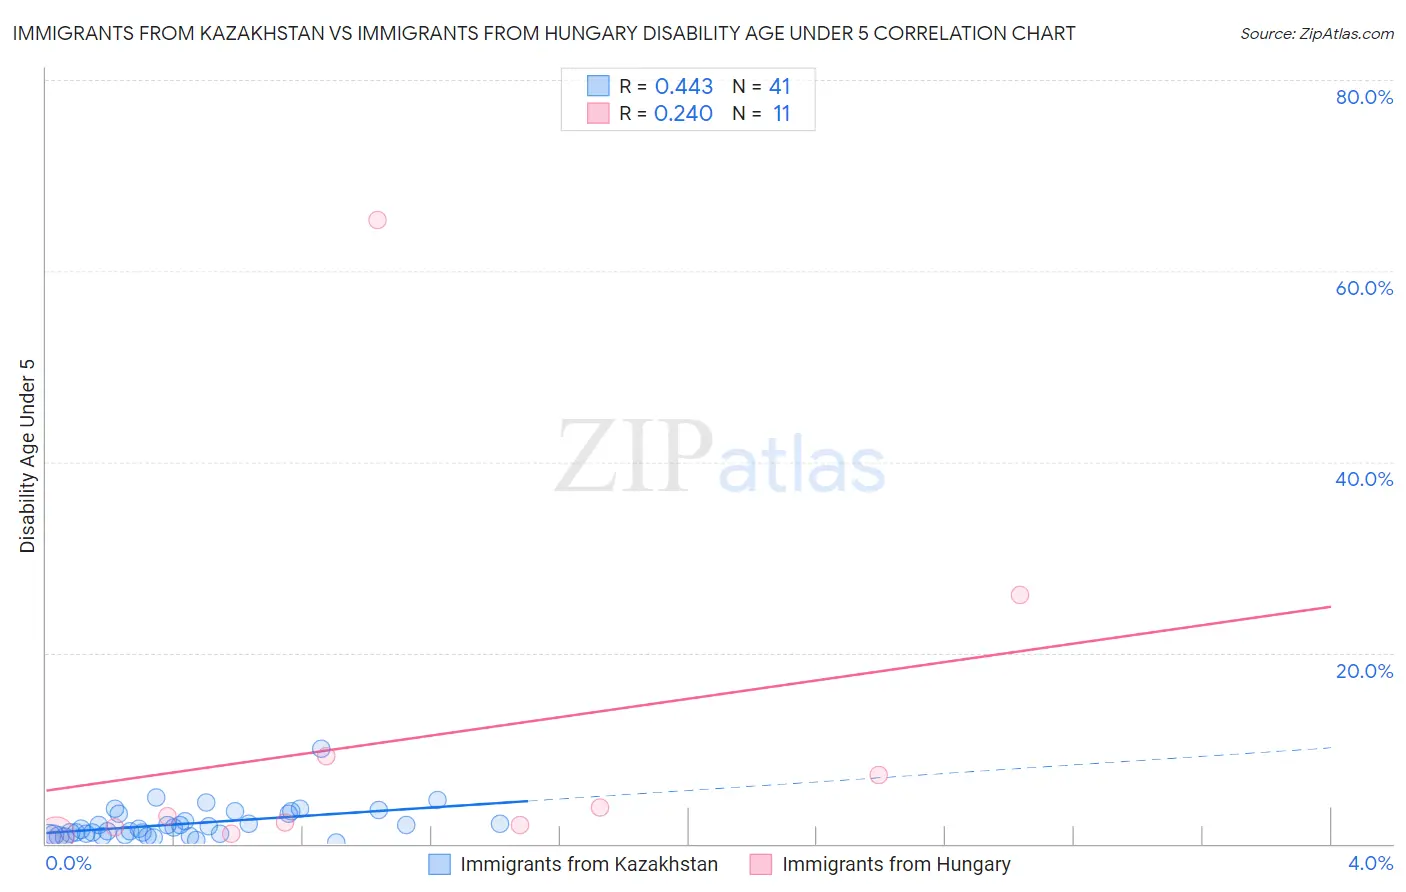
Immigrants from Kazakhstan vs Immigrants from Hungary Disability Age Under 5 Correlation Chart
The statistical analysis conducted on geographies consisting of 91,439,887 people shows a moderate positive correlation between the proportion of Immigrants from Kazakhstan and percentage of population with a disability under the age of 5 in the United States with a correlation coefficient (R) of 0.443 and weighted average of 1.1%. Similarly, the statistical analysis conducted on geographies consisting of 126,295,139 people shows a weak positive correlation between the proportion of Immigrants from Hungary and percentage of population with a disability under the age of 5 in the United States with a correlation coefficient (R) of 0.240 and weighted average of 1.4%, a difference of 27.2%.
Disability Age Under 5 Correlation Summary
| Measurement | Immigrants from Kazakhstan | Immigrants from Hungary |
| Minimum | 0.14% | 0.96% |
| Maximum | 10.0% | 65.4% |
| Range | 9.9% | 64.4% |
| Mean | 2.1% | 11.1% |
| Median | 1.6% | 2.9% |
| Interquartile 25% (IQ1) | 0.89% | 1.8% |
| Interquartile 75% (IQ3) | 3.1% | 9.2% |
| Interquartile Range (IQR) | 2.2% | 7.4% |
| Standard Deviation (Sample) | 1.8% | 19.4% |
| Standard Deviation (Population) | 1.7% | 18.5% |
Similar Demographics by Disability Age Under 5
Demographics Similar to Immigrants from Kazakhstan by Disability Age Under 5
In terms of disability age under 5, the demographic groups most similar to Immigrants from Kazakhstan are Immigrants from Japan (1.1%, a difference of 0.19%), Immigrants from Russia (1.1%, a difference of 0.20%), Immigrants from Singapore (1.1%, a difference of 0.41%), Immigrants from Bolivia (1.1%, a difference of 0.42%), and Immigrants from Sweden (1.1%, a difference of 0.63%).
| Demographics | Rating | Rank | Disability Age Under 5 |
| Immigrants | Asia | 99.8 /100 | #44 | Exceptional 1.1% |
| Immigrants | Turkey | 99.8 /100 | #45 | Exceptional 1.1% |
| Immigrants | Congo | 99.8 /100 | #46 | Exceptional 1.1% |
| Immigrants | Sweden | 99.8 /100 | #47 | Exceptional 1.1% |
| Immigrants | Singapore | 99.7 /100 | #48 | Exceptional 1.1% |
| Immigrants | Russia | 99.7 /100 | #49 | Exceptional 1.1% |
| Immigrants | Japan | 99.7 /100 | #50 | Exceptional 1.1% |
| Immigrants | Kazakhstan | 99.7 /100 | #51 | Exceptional 1.1% |
| Immigrants | Bolivia | 99.6 /100 | #52 | Exceptional 1.1% |
| Asians | 99.6 /100 | #53 | Exceptional 1.1% |
| Immigrants | El Salvador | 99.6 /100 | #54 | Exceptional 1.1% |
| Salvadorans | 99.5 /100 | #55 | Exceptional 1.1% |
| Ecuadorians | 99.5 /100 | #56 | Exceptional 1.1% |
| Assyrians/Chaldeans/Syriacs | 99.5 /100 | #57 | Exceptional 1.1% |
| Immigrants | Egypt | 99.4 /100 | #58 | Exceptional 1.1% |
Demographics Similar to Immigrants from Hungary by Disability Age Under 5
In terms of disability age under 5, the demographic groups most similar to Immigrants from Hungary are African (1.4%, a difference of 0.030%), Bermudan (1.4%, a difference of 0.040%), Immigrants from Scotland (1.4%, a difference of 0.040%), Eastern European (1.4%, a difference of 0.12%), and Immigrants from England (1.4%, a difference of 0.15%).
| Demographics | Rating | Rank | Disability Age Under 5 |
| Spaniards | 1.4 /100 | #244 | Tragic 1.4% |
| Potawatomi | 1.1 /100 | #245 | Tragic 1.4% |
| Russians | 1.0 /100 | #246 | Tragic 1.4% |
| Immigrants | England | 1.0 /100 | #247 | Tragic 1.4% |
| Eastern Europeans | 1.0 /100 | #248 | Tragic 1.4% |
| Bermudans | 1.0 /100 | #249 | Tragic 1.4% |
| Africans | 1.0 /100 | #250 | Tragic 1.4% |
| Immigrants | Hungary | 1.0 /100 | #251 | Tragic 1.4% |
| Immigrants | Scotland | 0.9 /100 | #252 | Tragic 1.4% |
| Australians | 0.7 /100 | #253 | Tragic 1.4% |
| Immigrants | Brazil | 0.7 /100 | #254 | Tragic 1.4% |
| Immigrants | Liberia | 0.6 /100 | #255 | Tragic 1.4% |
| Immigrants | Western Europe | 0.5 /100 | #256 | Tragic 1.4% |
| Slovenes | 0.3 /100 | #257 | Tragic 1.4% |
| Costa Ricans | 0.3 /100 | #258 | Tragic 1.4% |