Immigrants from Kazakhstan vs Dutch Disability Age Under 5
COMPARE
Immigrants from Kazakhstan
Dutch
Disability Age Under 5
Disability Age Under 5 Comparison
Immigrants from Kazakhstan
Dutch
1.1%
DISABILITY AGE UNDER 5
99.7/ 100
METRIC RATING
51st/ 347
METRIC RANK
1.7%
DISABILITY AGE UNDER 5
0.0/ 100
METRIC RATING
315th/ 347
METRIC RANK
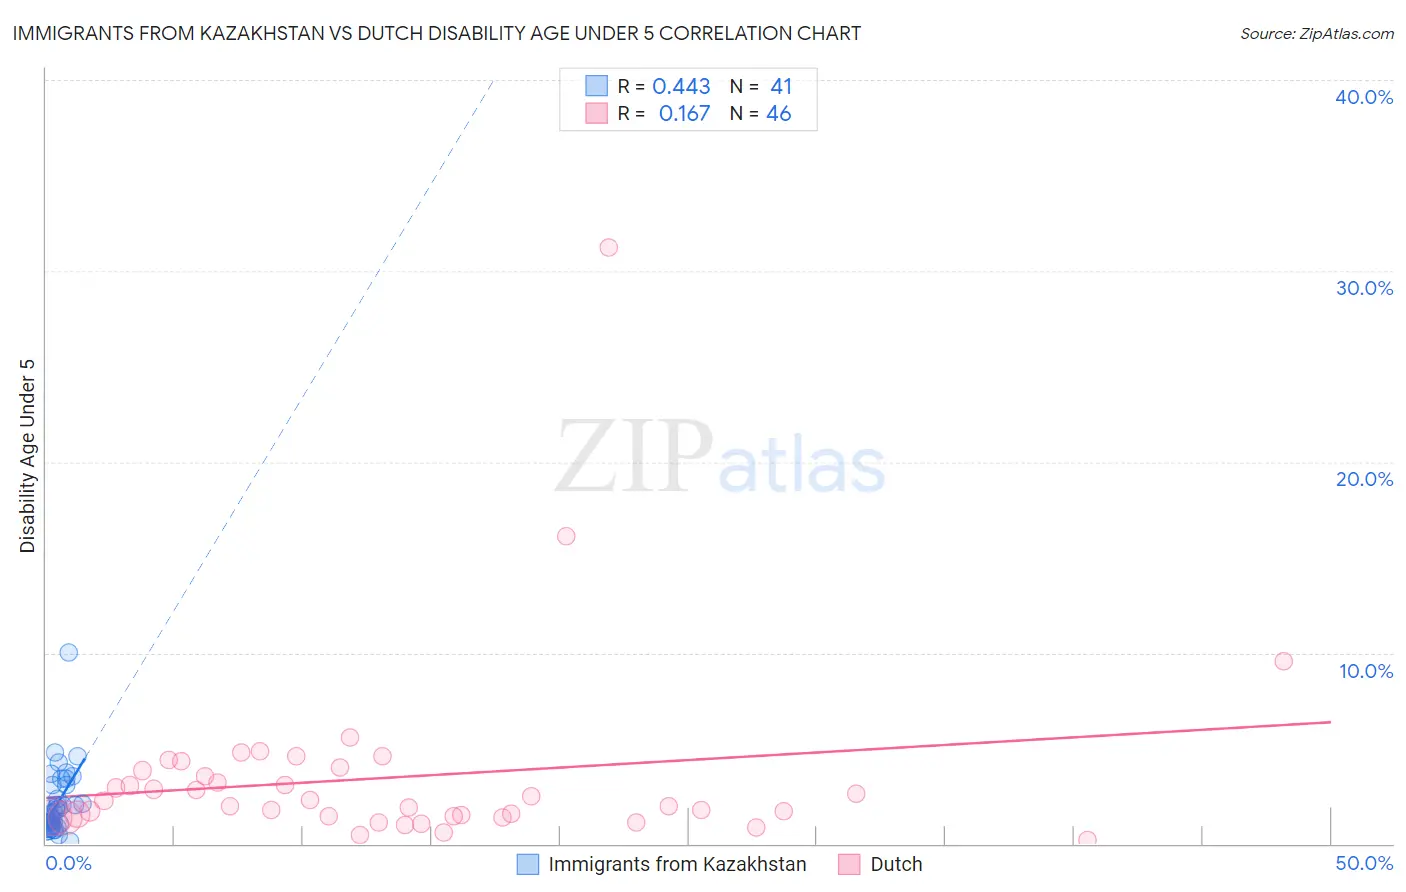
Immigrants from Kazakhstan vs Dutch Disability Age Under 5 Correlation Chart
The statistical analysis conducted on geographies consisting of 91,439,887 people shows a moderate positive correlation between the proportion of Immigrants from Kazakhstan and percentage of population with a disability under the age of 5 in the United States with a correlation coefficient (R) of 0.443 and weighted average of 1.1%. Similarly, the statistical analysis conducted on geographies consisting of 256,007,977 people shows a poor positive correlation between the proportion of Dutch and percentage of population with a disability under the age of 5 in the United States with a correlation coefficient (R) of 0.167 and weighted average of 1.7%, a difference of 56.0%.
Disability Age Under 5 Correlation Summary
| Measurement | Immigrants from Kazakhstan | Dutch |
| Minimum | 0.14% | 0.18% |
| Maximum | 10.0% | 31.2% |
| Range | 9.9% | 31.1% |
| Mean | 2.1% | 3.5% |
| Median | 1.6% | 2.1% |
| Interquartile 25% (IQ1) | 0.89% | 1.5% |
| Interquartile 75% (IQ3) | 3.1% | 3.8% |
| Interquartile Range (IQR) | 2.2% | 2.4% |
| Standard Deviation (Sample) | 1.8% | 4.9% |
| Standard Deviation (Population) | 1.7% | 4.9% |
Similar Demographics by Disability Age Under 5
Demographics Similar to Immigrants from Kazakhstan by Disability Age Under 5
In terms of disability age under 5, the demographic groups most similar to Immigrants from Kazakhstan are Immigrants from Japan (1.1%, a difference of 0.19%), Immigrants from Russia (1.1%, a difference of 0.20%), Immigrants from Singapore (1.1%, a difference of 0.41%), Immigrants from Bolivia (1.1%, a difference of 0.42%), and Immigrants from Sweden (1.1%, a difference of 0.63%).
| Demographics | Rating | Rank | Disability Age Under 5 |
| Immigrants | Asia | 99.8 /100 | #44 | Exceptional 1.1% |
| Immigrants | Turkey | 99.8 /100 | #45 | Exceptional 1.1% |
| Immigrants | Congo | 99.8 /100 | #46 | Exceptional 1.1% |
| Immigrants | Sweden | 99.8 /100 | #47 | Exceptional 1.1% |
| Immigrants | Singapore | 99.7 /100 | #48 | Exceptional 1.1% |
| Immigrants | Russia | 99.7 /100 | #49 | Exceptional 1.1% |
| Immigrants | Japan | 99.7 /100 | #50 | Exceptional 1.1% |
| Immigrants | Kazakhstan | 99.7 /100 | #51 | Exceptional 1.1% |
| Immigrants | Bolivia | 99.6 /100 | #52 | Exceptional 1.1% |
| Asians | 99.6 /100 | #53 | Exceptional 1.1% |
| Immigrants | El Salvador | 99.6 /100 | #54 | Exceptional 1.1% |
| Salvadorans | 99.5 /100 | #55 | Exceptional 1.1% |
| Ecuadorians | 99.5 /100 | #56 | Exceptional 1.1% |
| Assyrians/Chaldeans/Syriacs | 99.5 /100 | #57 | Exceptional 1.1% |
| Immigrants | Egypt | 99.4 /100 | #58 | Exceptional 1.1% |
Demographics Similar to Dutch by Disability Age Under 5
In terms of disability age under 5, the demographic groups most similar to Dutch are Immigrants from Cabo Verde (1.7%, a difference of 0.18%), Norwegian (1.7%, a difference of 0.26%), Celtic (1.7%, a difference of 0.42%), Puerto Rican (1.7%, a difference of 0.58%), and French (1.7%, a difference of 0.61%).
| Demographics | Rating | Rank | Disability Age Under 5 |
| Navajo | 0.0 /100 | #308 | Tragic 1.6% |
| Cape Verdeans | 0.0 /100 | #309 | Tragic 1.7% |
| Whites/Caucasians | 0.0 /100 | #310 | Tragic 1.7% |
| English | 0.0 /100 | #311 | Tragic 1.7% |
| Puerto Ricans | 0.0 /100 | #312 | Tragic 1.7% |
| Celtics | 0.0 /100 | #313 | Tragic 1.7% |
| Norwegians | 0.0 /100 | #314 | Tragic 1.7% |
| Dutch | 0.0 /100 | #315 | Tragic 1.7% |
| Immigrants | Cabo Verde | 0.0 /100 | #316 | Tragic 1.7% |
| French | 0.0 /100 | #317 | Tragic 1.7% |
| Irish | 0.0 /100 | #318 | Tragic 1.7% |
| Slovaks | 0.0 /100 | #319 | Tragic 1.7% |
| Scotch-Irish | 0.0 /100 | #320 | Tragic 1.7% |
| Ottawa | 0.0 /100 | #321 | Tragic 1.7% |
| Germans | 0.0 /100 | #322 | Tragic 1.7% |