Immigrants from Europe vs Cajun Disability Age Under 5
COMPARE
Immigrants from Europe
Cajun
Disability Age Under 5
Disability Age Under 5 Comparison
Immigrants from Europe
Cajuns
1.3%
DISABILITY AGE UNDER 5
23.6/ 100
METRIC RATING
204th/ 347
METRIC RANK
1.6%
DISABILITY AGE UNDER 5
0.0/ 100
METRIC RATING
298th/ 347
METRIC RANK
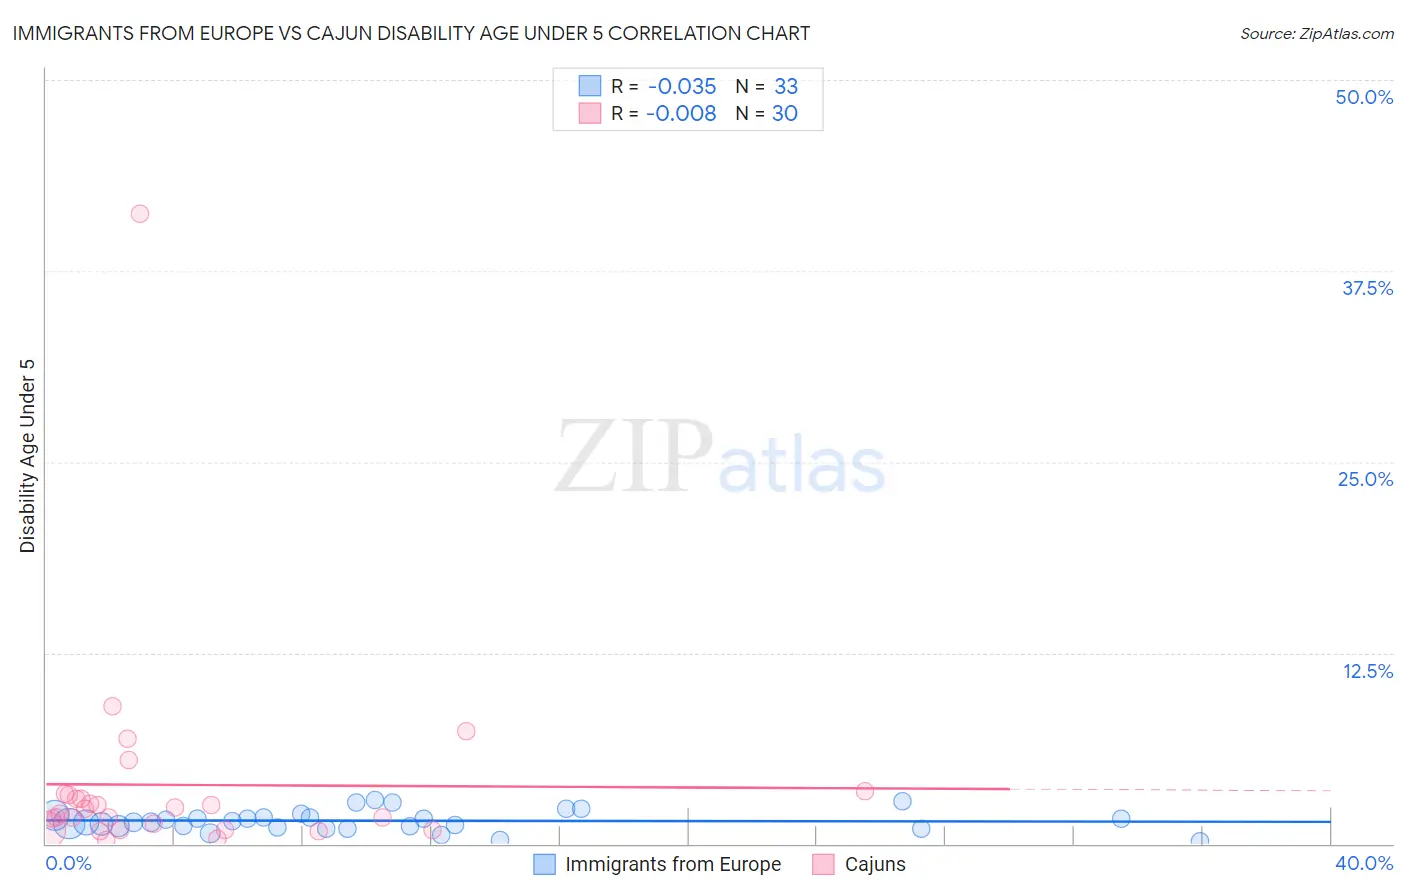
Immigrants from Europe vs Cajun Disability Age Under 5 Correlation Chart
The statistical analysis conducted on geographies consisting of 257,665,237 people shows no correlation between the proportion of Immigrants from Europe and percentage of population with a disability under the age of 5 in the United States with a correlation coefficient (R) of -0.035 and weighted average of 1.3%. Similarly, the statistical analysis conducted on geographies consisting of 103,694,895 people shows no correlation between the proportion of Cajuns and percentage of population with a disability under the age of 5 in the United States with a correlation coefficient (R) of -0.008 and weighted average of 1.6%, a difference of 26.2%.
Disability Age Under 5 Correlation Summary
| Measurement | Immigrants from Europe | Cajun |
| Minimum | 0.14% | 0.26% |
| Maximum | 2.9% | 41.3% |
| Range | 2.7% | 41.0% |
| Mean | 1.5% | 3.9% |
| Median | 1.4% | 2.1% |
| Interquartile 25% (IQ1) | 1.1% | 0.93% |
| Interquartile 75% (IQ3) | 1.8% | 3.2% |
| Interquartile Range (IQR) | 0.70% | 2.3% |
| Standard Deviation (Sample) | 0.67% | 7.4% |
| Standard Deviation (Population) | 0.66% | 7.2% |
Similar Demographics by Disability Age Under 5
Demographics Similar to Immigrants from Europe by Disability Age Under 5
In terms of disability age under 5, the demographic groups most similar to Immigrants from Europe are Liberian (1.3%, a difference of 0.050%), Arapaho (1.3%, a difference of 0.060%), Romanian (1.3%, a difference of 0.14%), Immigrants from Poland (1.3%, a difference of 0.16%), and Immigrants from Italy (1.3%, a difference of 0.21%).
| Demographics | Rating | Rank | Disability Age Under 5 |
| Immigrants | Somalia | 31.3 /100 | #197 | Fair 1.3% |
| Immigrants | Norway | 31.1 /100 | #198 | Fair 1.3% |
| Jamaicans | 30.7 /100 | #199 | Fair 1.3% |
| Immigrants | Lithuania | 27.2 /100 | #200 | Fair 1.3% |
| Immigrants | Italy | 25.4 /100 | #201 | Fair 1.3% |
| Arapaho | 24.1 /100 | #202 | Fair 1.3% |
| Liberians | 24.0 /100 | #203 | Fair 1.3% |
| Immigrants | Europe | 23.6 /100 | #204 | Fair 1.3% |
| Romanians | 22.5 /100 | #205 | Fair 1.3% |
| Immigrants | Poland | 22.4 /100 | #206 | Fair 1.3% |
| Nigerians | 21.2 /100 | #207 | Fair 1.3% |
| Mexicans | 20.8 /100 | #208 | Fair 1.3% |
| Bulgarians | 19.5 /100 | #209 | Poor 1.3% |
| Pakistanis | 19.4 /100 | #210 | Poor 1.3% |
| Immigrants | Greece | 19.1 /100 | #211 | Poor 1.3% |
Demographics Similar to Cajuns by Disability Age Under 5
In terms of disability age under 5, the demographic groups most similar to Cajuns are Nonimmigrants (1.6%, a difference of 0.010%), Portuguese (1.6%, a difference of 0.57%), Shoshone (1.6%, a difference of 0.91%), Polish (1.6%, a difference of 0.96%), and Finnish (1.6%, a difference of 1.0%).
| Demographics | Rating | Rank | Disability Age Under 5 |
| Northern Europeans | 0.0 /100 | #291 | Tragic 1.6% |
| Italians | 0.0 /100 | #292 | Tragic 1.6% |
| Lithuanians | 0.0 /100 | #293 | Tragic 1.6% |
| Swedes | 0.0 /100 | #294 | Tragic 1.6% |
| Finns | 0.0 /100 | #295 | Tragic 1.6% |
| Poles | 0.0 /100 | #296 | Tragic 1.6% |
| Immigrants | Nonimmigrants | 0.0 /100 | #297 | Tragic 1.6% |
| Cajuns | 0.0 /100 | #298 | Tragic 1.6% |
| Portuguese | 0.0 /100 | #299 | Tragic 1.6% |
| Shoshone | 0.0 /100 | #300 | Tragic 1.6% |
| German Russians | 0.0 /100 | #301 | Tragic 1.6% |
| Welsh | 0.0 /100 | #302 | Tragic 1.6% |
| Swiss | 0.0 /100 | #303 | Tragic 1.6% |
| Seminole | 0.0 /100 | #304 | Tragic 1.6% |
| Blackfeet | 0.0 /100 | #305 | Tragic 1.6% |