Immigrants from Europe vs Guatemalan Disability Age Under 5
COMPARE
Immigrants from Europe
Guatemalan
Disability Age Under 5
Disability Age Under 5 Comparison
Immigrants from Europe
Guatemalans
1.3%
DISABILITY AGE UNDER 5
23.6/ 100
METRIC RATING
204th/ 347
METRIC RANK
1.2%
DISABILITY AGE UNDER 5
63.6/ 100
METRIC RATING
162nd/ 347
METRIC RANK
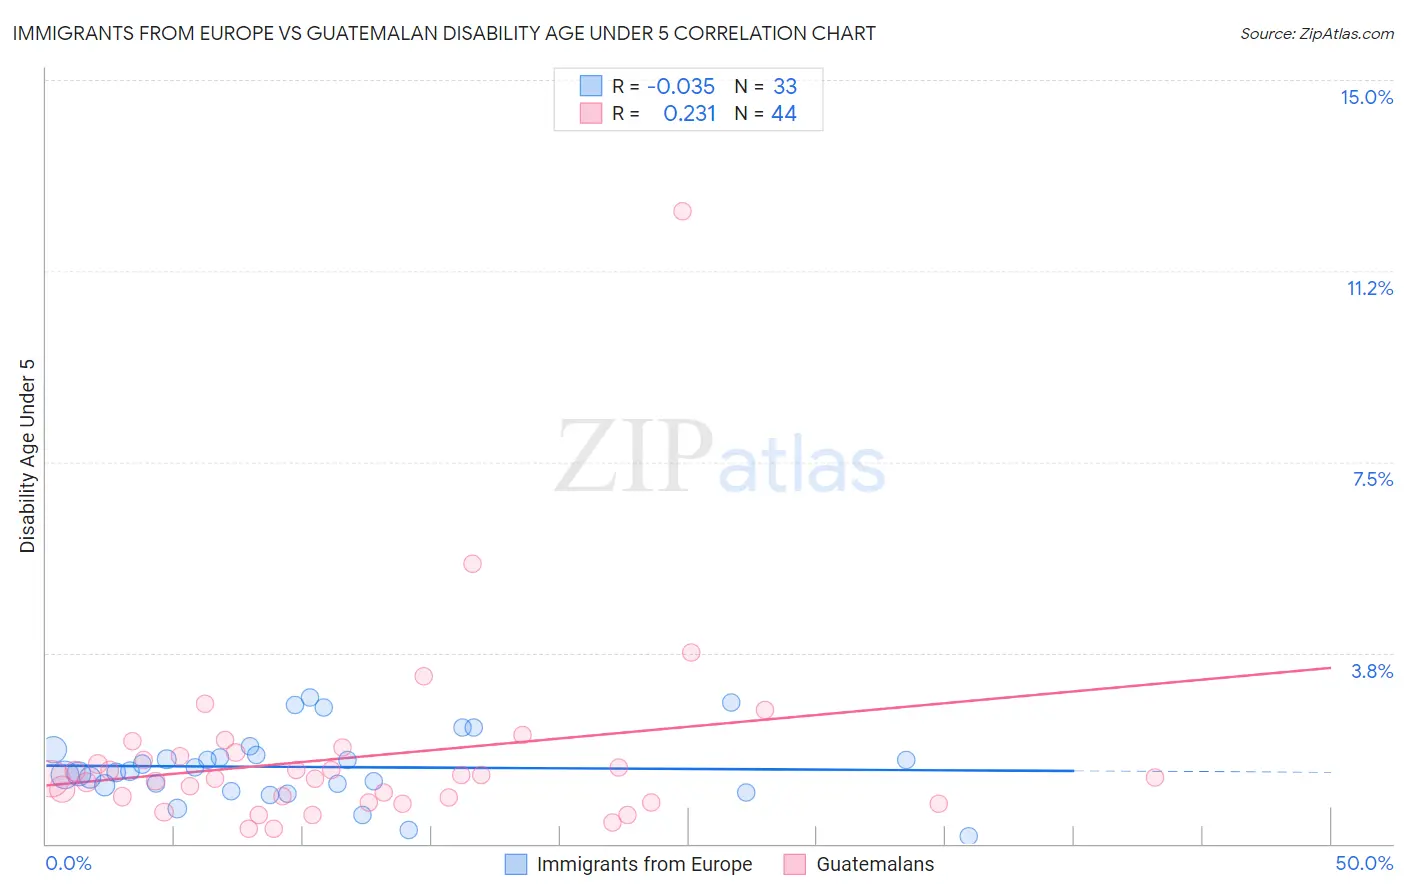
Immigrants from Europe vs Guatemalan Disability Age Under 5 Correlation Chart
The statistical analysis conducted on geographies consisting of 257,665,237 people shows no correlation between the proportion of Immigrants from Europe and percentage of population with a disability under the age of 5 in the United States with a correlation coefficient (R) of -0.035 and weighted average of 1.3%. Similarly, the statistical analysis conducted on geographies consisting of 225,218,414 people shows a weak positive correlation between the proportion of Guatemalans and percentage of population with a disability under the age of 5 in the United States with a correlation coefficient (R) of 0.231 and weighted average of 1.2%, a difference of 4.0%.
Disability Age Under 5 Correlation Summary
| Measurement | Immigrants from Europe | Guatemalan |
| Minimum | 0.14% | 0.29% |
| Maximum | 2.9% | 12.4% |
| Range | 2.7% | 12.1% |
| Mean | 1.5% | 1.7% |
| Median | 1.4% | 1.3% |
| Interquartile 25% (IQ1) | 1.1% | 0.86% |
| Interquartile 75% (IQ3) | 1.8% | 1.8% |
| Interquartile Range (IQR) | 0.70% | 0.90% |
| Standard Deviation (Sample) | 0.67% | 1.9% |
| Standard Deviation (Population) | 0.66% | 1.9% |
Similar Demographics by Disability Age Under 5
Demographics Similar to Immigrants from Europe by Disability Age Under 5
In terms of disability age under 5, the demographic groups most similar to Immigrants from Europe are Liberian (1.3%, a difference of 0.050%), Arapaho (1.3%, a difference of 0.060%), Romanian (1.3%, a difference of 0.14%), Immigrants from Poland (1.3%, a difference of 0.16%), and Immigrants from Italy (1.3%, a difference of 0.21%).
| Demographics | Rating | Rank | Disability Age Under 5 |
| Immigrants | Somalia | 31.3 /100 | #197 | Fair 1.3% |
| Immigrants | Norway | 31.1 /100 | #198 | Fair 1.3% |
| Jamaicans | 30.7 /100 | #199 | Fair 1.3% |
| Immigrants | Lithuania | 27.2 /100 | #200 | Fair 1.3% |
| Immigrants | Italy | 25.4 /100 | #201 | Fair 1.3% |
| Arapaho | 24.1 /100 | #202 | Fair 1.3% |
| Liberians | 24.0 /100 | #203 | Fair 1.3% |
| Immigrants | Europe | 23.6 /100 | #204 | Fair 1.3% |
| Romanians | 22.5 /100 | #205 | Fair 1.3% |
| Immigrants | Poland | 22.4 /100 | #206 | Fair 1.3% |
| Nigerians | 21.2 /100 | #207 | Fair 1.3% |
| Mexicans | 20.8 /100 | #208 | Fair 1.3% |
| Bulgarians | 19.5 /100 | #209 | Poor 1.3% |
| Pakistanis | 19.4 /100 | #210 | Poor 1.3% |
| Immigrants | Greece | 19.1 /100 | #211 | Poor 1.3% |
Demographics Similar to Guatemalans by Disability Age Under 5
In terms of disability age under 5, the demographic groups most similar to Guatemalans are Immigrants from Guatemala (1.2%, a difference of 0.030%), Laotian (1.2%, a difference of 0.080%), Immigrants from Kuwait (1.2%, a difference of 0.10%), Immigrants from Africa (1.2%, a difference of 0.15%), and Immigrants from Central America (1.2%, a difference of 0.21%).
| Demographics | Rating | Rank | Disability Age Under 5 |
| Immigrants | Ghana | 68.7 /100 | #155 | Good 1.2% |
| Hawaiians | 68.5 /100 | #156 | Good 1.2% |
| Immigrants | South America | 67.0 /100 | #157 | Good 1.2% |
| Arabs | 66.4 /100 | #158 | Good 1.2% |
| Colombians | 65.8 /100 | #159 | Good 1.2% |
| Immigrants | Latin America | 65.8 /100 | #160 | Good 1.2% |
| Immigrants | Africa | 65.1 /100 | #161 | Good 1.2% |
| Guatemalans | 63.6 /100 | #162 | Good 1.2% |
| Immigrants | Guatemala | 63.2 /100 | #163 | Good 1.2% |
| Laotians | 62.8 /100 | #164 | Good 1.2% |
| Immigrants | Kuwait | 62.6 /100 | #165 | Good 1.2% |
| Immigrants | Central America | 61.4 /100 | #166 | Good 1.2% |
| Immigrants | Argentina | 60.2 /100 | #167 | Good 1.2% |
| Sierra Leoneans | 59.1 /100 | #168 | Average 1.2% |
| Immigrants | Uruguay | 59.0 /100 | #169 | Average 1.2% |