Zip Codes with the Highest Percentage of Population Employed in Agriculture, Fishing & Hunting in Castle Rock, CO
RELATED REPORTS & OPTIONS
Agriculture, Fishing & Hunting
Castle Rock
Compare Zip Codes
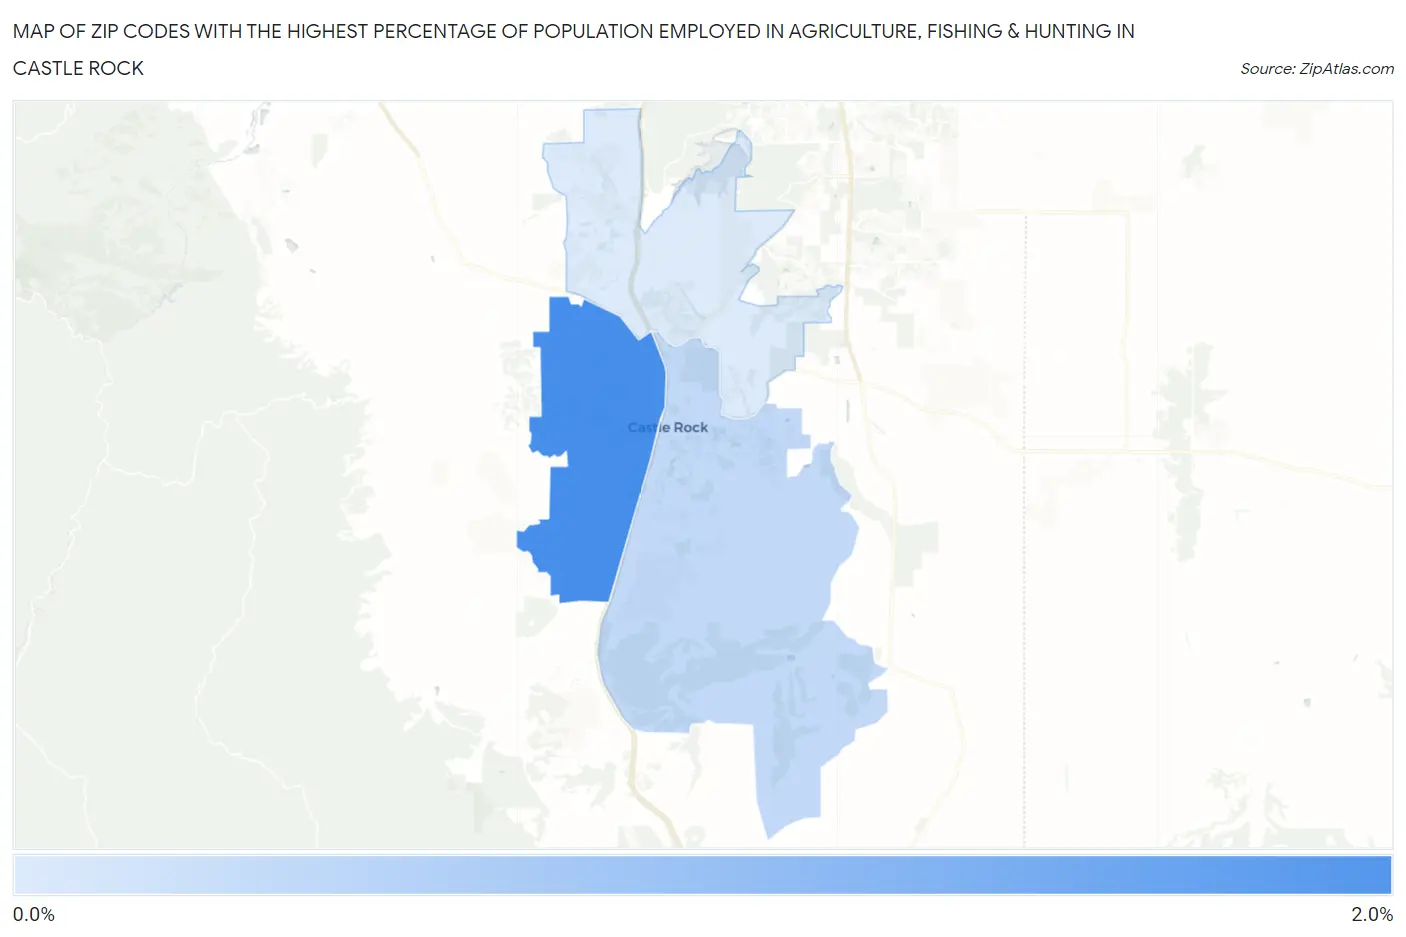
Map of Zip Codes with the Highest Percentage of Population Employed in Agriculture, Fishing & Hunting in Castle Rock
0.58%
1.7%
Zip Codes with the Highest Percentage of Population Employed in Agriculture, Fishing & Hunting in Castle Rock, CO
| Zip Code | % Employed | vs State | vs National | |
| 1. | 80109 | 1.7% | 1.1%(+0.577)#238 | 1.2%(+0.525)#13,570 |
| 2. | 80104 | 0.79% | 1.1%(-0.361)#298 | 1.2%(-0.412)#17,324 |
| 3. | 80108 | 0.58% | 1.1%(-0.571)#321 | 1.2%(-0.622)#18,647 |
1
Common Questions
What are the Top Zip Codes with the Highest Percentage of Population Employed in Agriculture, Fishing & Hunting in Castle Rock, CO?
Top Zip Codes with the Highest Percentage of Population Employed in Agriculture, Fishing & Hunting in Castle Rock, CO are:
What zip code has the Highest Percentage of Population Employed in Agriculture, Fishing & Hunting in Castle Rock, CO?
80109 has the Highest Percentage of Population Employed in Agriculture, Fishing & Hunting in Castle Rock, CO with 1.7%.
What is the Percentage of Population Employed in Agriculture, Fishing & Hunting in Castle Rock, CO?
Percentage of Population Employed in Agriculture, Fishing & Hunting in Castle Rock is 1.1%.
What is the Percentage of Population Employed in Agriculture, Fishing & Hunting in Colorado?
Percentage of Population Employed in Agriculture, Fishing & Hunting in Colorado is 1.1%.
What is the Percentage of Population Employed in Agriculture, Fishing & Hunting in the United States?
Percentage of Population Employed in Agriculture, Fishing & Hunting in the United States is 1.2%.