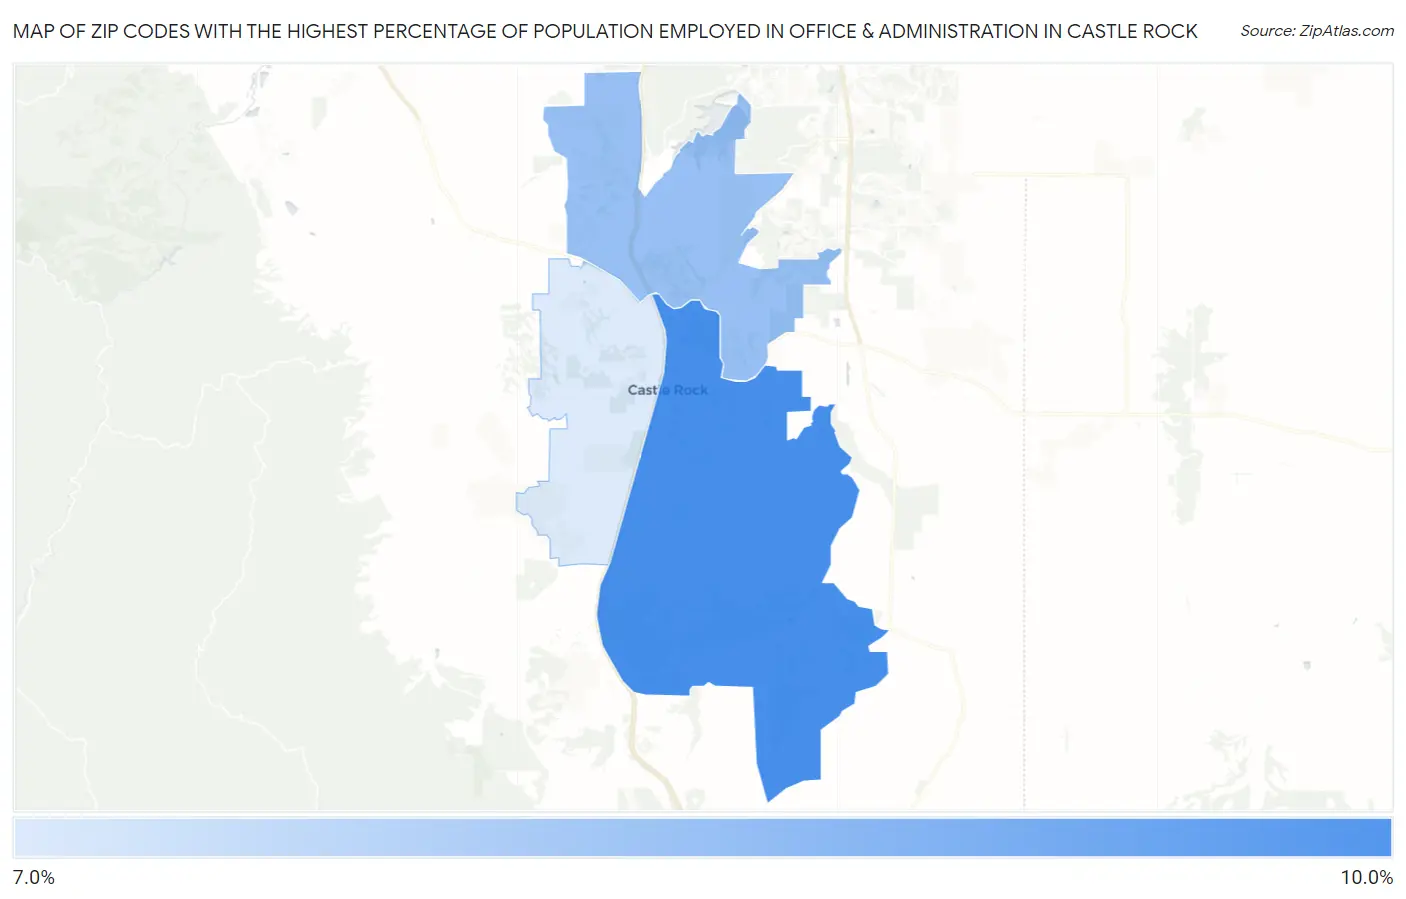
Zip Codes with the Highest Percentage of Population Employed in Office & Administration in Castle Rock, CO
RELATED REPORTS & OPTIONS
Office & Administration
Castle Rock
Compare Zip Codes
Map of Zip Codes with the Highest Percentage of Population Employed in Office & Administration in Castle Rock
7.5%
9.0%
Zip Codes with the Highest Percentage of Population Employed in Office & Administration in Castle Rock, CO
| Zip Code | % Employed | vs State | vs National | |
| 1. | 80104 | 9.0% | 10.1%(-1.12)#270 | 10.9%(-1.85)#20,231 |
| 2. | 80108 | 8.2% | 10.1%(-1.93)#310 | 10.9%(-2.65)#22,519 |
| 3. | 80109 | 7.5% | 10.1%(-2.62)#343 | 10.9%(-3.35)#24,120 |
1
Common Questions
What are the Top Zip Codes with the Highest Percentage of Population Employed in Office & Administration in Castle Rock, CO?
Top Zip Codes with the Highest Percentage of Population Employed in Office & Administration in Castle Rock, CO are:
What zip code has the Highest Percentage of Population Employed in Office & Administration in Castle Rock, CO?
80104 has the Highest Percentage of Population Employed in Office & Administration in Castle Rock, CO with 9.0%.
What is the Percentage of Population Employed in Office & Administration in Castle Rock, CO?
Percentage of Population Employed in Office & Administration in Castle Rock is 8.7%.
What is the Percentage of Population Employed in Office & Administration in Colorado?
Percentage of Population Employed in Office & Administration in Colorado is 10.1%.
What is the Percentage of Population Employed in Office & Administration in the United States?
Percentage of Population Employed in Office & Administration in the United States is 10.9%.