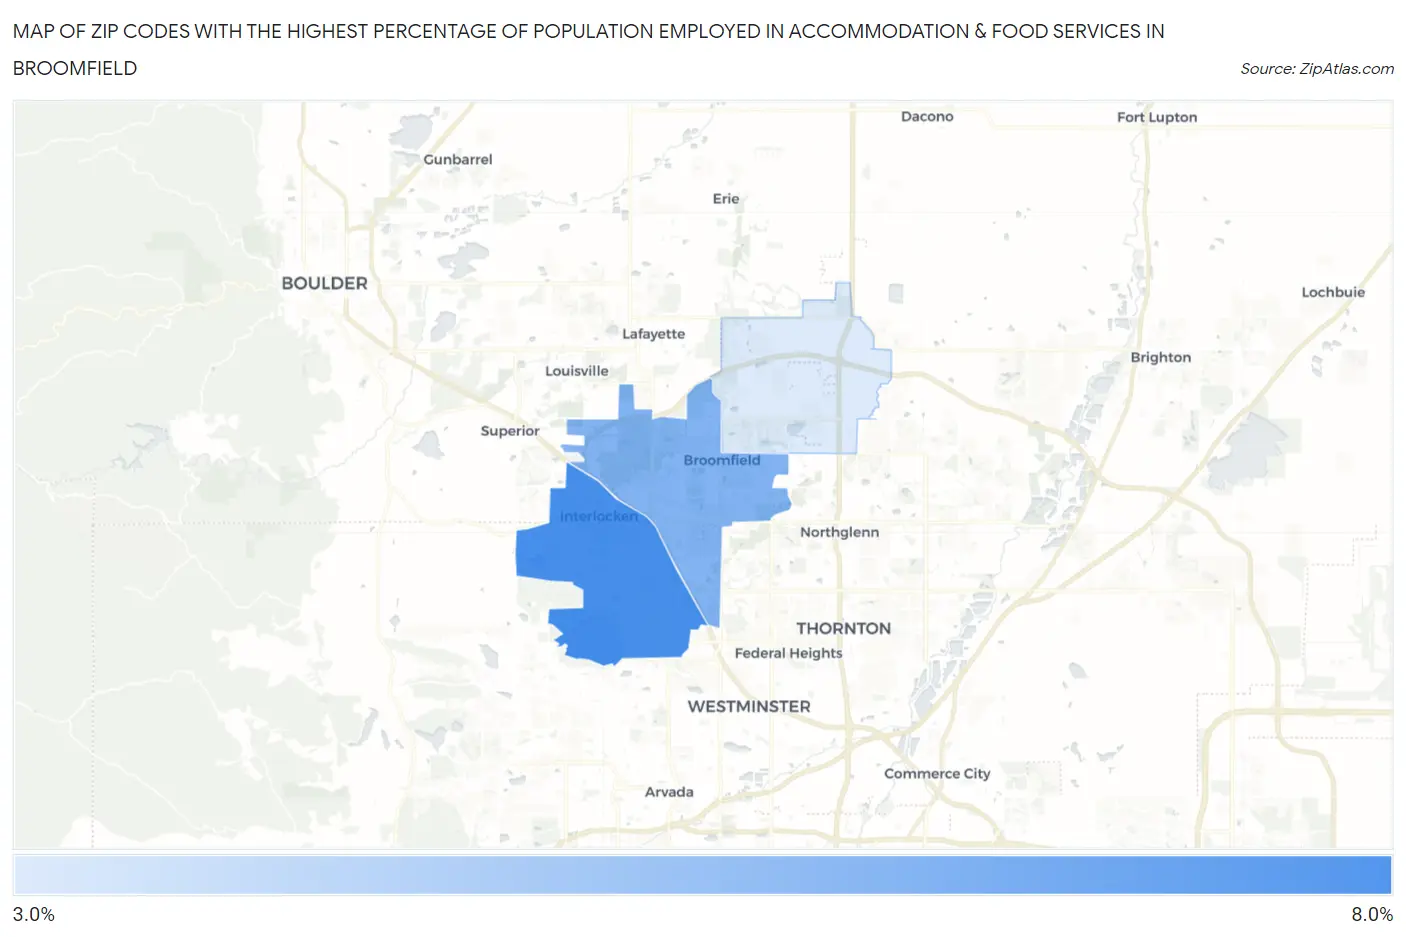
Zip Codes with the Highest Percentage of Population Employed in Accommodation & Food Services in Broomfield, CO
RELATED REPORTS & OPTIONS
Accommodation & Food Services
Broomfield
Compare Zip Codes
Map of Zip Codes with the Highest Percentage of Population Employed in Accommodation & Food Services in Broomfield
3.9%
7.3%
Zip Codes with the Highest Percentage of Population Employed in Accommodation & Food Services in Broomfield, CO
| Zip Code | % Employed | vs State | vs National | |
| 1. | 80021 | 7.3% | 6.9%(+0.403)#162 | 6.9%(+0.424)#9,499 |
| 2. | 80020 | 6.0% | 6.9%(-0.894)#222 | 6.9%(-0.874)#13,425 |
| 3. | 80023 | 3.9% | 6.9%(-2.97)#328 | 6.9%(-2.95)#20,372 |
1
Common Questions
What are the Top Zip Codes with the Highest Percentage of Population Employed in Accommodation & Food Services in Broomfield, CO?
Top Zip Codes with the Highest Percentage of Population Employed in Accommodation & Food Services in Broomfield, CO are:
What zip code has the Highest Percentage of Population Employed in Accommodation & Food Services in Broomfield, CO?
80021 has the Highest Percentage of Population Employed in Accommodation & Food Services in Broomfield, CO with 7.3%.
What is the Percentage of Population Employed in Accommodation & Food Services in Broomfield, CO?
Percentage of Population Employed in Accommodation & Food Services in Broomfield is 6.0%.
What is the Percentage of Population Employed in Accommodation & Food Services in Colorado?
Percentage of Population Employed in Accommodation & Food Services in Colorado is 6.9%.
What is the Percentage of Population Employed in Accommodation & Food Services in the United States?
Percentage of Population Employed in Accommodation & Food Services in the United States is 6.9%.