Zip Codes with the Highest Percentage of Not-for-profit Organizations in Arizona
RELATED REPORTS & OPTIONS
Not-for-profit Organizations
Arizona
Compare Zip Codes
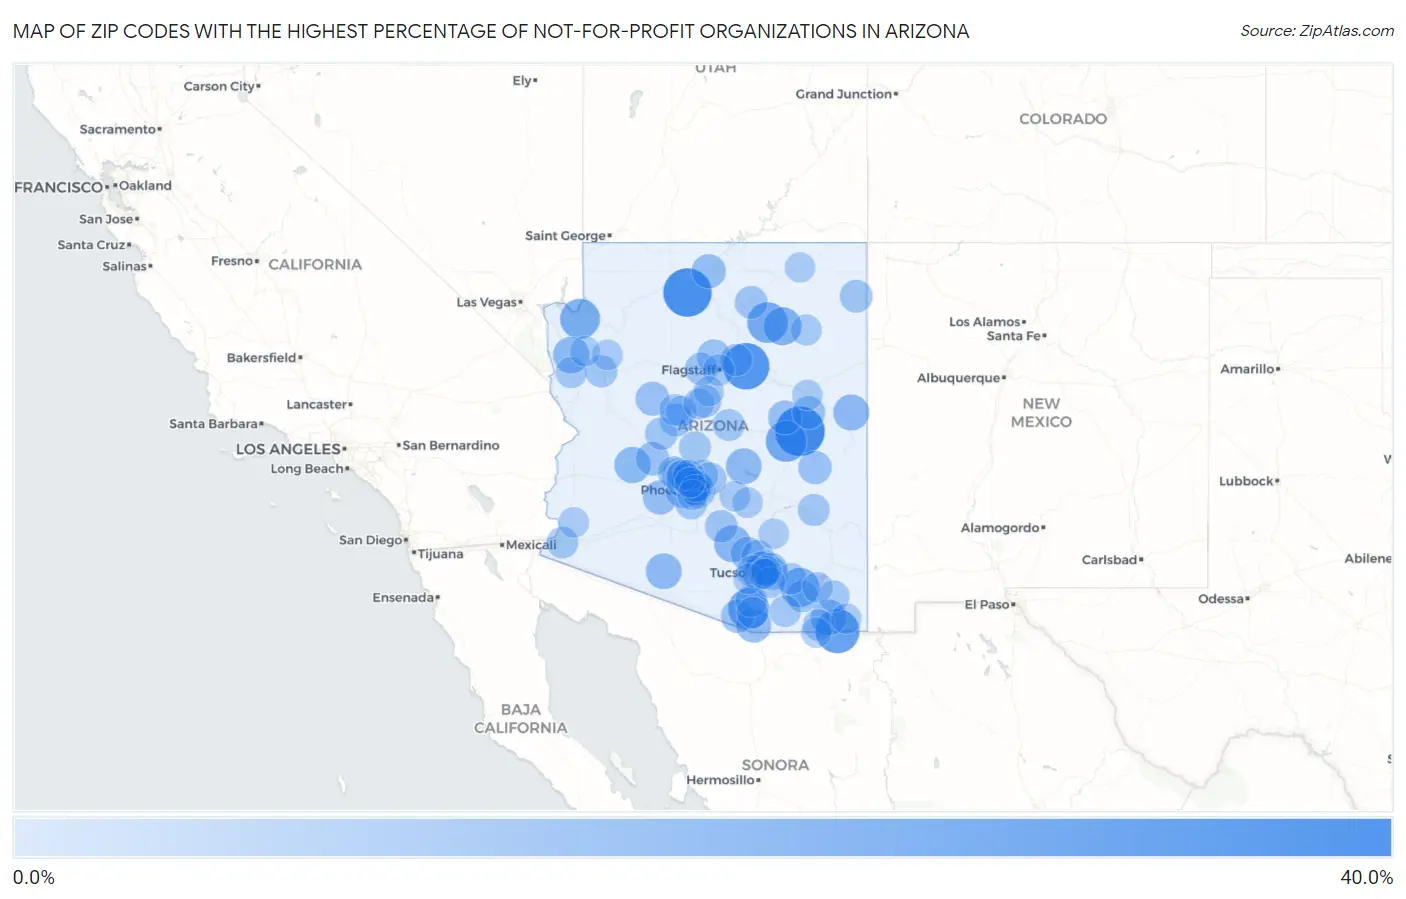
Map of Zip Codes with the Highest Percentage of Not-for-profit Organizations in Arizona
0.0%
40.0%
Zip Codes with the Highest Percentage of Not-for-profit Organizations in Arizona
| Zip Code | % Employed in Not-for-profit | vs State | vs National | |
| 1. | 85934 | 33.8% | 7.0%(+26.8)#1 | 8.4%(+25.3)#348 |
| 2. | 86052 | 32.3% | 7.0%(+25.3)#2 | 8.4%(+23.9)#373 |
| 3. | 86003 | 29.4% | 7.0%(+22.4)#3 | 8.4%(+21.0)#468 |
| 4. | 85626 | 26.1% | 7.0%(+19.1)#4 | 8.4%(+17.7)#625 |
| 5. | 85645 | 22.3% | 7.0%(+15.3)#5 | 8.4%(+13.9)#975 |
| 6. | 85911 | 22.2% | 7.0%(+15.2)#6 | 8.4%(+13.7)#990 |
| 7. | 86030 | 21.8% | 7.0%(+14.8)#7 | 8.4%(+13.3)#1,039 |
| 8. | 86444 | 20.7% | 7.0%(+13.7)#8 | 8.4%(+12.2)#1,193 |
| 9. | 85627 | 19.8% | 7.0%(+12.8)#9 | 8.4%(+11.4)#1,321 |
| 10. | 86043 | 18.4% | 7.0%(+11.4)#10 | 8.4%(+9.92)#1,614 |
| 11. | 85141 | 16.7% | 7.0%(+9.66)#11 | 8.4%(+8.22)#2,153 |
| 12. | 86431 | 16.1% | 7.0%(+9.12)#12 | 8.4%(+7.68)#2,396 |
| 13. | 85320 | 15.8% | 7.0%(+8.78)#13 | 8.4%(+7.35)#2,537 |
| 14. | 85936 | 15.5% | 7.0%(+8.50)#14 | 8.4%(+7.06)#2,677 |
| 15. | 85617 | 15.4% | 7.0%(+8.35)#15 | 8.4%(+6.91)#2,749 |
| 16. | 85321 | 15.2% | 7.0%(+8.24)#16 | 8.4%(+6.80)#2,804 |
| 17. | 85553 | 15.2% | 7.0%(+8.24)#17 | 8.4%(+6.80)#2,806 |
| 18. | 85621 | 14.4% | 7.0%(+7.43)#18 | 8.4%(+6.00)#3,281 |
| 19. | 85351 | 13.8% | 7.0%(+6.82)#19 | 8.4%(+5.38)#3,735 |
| 20. | 86036 | 13.2% | 7.0%(+6.21)#20 | 8.4%(+4.78)#4,290 |
| 21. | 85343 | 13.2% | 7.0%(+6.15)#21 | 8.4%(+4.71)#4,366 |
| 22. | 85928 | 13.0% | 7.0%(+5.98)#22 | 8.4%(+4.54)#4,520 |
| 23. | 85658 | 12.8% | 7.0%(+5.79)#23 | 8.4%(+4.35)#4,717 |
| 24. | 86305 | 12.8% | 7.0%(+5.79)#24 | 8.4%(+4.35)#4,720 |
| 25. | 85329 | 12.7% | 7.0%(+5.68)#25 | 8.4%(+4.24)#4,851 |
| 26. | 85375 | 12.5% | 7.0%(+5.46)#26 | 8.4%(+4.02)#5,078 |
| 27. | 86001 | 12.4% | 7.0%(+5.39)#27 | 8.4%(+3.95)#5,156 |
| 28. | 85390 | 12.4% | 7.0%(+5.35)#28 | 8.4%(+3.92)#5,190 |
| 29. | 85926 | 12.1% | 7.0%(+5.14)#29 | 8.4%(+3.71)#5,438 |
| 30. | 85601 | 12.0% | 7.0%(+4.99)#30 | 8.4%(+3.56)#5,636 |
| 31. | 85034 | 11.9% | 7.0%(+4.87)#31 | 8.4%(+3.43)#5,795 |
| 32. | 85937 | 11.7% | 7.0%(+4.66)#32 | 8.4%(+3.23)#6,090 |
| 33. | 86303 | 11.6% | 7.0%(+4.57)#33 | 8.4%(+3.13)#6,217 |
| 34. | 85750 | 11.6% | 7.0%(+4.56)#34 | 8.4%(+3.12)#6,226 |
| 35. | 85716 | 11.5% | 7.0%(+4.52)#35 | 8.4%(+3.08)#6,283 |
| 36. | 86556 | 11.5% | 7.0%(+4.50)#36 | 8.4%(+3.07)#6,306 |
| 37. | 86045 | 11.4% | 7.0%(+4.42)#37 | 8.4%(+2.98)#6,417 |
| 38. | 85259 | 11.3% | 7.0%(+4.31)#38 | 8.4%(+2.87)#6,552 |
| 39. | 86018 | 11.3% | 7.0%(+4.28)#39 | 8.4%(+2.84)#6,606 |
| 40. | 85701 | 11.3% | 7.0%(+4.25)#40 | 8.4%(+2.81)#6,659 |
| 41. | 86325 | 11.1% | 7.0%(+4.08)#41 | 8.4%(+2.64)#6,932 |
| 42. | 85194 | 11.1% | 7.0%(+4.06)#42 | 8.4%(+2.62)#6,953 |
| 43. | 85755 | 11.0% | 7.0%(+3.99)#43 | 8.4%(+2.55)#7,081 |
| 44. | 85004 | 11.0% | 7.0%(+3.97)#44 | 8.4%(+2.53)#7,103 |
| 45. | 86332 | 11.0% | 7.0%(+3.97)#45 | 8.4%(+2.53)#7,112 |
| 46. | 85014 | 10.9% | 7.0%(+3.88)#46 | 8.4%(+2.45)#7,242 |
| 47. | 85748 | 10.8% | 7.0%(+3.83)#47 | 8.4%(+2.39)#7,304 |
| 48. | 85387 | 10.7% | 7.0%(+3.69)#48 | 8.4%(+2.25)#7,567 |
| 49. | 86004 | 10.7% | 7.0%(+3.68)#49 | 8.4%(+2.25)#7,573 |
| 50. | 86401 | 10.6% | 7.0%(+3.64)#50 | 8.4%(+2.20)#7,655 |
| 51. | 85718 | 10.6% | 7.0%(+3.59)#51 | 8.4%(+2.16)#7,726 |
| 52. | 85013 | 10.5% | 7.0%(+3.50)#52 | 8.4%(+2.06)#7,897 |
| 53. | 85363 | 10.5% | 7.0%(+3.45)#53 | 8.4%(+2.01)#7,995 |
| 54. | 85324 | 10.4% | 7.0%(+3.42)#54 | 8.4%(+1.99)#8,057 |
| 55. | 85630 | 10.3% | 7.0%(+3.26)#55 | 8.4%(+1.83)#8,358 |
| 56. | 85749 | 10.3% | 7.0%(+3.24)#56 | 8.4%(+1.81)#8,400 |
| 57. | 85745 | 10.2% | 7.0%(+3.18)#57 | 8.4%(+1.75)#8,521 |
| 58. | 85544 | 10.2% | 7.0%(+3.18)#58 | 8.4%(+1.74)#8,528 |
| 59. | 85536 | 10.2% | 7.0%(+3.16)#59 | 8.4%(+1.73)#8,568 |
| 60. | 85622 | 10.1% | 7.0%(+3.05)#60 | 8.4%(+1.62)#8,788 |
| 61. | 85367 | 10.0% | 7.0%(+3.03)#61 | 8.4%(+1.59)#8,834 |
| 62. | 85611 | 9.9% | 7.0%(+2.88)#62 | 8.4%(+1.45)#9,126 |
| 63. | 85603 | 9.8% | 7.0%(+2.77)#63 | 8.4%(+1.33)#9,360 |
| 64. | 85625 | 9.7% | 7.0%(+2.74)#64 | 8.4%(+1.30)#9,422 |
| 65. | 86301 | 9.7% | 7.0%(+2.69)#65 | 8.4%(+1.26)#9,523 |
| 66. | 86011 | 9.7% | 7.0%(+2.67)#66 | 8.4%(+1.24)#9,559 |
| 67. | 85646 | 9.6% | 7.0%(+2.61)#67 | 8.4%(+1.17)#9,695 |
| 68. | 86413 | 9.6% | 7.0%(+2.59)#68 | 8.4%(+1.15)#9,748 |
| 69. | 85339 | 9.6% | 7.0%(+2.58)#69 | 8.4%(+1.14)#9,768 |
| 70. | 85602 | 9.4% | 7.0%(+2.40)#70 | 8.4%(+0.959)#10,156 |
| 71. | 85012 | 9.3% | 7.0%(+2.33)#71 | 8.4%(+0.897)#10,281 |
| 72. | 85016 | 9.3% | 7.0%(+2.33)#72 | 8.4%(+0.890)#10,294 |
| 73. | 85378 | 9.2% | 7.0%(+2.17)#73 | 8.4%(+0.732)#10,655 |
| 74. | 86314 | 9.2% | 7.0%(+2.14)#74 | 8.4%(+0.709)#10,703 |
| 75. | 85054 | 9.1% | 7.0%(+2.12)#75 | 8.4%(+0.684)#10,757 |
| 76. | 86034 | 9.1% | 7.0%(+2.08)#76 | 8.4%(+0.646)#10,842 |
| 77. | 86326 | 9.0% | 7.0%(+1.96)#77 | 8.4%(+0.523)#11,138 |
| 78. | 85381 | 8.9% | 7.0%(+1.88)#78 | 8.4%(+0.445)#11,336 |
| 79. | 85710 | 8.9% | 7.0%(+1.87)#79 | 8.4%(+0.436)#11,369 |
| 80. | 85757 | 8.7% | 7.0%(+1.72)#80 | 8.4%(+0.285)#11,721 |
| 81. | 86437 | 8.7% | 7.0%(+1.69)#81 | 8.4%(+0.251)#11,815 |
| 82. | 85747 | 8.7% | 7.0%(+1.68)#82 | 8.4%(+0.246)#11,827 |
| 83. | 85373 | 8.6% | 7.0%(+1.60)#83 | 8.4%(+0.161)#12,015 |
| 84. | 85308 | 8.6% | 7.0%(+1.59)#84 | 8.4%(+0.157)#12,026 |
| 85. | 85118 | 8.6% | 7.0%(+1.57)#85 | 8.4%(+0.129)#12,086 |
| 86. | 85606 | 8.5% | 7.0%(+1.52)#86 | 8.4%(+0.088)#12,193 |
| 87. | 85173 | 8.5% | 7.0%(+1.49)#87 | 8.4%(+0.056)#12,273 |
| 88. | 85003 | 8.5% | 7.0%(+1.48)#88 | 8.4%(+0.048)#12,292 |
| 89. | 86025 | 8.5% | 7.0%(+1.47)#89 | 8.4%(+0.037)#12,319 |
| 90. | 85041 | 8.5% | 7.0%(+1.45)#90 | 8.4%(+0.011)#12,399 |
| 91. | 85365 | 8.4% | 7.0%(+1.42)#91 | 8.4%(-0.016)#12,481 |
| 92. | 85607 | 8.4% | 7.0%(+1.39)#92 | 8.4%(-0.044)#12,558 |
| 93. | 85618 | 8.4% | 7.0%(+1.38)#93 | 8.4%(-0.057)#12,592 |
| 94. | 86409 | 8.4% | 7.0%(+1.37)#94 | 8.4%(-0.062)#12,606 |
| 95. | 85715 | 8.4% | 7.0%(+1.35)#95 | 8.4%(-0.087)#12,674 |
| 96. | 85711 | 8.3% | 7.0%(+1.34)#96 | 8.4%(-0.098)#12,693 |
| 97. | 86336 | 8.3% | 7.0%(+1.29)#97 | 8.4%(-0.146)#12,834 |
| 98. | 85302 | 8.3% | 7.0%(+1.27)#98 | 8.4%(-0.161)#12,876 |
| 99. | 86033 | 8.2% | 7.0%(+1.22)#99 | 8.4%(-0.216)#13,017 |
| 100. | 85620 | 8.2% | 7.0%(+1.21)#100 | 8.4%(-0.229)#13,051 |
Common Questions
What are the Top 10 Zip Codes with the Highest Percentage of Not-for-profit Organizations in Arizona?
Top 10 Zip Codes with the Highest Percentage of Not-for-profit Organizations in Arizona are:
What zip code has the Highest Percentage of Not-for-profit Organizations in Arizona?
85934 has the Highest Percentage of Not-for-profit Organizations in Arizona with 33.8%.
What is the Percentage of Not-for-profit Organizations in the State of Arizona?
Percentage of Not-for-profit Organizations in Arizona is 7.0%.
What is the Percentage of Not-for-profit Organizations in the United States?
Percentage of Not-for-profit Organizations in the United States is 8.4%.