Zip Codes with the Highest Percentage of Population Employed in Office & Administration in Prescott Valley, AZ
RELATED REPORTS & OPTIONS
Office & Administration
Prescott Valley
Compare Zip Codes
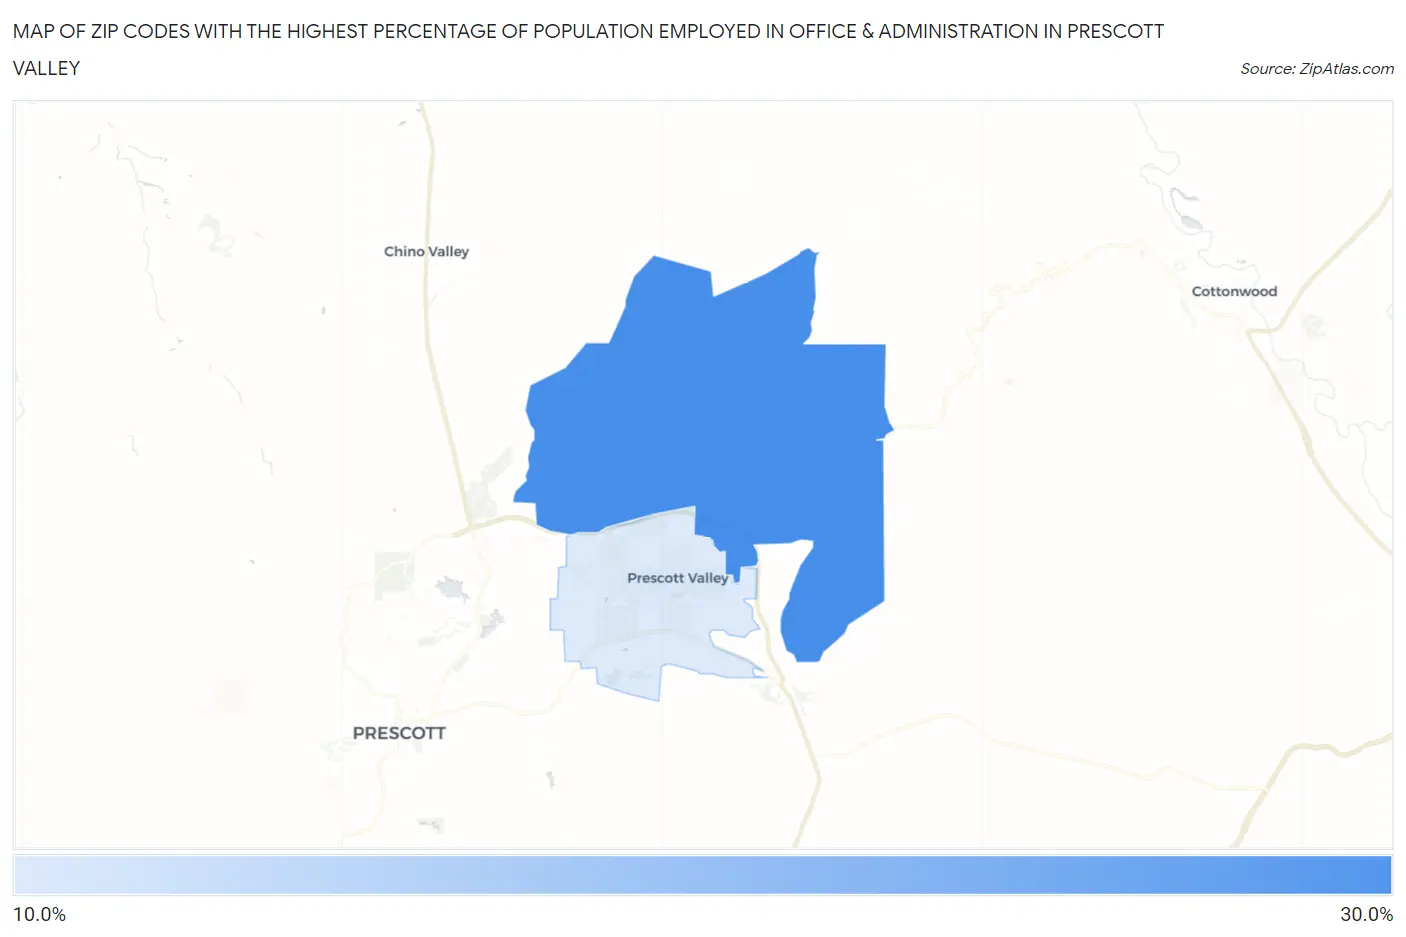
Map of Zip Codes with the Highest Percentage of Population Employed in Office & Administration in Prescott Valley
13.5%
28.3%
Zip Codes with the Highest Percentage of Population Employed in Office & Administration in Prescott Valley, AZ
| Zip Code | % Employed | vs State | vs National | |
| 1. | 86315 | 28.3% | 12.6%(+15.7)#10 | 10.9%(+17.5)#661 |
| 2. | 86314 | 13.5% | 12.6%(+0.869)#142 | 10.9%(+2.60)#7,017 |
1
Common Questions
What are the Top Zip Codes with the Highest Percentage of Population Employed in Office & Administration in Prescott Valley, AZ?
Top Zip Codes with the Highest Percentage of Population Employed in Office & Administration in Prescott Valley, AZ are:
What zip code has the Highest Percentage of Population Employed in Office & Administration in Prescott Valley, AZ?
86315 has the Highest Percentage of Population Employed in Office & Administration in Prescott Valley, AZ with 28.3%.
What is the Percentage of Population Employed in Office & Administration in Prescott Valley, AZ?
Percentage of Population Employed in Office & Administration in Prescott Valley is 15.4%.
What is the Percentage of Population Employed in Office & Administration in Arizona?
Percentage of Population Employed in Office & Administration in Arizona is 12.6%.
What is the Percentage of Population Employed in Office & Administration in the United States?
Percentage of Population Employed in Office & Administration in the United States is 10.9%.