Zip Codes with the Highest Percentage of Households Heated by Bottled Gas / Liquid Propane in Prescott Valley, AZ
RELATED REPORTS & OPTIONS
Bottled Gas / LP Heating
Prescott Valley
Compare Zip Codes
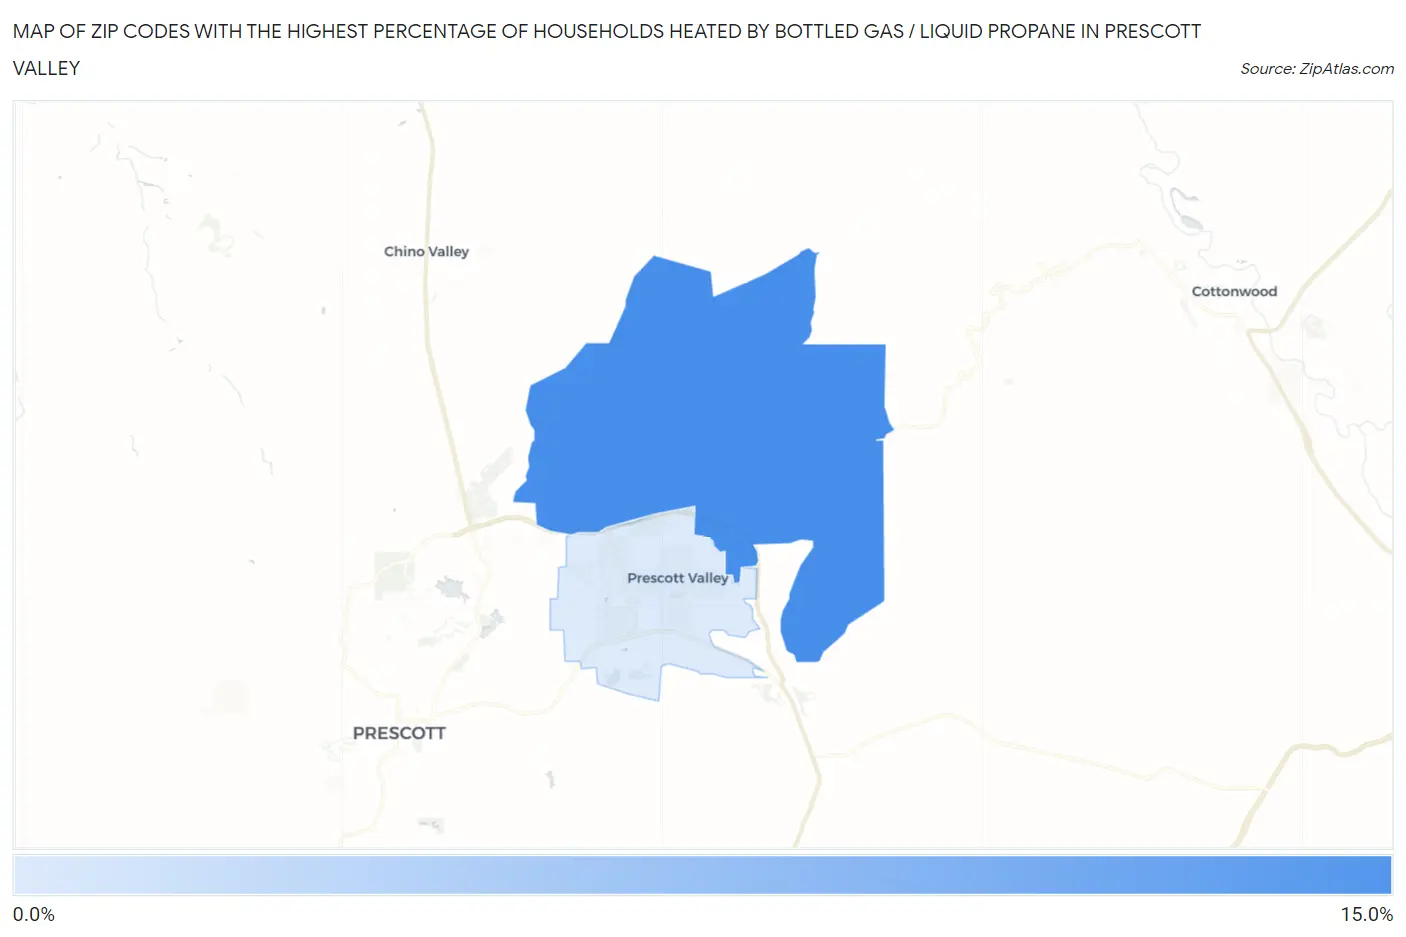
Map of Zip Codes with the Highest Percentage of Households Heated by Bottled Gas / Liquid Propane in Prescott Valley
2.5%
13.9%
Zip Codes with the Highest Percentage of Households Heated by Bottled Gas / Liquid Propane in Prescott Valley, AZ
| Zip Code | Bottled Gas / LP Heating | vs State | vs National | |
| 1. | 86315 | 13.9% | 2.8%(+11.1)#86 | 4.9%(+9.00)#11,906 |
| 2. | 86314 | 2.5% | 2.8%(-0.300)#204 | 4.9%(-2.40)#21,923 |
1
Common Questions
What are the Top Zip Codes with the Highest Percentage of Households Heated by Bottled Gas / Liquid Propane in Prescott Valley, AZ?
Top Zip Codes with the Highest Percentage of Households Heated by Bottled Gas / Liquid Propane in Prescott Valley, AZ are:
What zip code has the Highest Percentage of Households Heated by Bottled Gas / Liquid Propane in Prescott Valley, AZ?
86315 has the Highest Percentage of Households Heated by Bottled Gas / Liquid Propane in Prescott Valley, AZ with 13.9%.
What is the Percentage of Households Heated by Bottled Gas / Liquid Propane in Prescott Valley, AZ?
Percentage of Households Heated by Bottled Gas / Liquid Propane in Prescott Valley is 2.7%.
What is the Percentage of Households Heated by Bottled Gas / Liquid Propane in Arizona?
Percentage of Households Heated by Bottled Gas / Liquid Propane in Arizona is 2.8%.
What is the Percentage of Households Heated by Bottled Gas / Liquid Propane in the United States?
Percentage of Households Heated by Bottled Gas / Liquid Propane in the United States is 4.9%.