Zip Codes with the Highest Percentage of Population Employed in Installation, Maintenance & Repair in Prescott Valley, AZ
RELATED REPORTS & OPTIONS
Installation, Maintenance & Repair
Prescott Valley
Compare Zip Codes
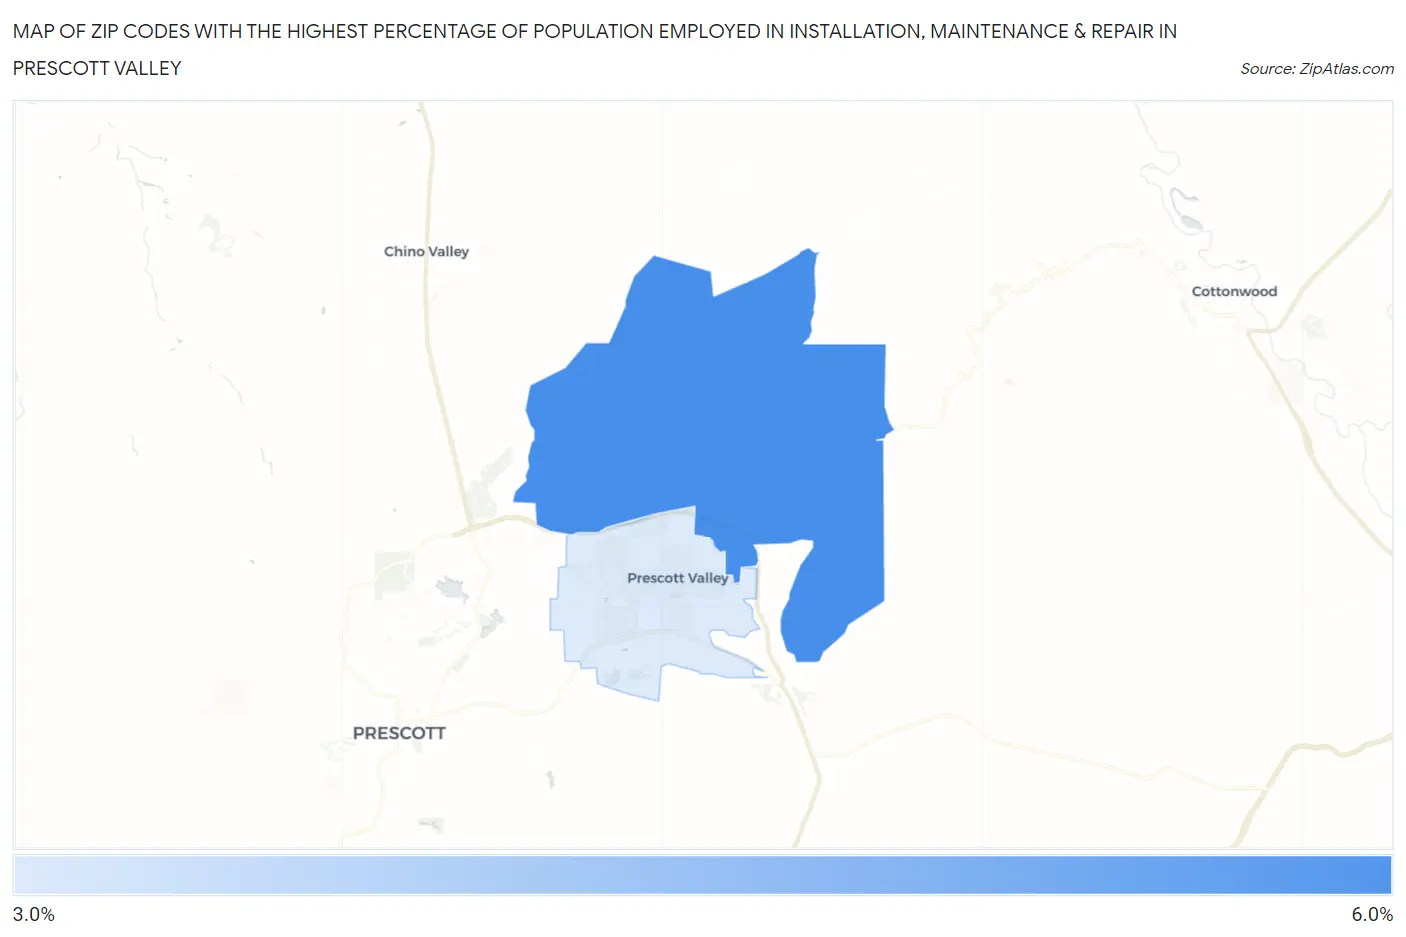
Map of Zip Codes with the Highest Percentage of Population Employed in Installation, Maintenance & Repair in Prescott Valley
3.4%
5.3%
Zip Codes with the Highest Percentage of Population Employed in Installation, Maintenance & Repair in Prescott Valley, AZ
| Zip Code | % Employed | vs State | vs National | |
| 1. | 86315 | 5.3% | 3.3%(+2.01)#63 | 3.1%(+2.20)#7,896 |
| 2. | 86314 | 3.4% | 3.3%(+0.157)#152 | 3.1%(+0.347)#15,015 |
1
Common Questions
What are the Top Zip Codes with the Highest Percentage of Population Employed in Installation, Maintenance & Repair in Prescott Valley, AZ?
Top Zip Codes with the Highest Percentage of Population Employed in Installation, Maintenance & Repair in Prescott Valley, AZ are:
What zip code has the Highest Percentage of Population Employed in Installation, Maintenance & Repair in Prescott Valley, AZ?
86315 has the Highest Percentage of Population Employed in Installation, Maintenance & Repair in Prescott Valley, AZ with 5.3%.
What is the Percentage of Population Employed in Installation, Maintenance & Repair in Prescott Valley, AZ?
Percentage of Population Employed in Installation, Maintenance & Repair in Prescott Valley is 4.0%.
What is the Percentage of Population Employed in Installation, Maintenance & Repair in Arizona?
Percentage of Population Employed in Installation, Maintenance & Repair in Arizona is 3.3%.
What is the Percentage of Population Employed in Installation, Maintenance & Repair in the United States?
Percentage of Population Employed in Installation, Maintenance & Repair in the United States is 3.1%.