Zip Codes with the Highest Percentage of Self-Employed / Not Incorporated in Prescott Valley, AZ
RELATED REPORTS & OPTIONS
Self-Employed / Not Incorporated
Prescott Valley
Compare Zip Codes
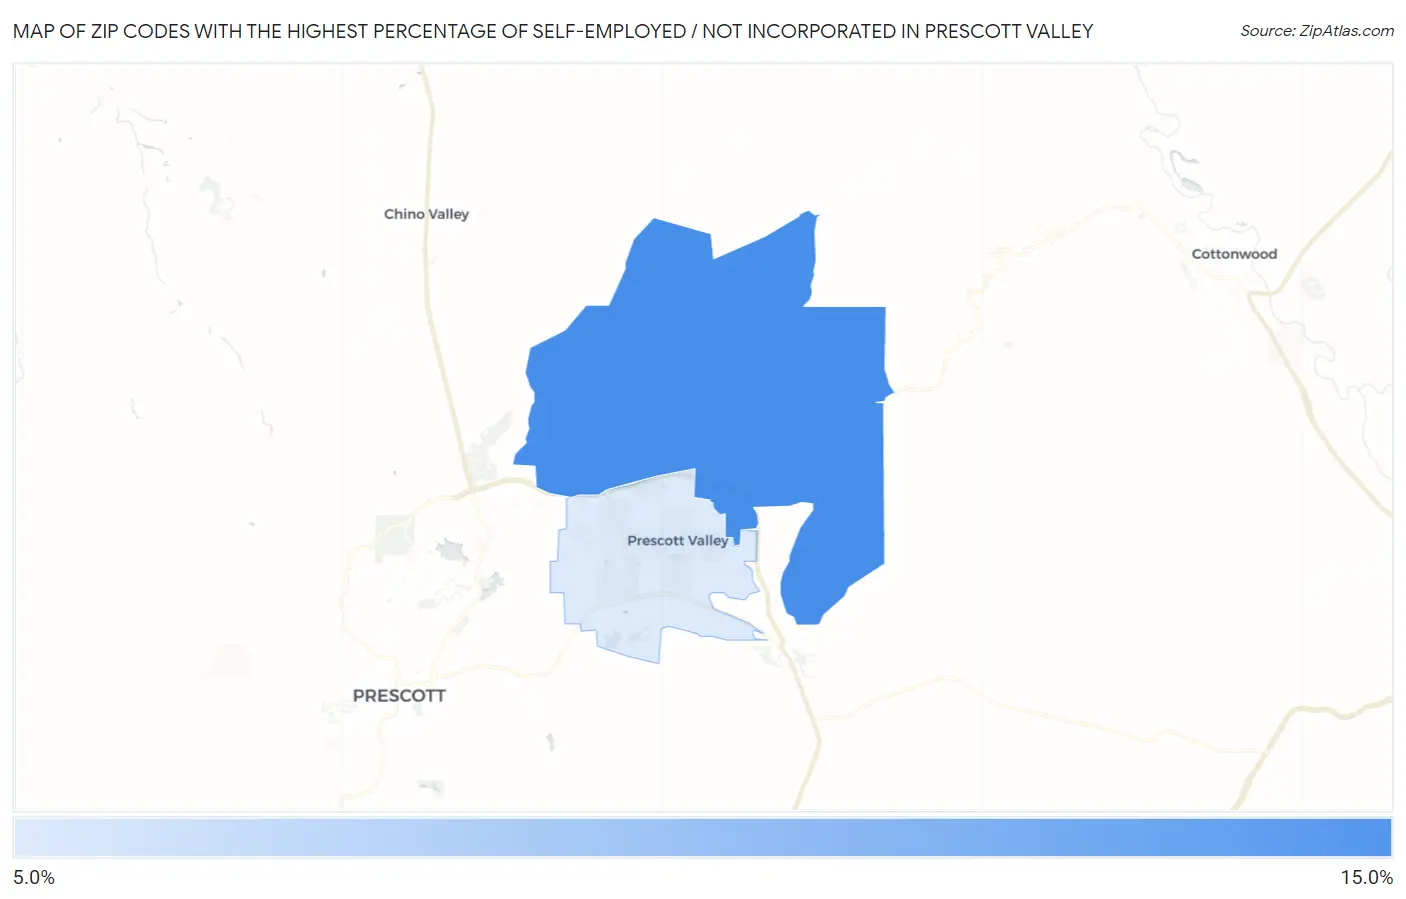
Map of Zip Codes with the Highest Percentage of Self-Employed / Not Incorporated in Prescott Valley
0.0%
15.0%
Zip Codes with the Highest Percentage of Self-Employed / Not Incorporated in Prescott Valley, AZ
| Zip Code | % Self-Employed / Not Incorporated | vs State | vs National | |
| 1. | 86315 | 11.5% | 5.9%(+5.67)#43 | 5.8%(+5.72)#5,672 |
| 2. | 86314 | 7.1% | 5.9%(+1.28)#130 | 5.8%(+1.32)#12,675 |
1
Common Questions
What are the Top Zip Codes with the Highest Percentage of Self-Employed / Not Incorporated in Prescott Valley, AZ?
Top Zip Codes with the Highest Percentage of Self-Employed / Not Incorporated in Prescott Valley, AZ are:
What zip code has the Highest Percentage of Self-Employed / Not Incorporated in Prescott Valley, AZ?
86315 has the Highest Percentage of Self-Employed / Not Incorporated in Prescott Valley, AZ with 11.5%.
What is the Percentage of Self-Employed / Not Incorporated in Prescott Valley, AZ?
Percentage of Self-Employed / Not Incorporated in Prescott Valley is 8.5%.
What is the Percentage of Self-Employed / Not Incorporated in Arizona?
Percentage of Self-Employed / Not Incorporated in Arizona is 5.9%.
What is the Percentage of Self-Employed / Not Incorporated in the United States?
Percentage of Self-Employed / Not Incorporated in the United States is 5.8%.