Zip Codes with the Highest Percentage of Population Employed in Accommodation & Food Services in Prescott Valley, AZ
RELATED REPORTS & OPTIONS
Accommodation & Food Services
Prescott Valley
Compare Zip Codes
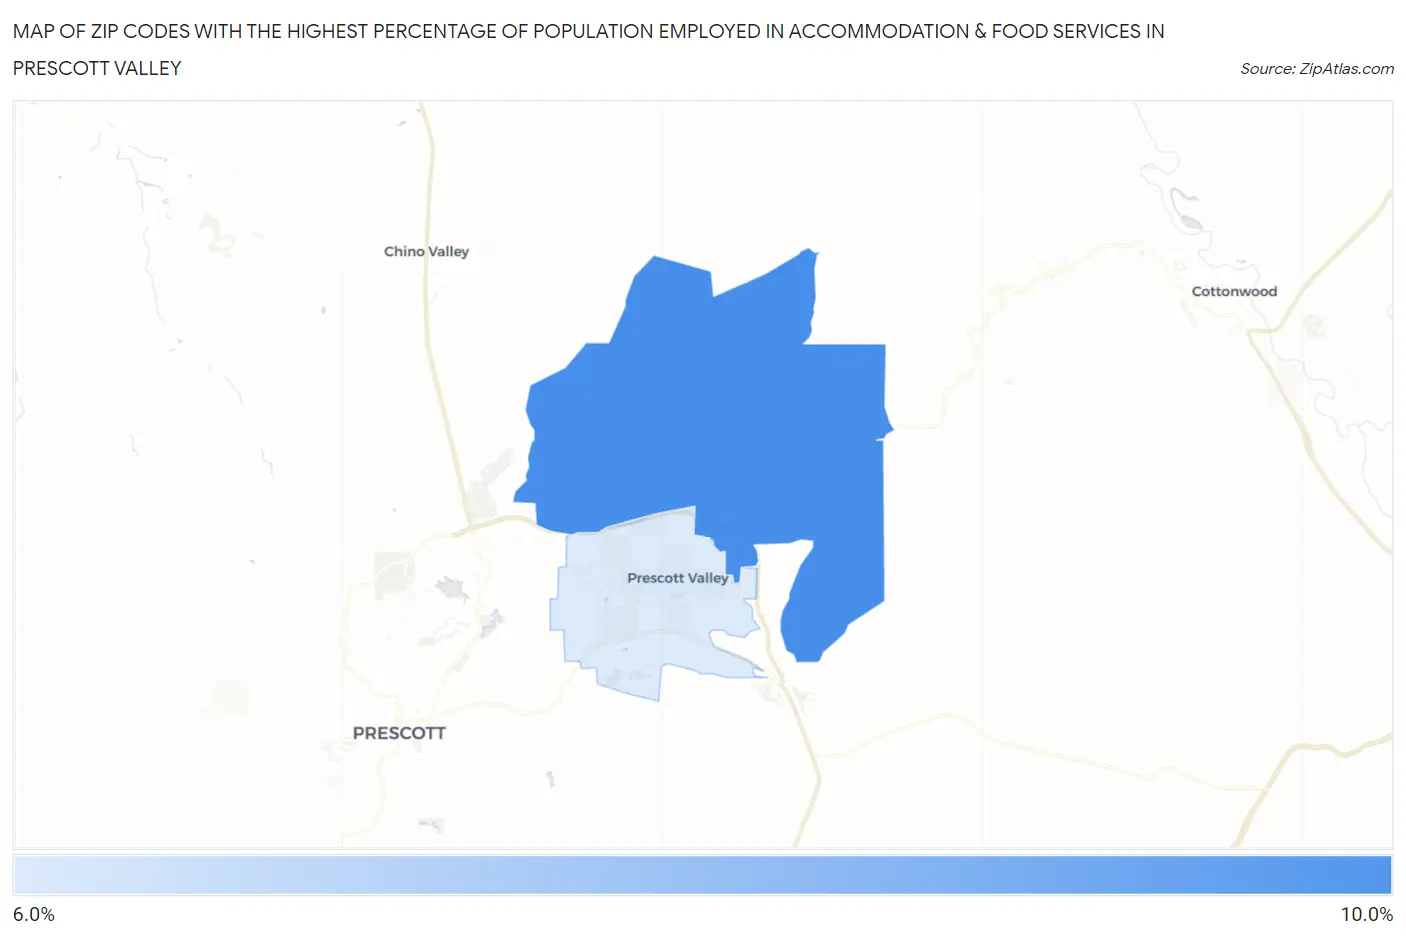
Map of Zip Codes with the Highest Percentage of Population Employed in Accommodation & Food Services in Prescott Valley
6.5%
8.4%
Zip Codes with the Highest Percentage of Population Employed in Accommodation & Food Services in Prescott Valley, AZ
| Zip Code | % Employed | vs State | vs National | |
| 1. | 86315 | 8.4% | 7.6%(+0.829)#149 | 6.9%(+1.50)#7,026 |
| 2. | 86314 | 6.5% | 7.6%(-1.08)#215 | 6.9%(-0.405)#11,922 |
1
Common Questions
What are the Top Zip Codes with the Highest Percentage of Population Employed in Accommodation & Food Services in Prescott Valley, AZ?
Top Zip Codes with the Highest Percentage of Population Employed in Accommodation & Food Services in Prescott Valley, AZ are:
What zip code has the Highest Percentage of Population Employed in Accommodation & Food Services in Prescott Valley, AZ?
86315 has the Highest Percentage of Population Employed in Accommodation & Food Services in Prescott Valley, AZ with 8.4%.
What is the Percentage of Population Employed in Accommodation & Food Services in Prescott Valley, AZ?
Percentage of Population Employed in Accommodation & Food Services in Prescott Valley is 6.6%.
What is the Percentage of Population Employed in Accommodation & Food Services in Arizona?
Percentage of Population Employed in Accommodation & Food Services in Arizona is 7.6%.
What is the Percentage of Population Employed in Accommodation & Food Services in the United States?
Percentage of Population Employed in Accommodation & Food Services in the United States is 6.9%.