Zip Codes with the Most Immigrants from Asia in Prescott Valley, AZ
RELATED REPORTS & OPTIONS
Asia
Prescott Valley
Compare Zip Codes
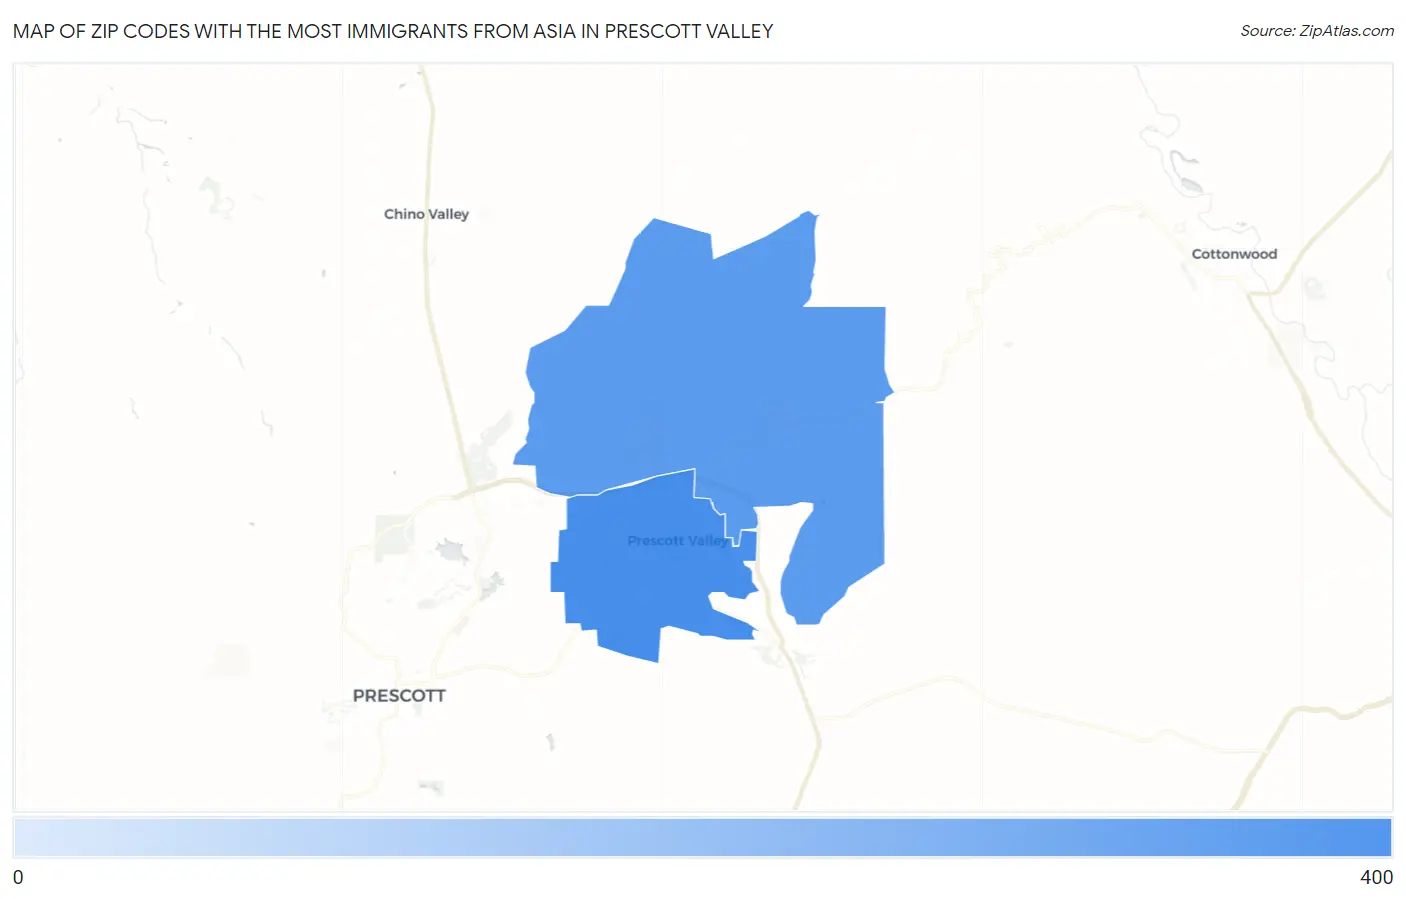
Map of Zip Codes with the Most Immigrants from Asia in Prescott Valley
159
311
Zip Codes with the Most Immigrants from Asia in Prescott Valley, AZ
| Zip Code | Asia | vs State | vs National | |
| 1. | 86314 | 311 | 191,433(0.16%)#138 | 14,105,933(0.00%)#6,281 |
| 2. | 86315 | 159 | 191,433(0.08%)#170 | 14,105,933(0.00%)#8,061 |
1
Common Questions
What are the Top Zip Codes with the Most Immigrants from Asia in Prescott Valley, AZ?
Top Zip Codes with the Most Immigrants from Asia in Prescott Valley, AZ are:
What zip code has the Most Immigrants from Asia in Prescott Valley, AZ?
86314 has the Most Immigrants from Asia in Prescott Valley, AZ with 311.
What is the Total Immigrants from Asia in Prescott Valley, AZ?
Total Immigrants from Asia in Prescott Valley is 450.
What is the Total Immigrants from Asia in Arizona?
Total Immigrants from Asia in Arizona is 191,433.
What is the Total Immigrants from Asia in the United States?
Total Immigrants from Asia in the United States is 14,105,933.