Zip Codes with the Highest Percentage of Population Employed in Architecture & Engineering in Prescott Valley, AZ
RELATED REPORTS & OPTIONS
Architecture & Engineering
Prescott Valley
Compare Zip Codes
Map of Zip Codes with the Highest Percentage of Population Employed in Architecture & Engineering in Prescott Valley
0.90%
1.2%
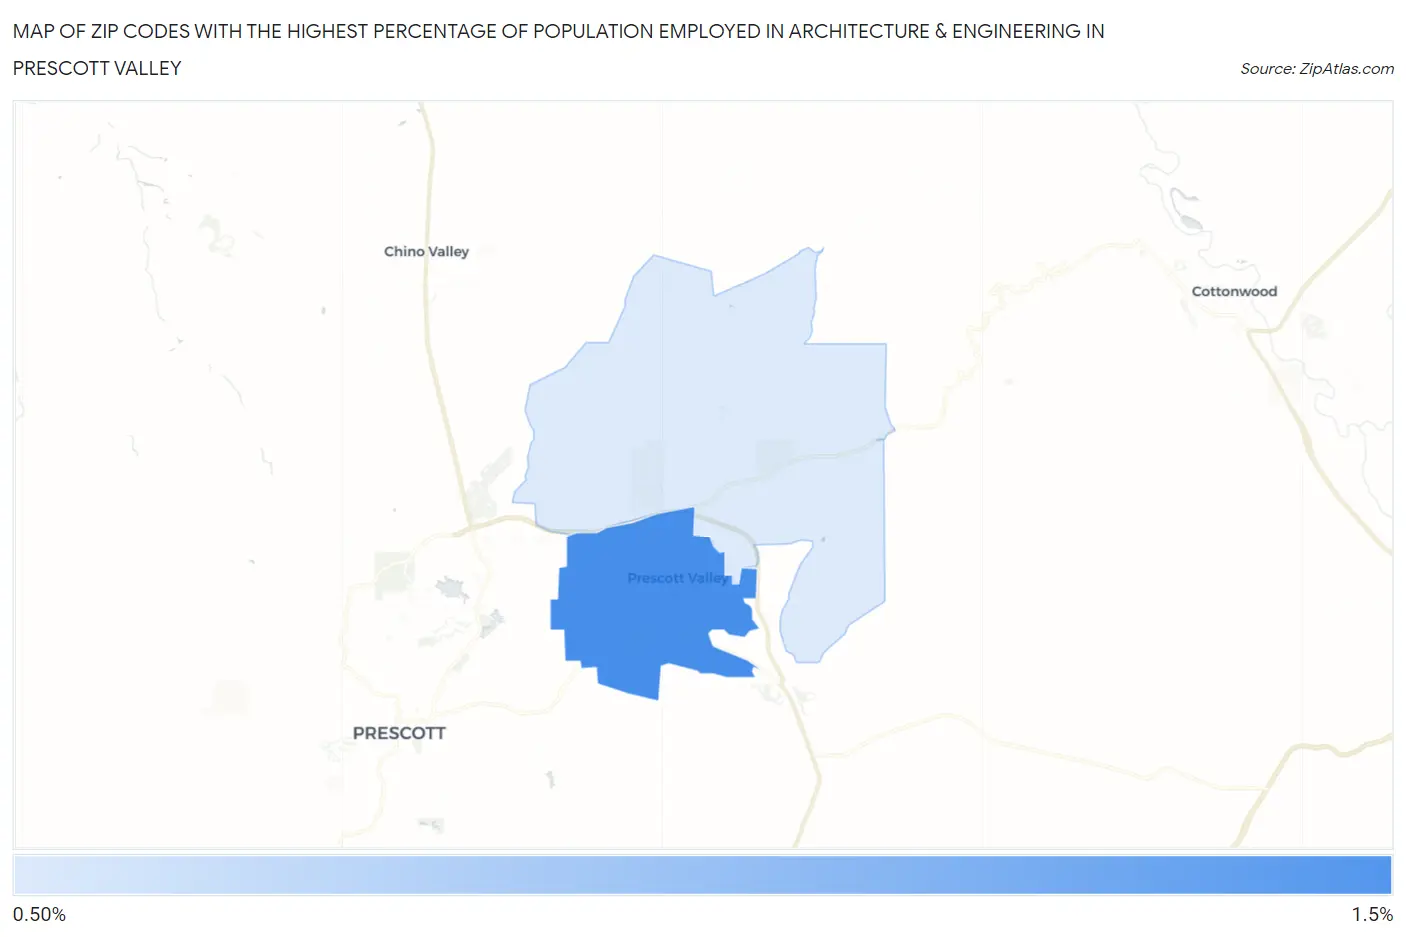
Zip Codes with the Highest Percentage of Population Employed in Architecture & Engineering in Prescott Valley, AZ
| Zip Code | % Employed | vs State | vs National | |
| 1. | 86314 | 1.2% | 2.4%(-1.22)#216 | 2.1%(-0.975)#15,291 |
| 2. | 86315 | 0.90% | 2.4%(-1.49)#242 | 2.1%(-1.25)#17,387 |
1
Common Questions
What are the Top Zip Codes with the Highest Percentage of Population Employed in Architecture & Engineering in Prescott Valley, AZ?
Top Zip Codes with the Highest Percentage of Population Employed in Architecture & Engineering in Prescott Valley, AZ are:
What zip code has the Highest Percentage of Population Employed in Architecture & Engineering in Prescott Valley, AZ?
86314 has the Highest Percentage of Population Employed in Architecture & Engineering in Prescott Valley, AZ with 1.2%.
What is the Percentage of Population Employed in Architecture & Engineering in Prescott Valley, AZ?
Percentage of Population Employed in Architecture & Engineering in Prescott Valley is 1.0%.
What is the Percentage of Population Employed in Architecture & Engineering in Arizona?
Percentage of Population Employed in Architecture & Engineering in Arizona is 2.4%.
What is the Percentage of Population Employed in Architecture & Engineering in the United States?
Percentage of Population Employed in Architecture & Engineering in the United States is 2.1%.