Eagle, AK Map & Demographics
Eagle Map
Eagle Overview
$34,690
PER CAPITA INCOME
$49,063
AVG FAMILY INCOME
$47,500
AVG HOUSEHOLD INCOME
0.39
INEQUALITY / GINI INDEX
99
TOTAL POPULATION
62
MALE POPULATION
37
FEMALE POPULATION
167.57
MALES / 100 FEMALES
59.68
FEMALES / 100 MALES
69.8
MEDIAN AGE
2.8
AVG FAMILY SIZE
2.1
AVG HOUSEHOLD SIZE
42
LABOR FORCE [ PEOPLE ]
42.4%
PERCENT IN LABOR FORCE
35.7%
UNEMPLOYMENT RATE
Eagle Zip Codes
Eagle Area Codes
Income in Eagle
Income Overview in Eagle
Per Capita Income in Eagle is $34,690, while median incomes of families and households are $49,063 and $47,500 respectively.
| Characteristic | Number | Measure |
| Per Capita Income | 99 | $34,690 |
| Median Family Income | 19 | $49,063 |
| Mean Family Income | 19 | $66,516 |
| Median Household Income | 48 | $47,500 |
| Mean Household Income | 48 | $63,221 |
| Income Deficit | 19 | $0 |
| Wage / Income Gap (%) | 99 | 0.00% |
| Wage / Income Gap ($) | 99 | 100.00¢ per $1 |
| Gini / Inequality Index | 99 | 0.39 |
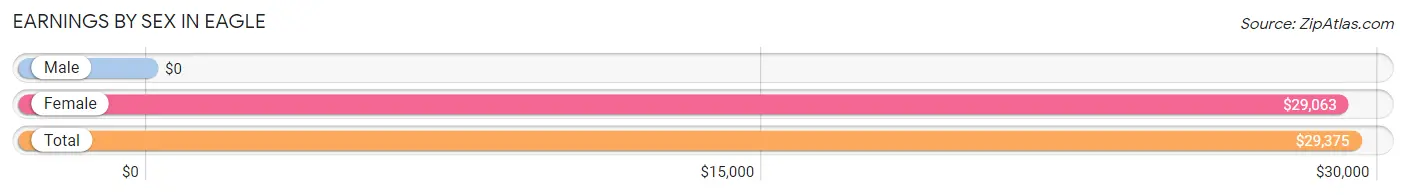
Earnings by Sex in Eagle
| Sex | Number | Average Earnings |
| Male | 33 (71.7%) | $0 |
| Female | 13 (28.3%) | $29,063 |
| Total | 46 (100.0%) | $29,375 |
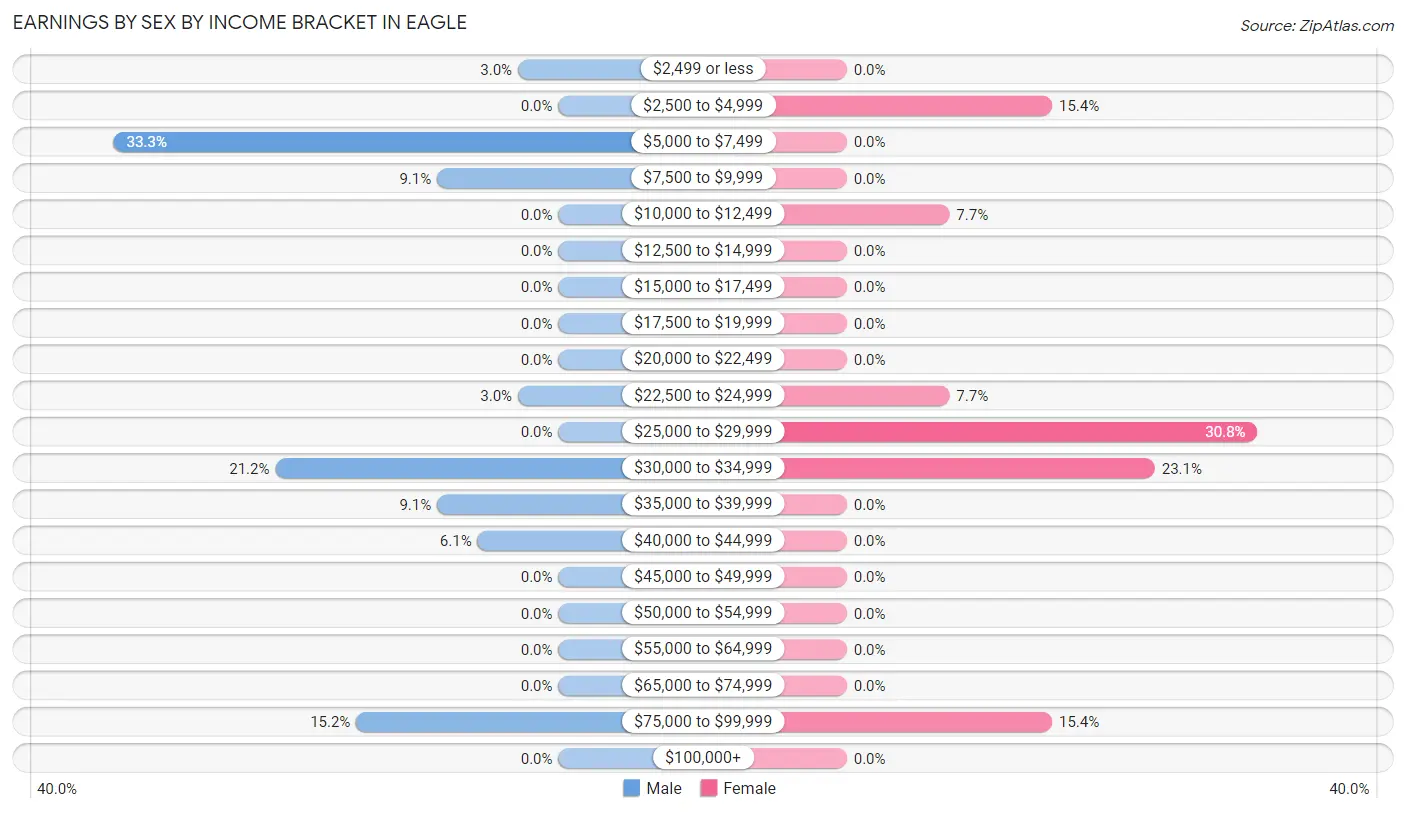
Earnings by Sex by Income Bracket in Eagle
The most common earnings brackets in Eagle are $5,000 to $7,499 for men (11 | 33.3%) and $25,000 to $29,999 for women (4 | 30.8%).
| Income | Male | Female |
| $2,499 or less | 1 (3.0%) | 0 (0.0%) |
| $2,500 to $4,999 | 0 (0.0%) | 2 (15.4%) |
| $5,000 to $7,499 | 11 (33.3%) | 0 (0.0%) |
| $7,500 to $9,999 | 3 (9.1%) | 0 (0.0%) |
| $10,000 to $12,499 | 0 (0.0%) | 1 (7.7%) |
| $12,500 to $14,999 | 0 (0.0%) | 0 (0.0%) |
| $15,000 to $17,499 | 0 (0.0%) | 0 (0.0%) |
| $17,500 to $19,999 | 0 (0.0%) | 0 (0.0%) |
| $20,000 to $22,499 | 0 (0.0%) | 0 (0.0%) |
| $22,500 to $24,999 | 1 (3.0%) | 1 (7.7%) |
| $25,000 to $29,999 | 0 (0.0%) | 4 (30.8%) |
| $30,000 to $34,999 | 7 (21.2%) | 3 (23.1%) |
| $35,000 to $39,999 | 3 (9.1%) | 0 (0.0%) |
| $40,000 to $44,999 | 2 (6.1%) | 0 (0.0%) |
| $45,000 to $49,999 | 0 (0.0%) | 0 (0.0%) |
| $50,000 to $54,999 | 0 (0.0%) | 0 (0.0%) |
| $55,000 to $64,999 | 0 (0.0%) | 0 (0.0%) |
| $65,000 to $74,999 | 0 (0.0%) | 0 (0.0%) |
| $75,000 to $99,999 | 5 (15.1%) | 2 (15.4%) |
| $100,000+ | 0 (0.0%) | 0 (0.0%) |
| Total | 33 (100.0%) | 13 (100.0%) |
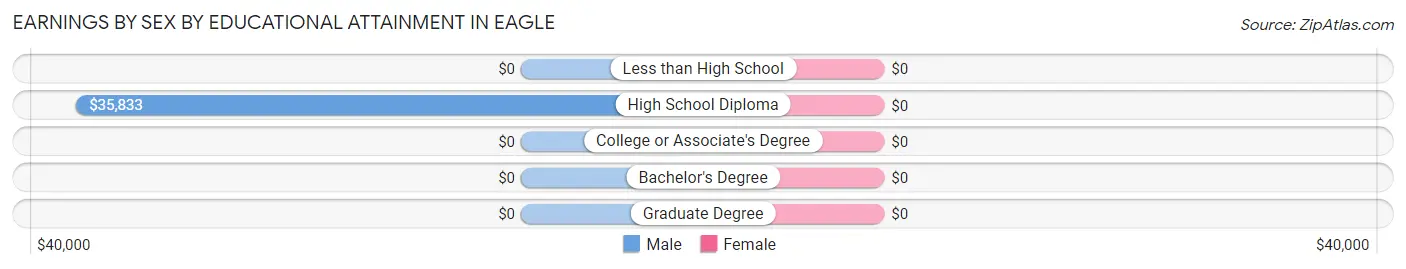
Earnings by Sex by Educational Attainment in Eagle
| Educational Attainment | Male Income | Female Income |
| Less than High School | - | - |
| High School Diploma | $35,833 | $0 |
| College or Associate's Degree | - | - |
| Bachelor's Degree | - | - |
| Graduate Degree | - | - |
| Total | - | - |
Family Income in Eagle
Family Income Brackets in Eagle
According to the Eagle family income data, there are 11 families falling into the $35,000 to $49,999 income range, which is the most common income bracket and makes up 57.9% of all families.
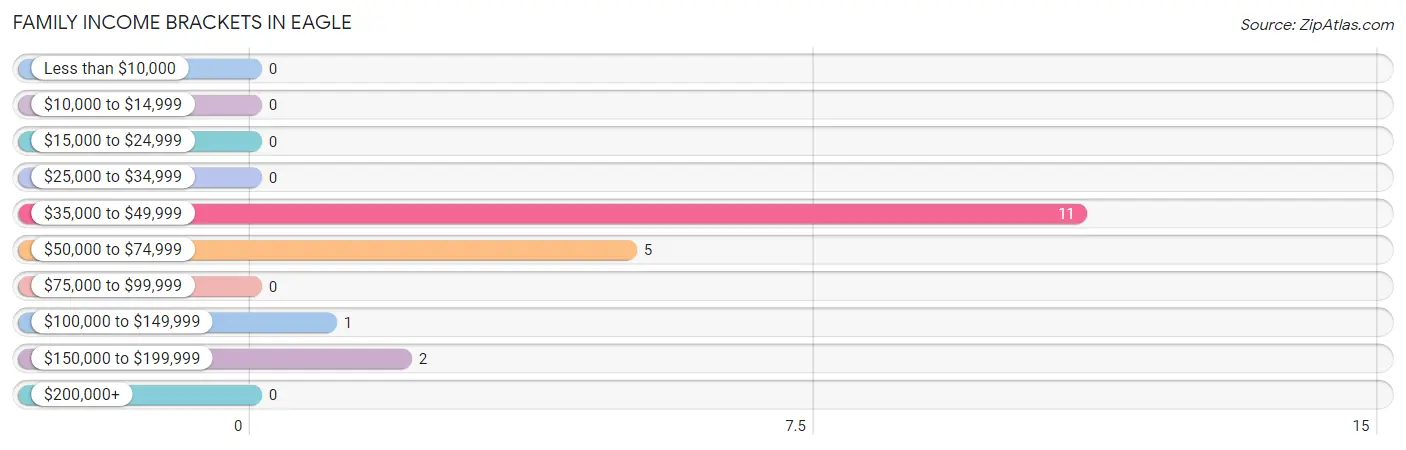
| Income Bracket | # Families | % Families |
| Less than $10,000 | 0 | 0.0% |
| $10,000 to $14,999 | 0 | 0.0% |
| $15,000 to $24,999 | 0 | 0.0% |
| $25,000 to $34,999 | 0 | 0.0% |
| $35,000 to $49,999 | 11 | 57.9% |
| $50,000 to $74,999 | 5 | 26.3% |
| $75,000 to $99,999 | 0 | 0.0% |
| $100,000 to $149,999 | 1 | 5.3% |
| $150,000 to $199,999 | 2 | 10.5% |
| $200,000+ | 0 | 0.0% |
Family Income by Famaliy Size in Eagle
2-person families (16 | 84.2%) account for the highest median family income in Eagle with $48,125 per family, while 2-person families (16 | 84.2%) have the highest median income of $24,062 per family member.
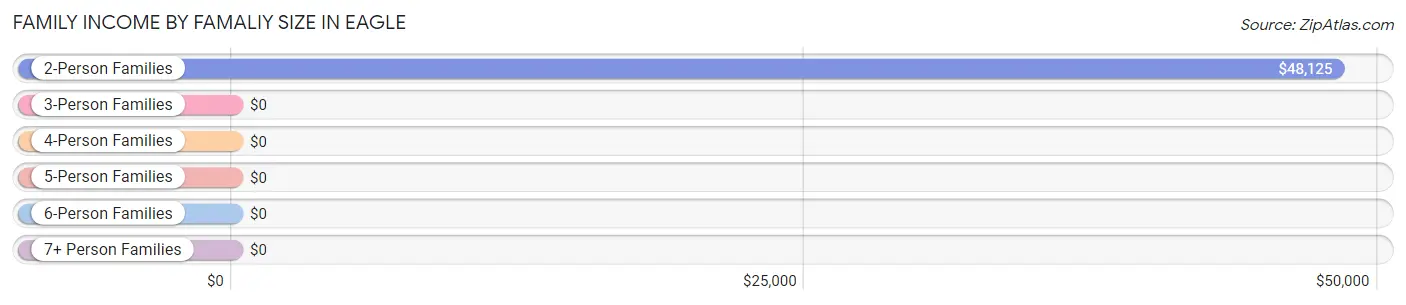
| Income Bracket | # Families | Median Income |
| 2-Person Families | 16 (84.2%) | $48,125 |
| 3-Person Families | 3 (15.8%) | $0 |
| 4-Person Families | 0 (0.0%) | $0 |
| 5-Person Families | 0 (0.0%) | $0 |
| 6-Person Families | 0 (0.0%) | $0 |
| 7+ Person Families | 0 (0.0%) | $0 |
| Total | 19 (100.0%) | $49,063 |
Family Income by Number of Earners in Eagle
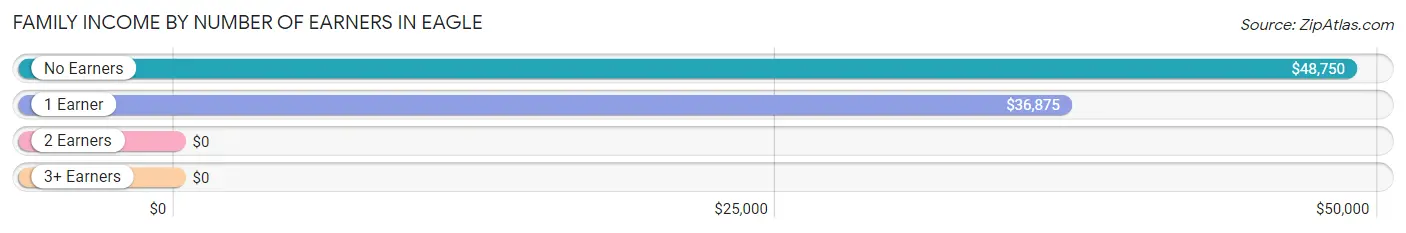
| Number of Earners | # Families | Median Income |
| No Earners | 10 (52.6%) | $48,750 |
| 1 Earner | 6 (31.6%) | $36,875 |
| 2 Earners | 2 (10.5%) | $0 |
| 3+ Earners | 1 (5.3%) | $0 |
| Total | 19 (100.0%) | $49,063 |
Household Income in Eagle
Household Income Brackets in Eagle
With 17 households falling in the category, the $35,000 to $49,999 income range is the most frequent in Eagle, accounting for 35.4% of all households.
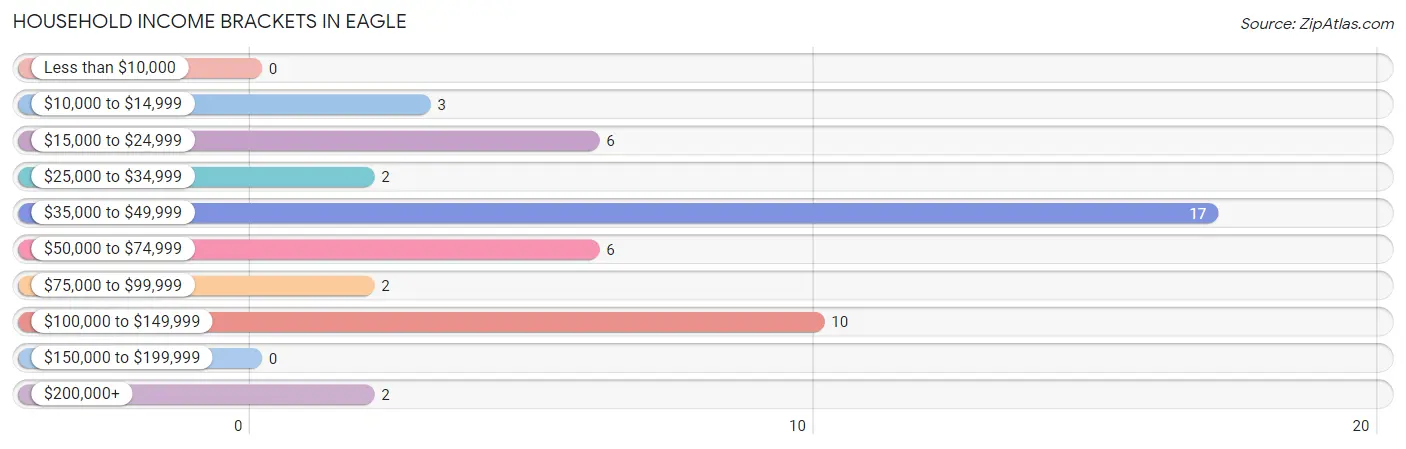
| Income Bracket | # Households | % Households |
| Less than $10,000 | 0 | 0.0% |
| $10,000 to $14,999 | 3 | 6.3% |
| $15,000 to $24,999 | 6 | 12.5% |
| $25,000 to $34,999 | 2 | 4.2% |
| $35,000 to $49,999 | 17 | 35.4% |
| $50,000 to $74,999 | 6 | 12.5% |
| $75,000 to $99,999 | 2 | 4.2% |
| $100,000 to $149,999 | 10 | 20.8% |
| $150,000 to $199,999 | 0 | 0.0% |
| $200,000+ | 2 | 4.2% |
Household Income by Householder Age in Eagle
The median household income in Eagle is $47,500, with the highest median household income of $49,063 found in the 65+ years age bracket for the primary householder. A total of 33 households (68.8%) fall into this category.
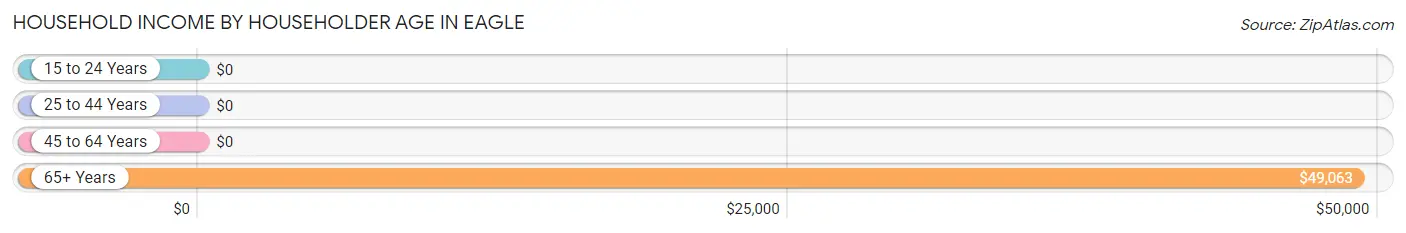
| Income Bracket | # Households | Median Income |
| 15 to 24 Years | 0 (0.0%) | $0 |
| 25 to 44 Years | 6 (12.5%) | $0 |
| 45 to 64 Years | 9 (18.8%) | $0 |
| 65+ Years | 33 (68.8%) | $49,063 |
| Total | 48 (100.0%) | $47,500 |
Poverty in Eagle
Income Below Poverty by Sex and Age in Eagle
With 4.8% poverty level for males and 10.8% for females among the residents of Eagle, 35 to 44 year old males and 35 to 44 year old females are the most vulnerable to poverty, with 3 males (100.0%) and 2 females (100.0%) in their respective age groups living below the poverty level.
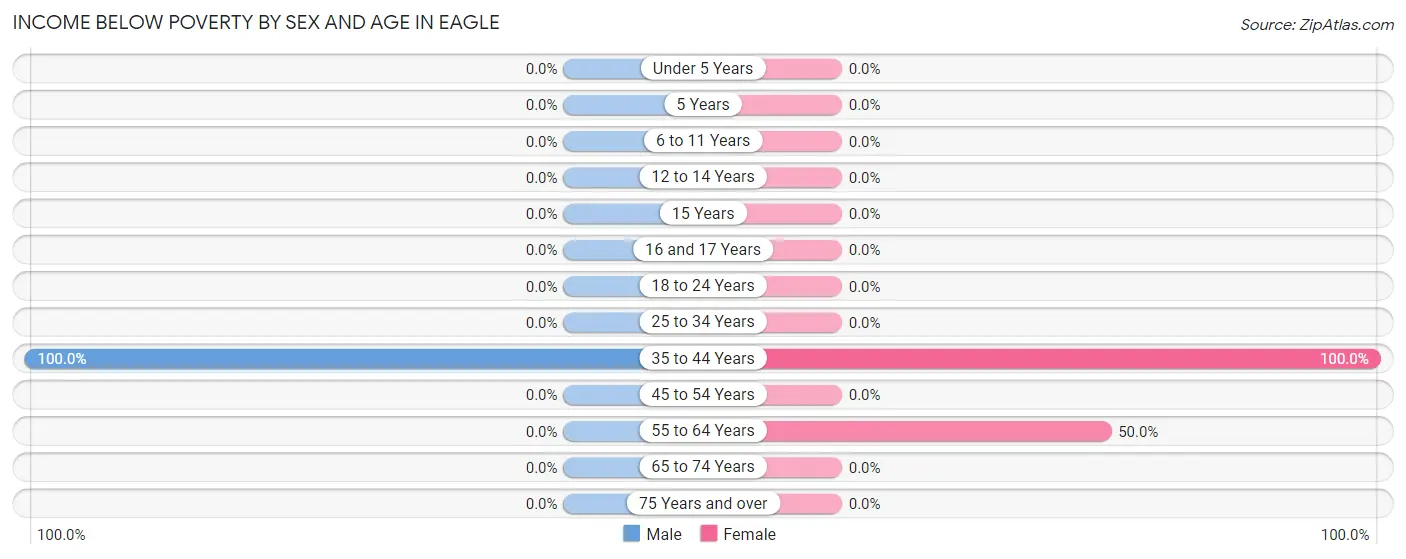
| Age Bracket | Male | Female |
| Under 5 Years | 0 (0.0%) | 0 (0.0%) |
| 5 Years | 0 (0.0%) | 0 (0.0%) |
| 6 to 11 Years | 0 (0.0%) | 0 (0.0%) |
| 12 to 14 Years | 0 (0.0%) | 0 (0.0%) |
| 15 Years | 0 (0.0%) | 0 (0.0%) |
| 16 and 17 Years | 0 (0.0%) | 0 (0.0%) |
| 18 to 24 Years | 0 (0.0%) | 0 (0.0%) |
| 25 to 34 Years | 0 (0.0%) | 0 (0.0%) |
| 35 to 44 Years | 3 (100.0%) | 2 (100.0%) |
| 45 to 54 Years | 0 (0.0%) | 0 (0.0%) |
| 55 to 64 Years | 0 (0.0%) | 2 (50.0%) |
| 65 to 74 Years | 0 (0.0%) | 0 (0.0%) |
| 75 Years and over | 0 (0.0%) | 0 (0.0%) |
| Total | 3 (4.8%) | 4 (10.8%) |
Income Above Poverty by Sex and Age in Eagle
According to the poverty statistics in Eagle, males aged 16 and 17 years and females aged 18 to 24 years are the age groups that are most secure financially, with 100.0% of males and 100.0% of females in these age groups living above the poverty line.
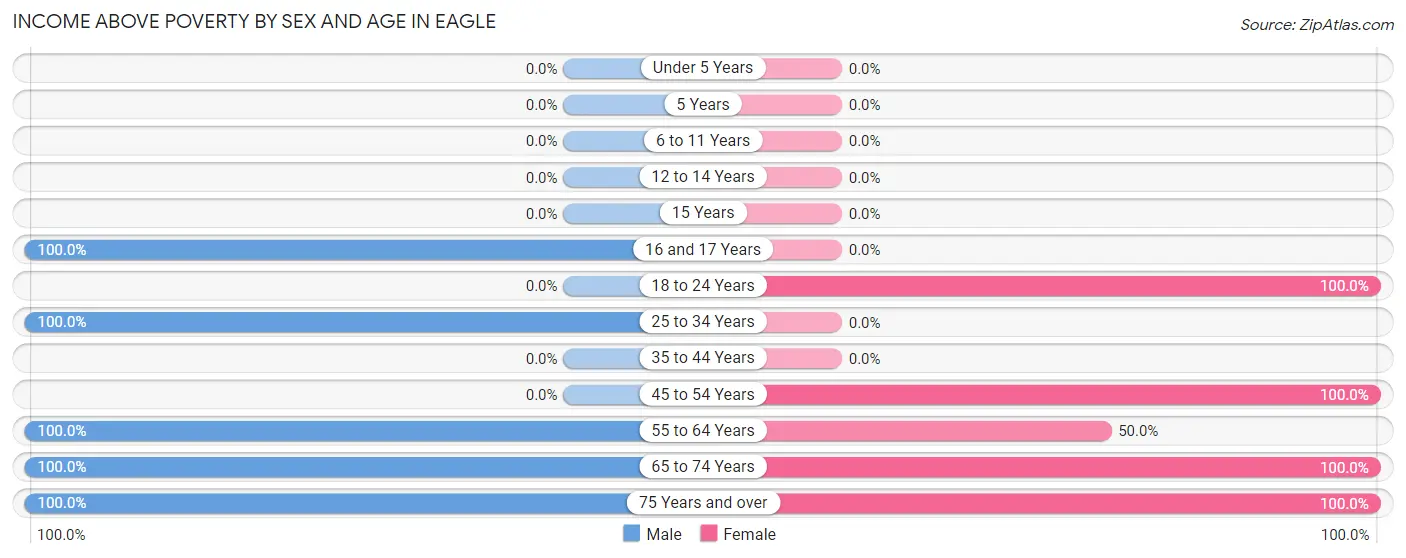
| Age Bracket | Male | Female |
| Under 5 Years | 0 (0.0%) | 0 (0.0%) |
| 5 Years | 0 (0.0%) | 0 (0.0%) |
| 6 to 11 Years | 0 (0.0%) | 0 (0.0%) |
| 12 to 14 Years | 0 (0.0%) | 0 (0.0%) |
| 15 Years | 0 (0.0%) | 0 (0.0%) |
| 16 and 17 Years | 2 (100.0%) | 0 (0.0%) |
| 18 to 24 Years | 0 (0.0%) | 5 (100.0%) |
| 25 to 34 Years | 3 (100.0%) | 0 (0.0%) |
| 35 to 44 Years | 0 (0.0%) | 0 (0.0%) |
| 45 to 54 Years | 0 (0.0%) | 3 (100.0%) |
| 55 to 64 Years | 14 (100.0%) | 2 (50.0%) |
| 65 to 74 Years | 27 (100.0%) | 13 (100.0%) |
| 75 Years and over | 13 (100.0%) | 10 (100.0%) |
| Total | 59 (95.2%) | 33 (89.2%) |
Income Below Poverty Among Married-Couple Families in Eagle
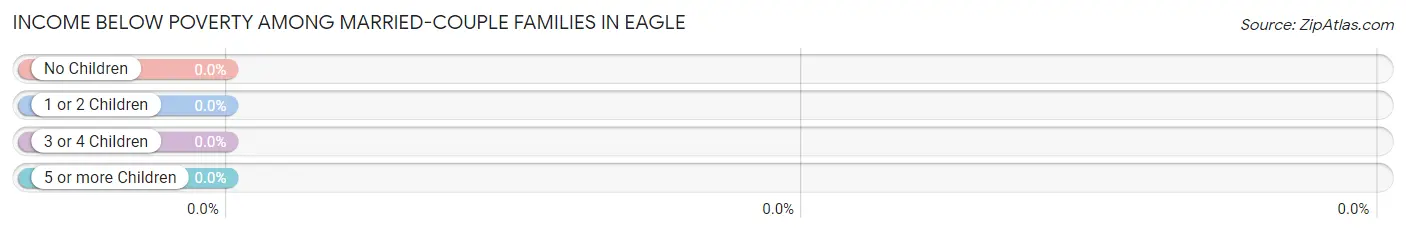
| Children | Above Poverty | Below Poverty |
| No Children | 13 (100.0%) | 0 (0.0%) |
| 1 or 2 Children | 1 (100.0%) | 0 (0.0%) |
| 3 or 4 Children | 0 (0.0%) | 0 (0.0%) |
| 5 or more Children | 0 (0.0%) | 0 (0.0%) |
| Total | 14 (100.0%) | 0 (0.0%) |
Income Below Poverty Among Single-Parent Households in Eagle
| Children | Single Father | Single Mother |
| No Children | 0 (0.0%) | 0 (0.0%) |
| 1 or 2 Children | 0 (0.0%) | 0 (0.0%) |
| 3 or 4 Children | 0 (0.0%) | 0 (0.0%) |
| 5 or more Children | 0 (0.0%) | 0 (0.0%) |
| Total | 0 (0.0%) | 0 (0.0%) |
Income Below Poverty Among Married-Couple vs Single-Parent Households in Eagle
| Children | Married-Couple Families | Single-Parent Households |
| No Children | 0 (0.0%) | 0 (0.0%) |
| 1 or 2 Children | 0 (0.0%) | 0 (0.0%) |
| 3 or 4 Children | 0 (0.0%) | 0 (0.0%) |
| 5 or more Children | 0 (0.0%) | 0 (0.0%) |
| Total | 0 (0.0%) | 0 (0.0%) |
Race in Eagle
The most populous races in Eagle are White / Caucasian (92 | 92.9%), Some other Race (5 | 5.1%), and Native / Alaskan (2 | 2.0%).
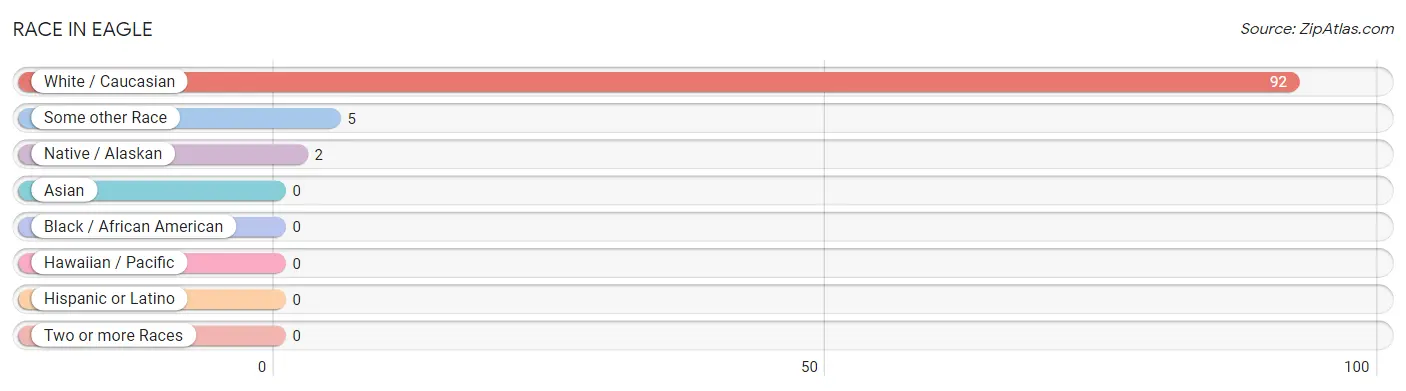
| Race | # Population | % Population |
| Asian | 0 | 0.0% |
| Black / African American | 0 | 0.0% |
| Hawaiian / Pacific | 0 | 0.0% |
| Hispanic or Latino | 0 | 0.0% |
| Native / Alaskan | 2 | 2.0% |
| White / Caucasian | 92 | 92.9% |
| Two or more Races | 0 | 0.0% |
| Some other Race | 5 | 5.1% |
| Total | 99 | 100.0% |
Ancestry in Eagle
The most populous ancestries reported in Eagle are German (33 | 33.3%), English (12 | 12.1%), Irish (9 | 9.1%), Norwegian (9 | 9.1%), and Ukrainian (9 | 9.1%), together accounting for 72.7% of all Eagle residents.
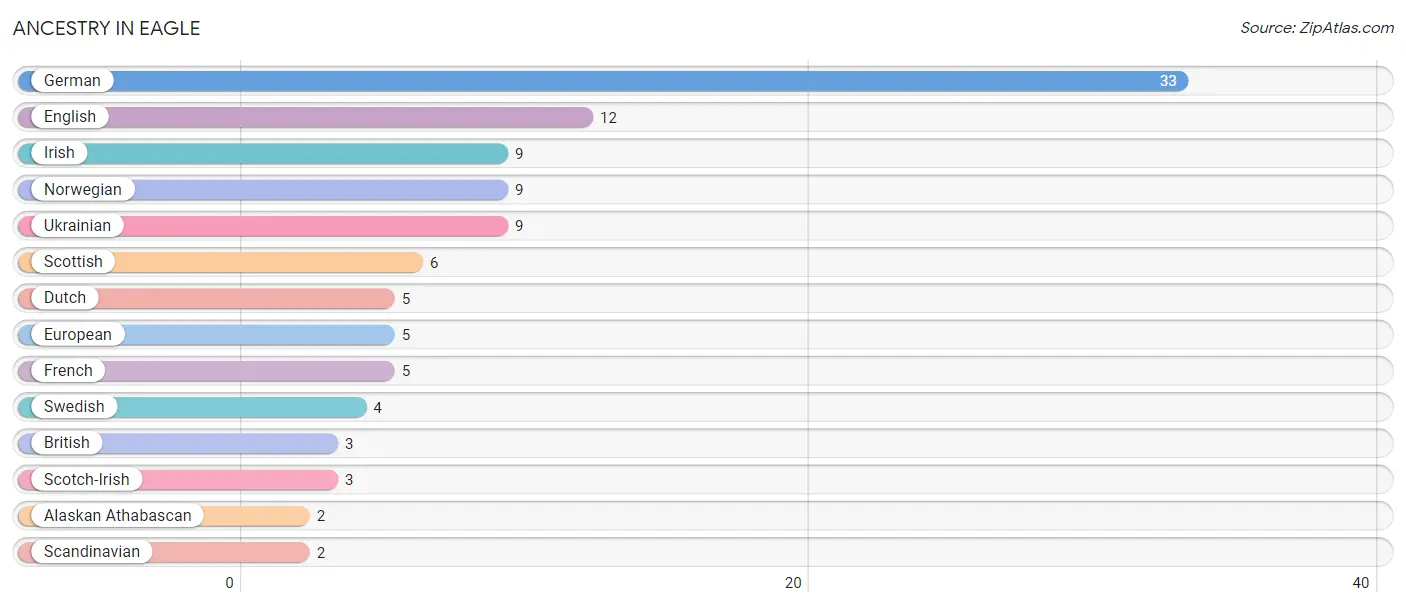
| Ancestry | # Population | % Population |
| Alaskan Athabascan | 2 | 2.0% |
| British | 3 | 3.0% |
| Dutch | 5 | 5.1% |
| English | 12 | 12.1% |
| European | 5 | 5.1% |
| French | 5 | 5.1% |
| German | 33 | 33.3% |
| Irish | 9 | 9.1% |
| Norwegian | 9 | 9.1% |
| Scandinavian | 2 | 2.0% |
| Scotch-Irish | 3 | 3.0% |
| Scottish | 6 | 6.1% |
| Swedish | 4 | 4.0% |
| Ukrainian | 9 | 9.1% | View All 14 Rows |
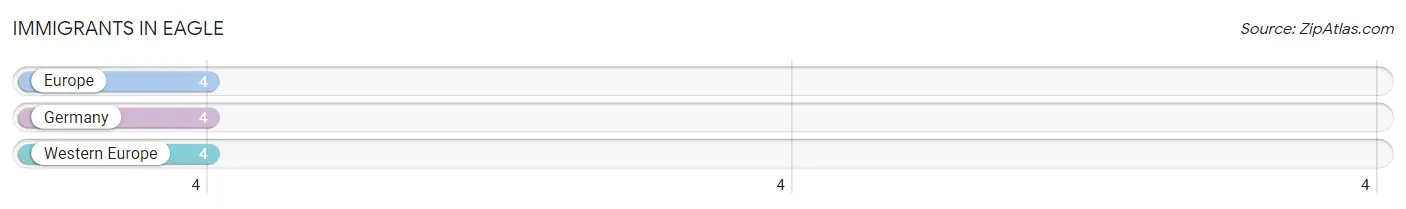
Immigrants in Eagle
The most numerous immigrant groups reported in Eagle came from Europe (4 | 4.0%), Germany (4 | 4.0%), and Western Europe (4 | 4.0%), together accounting for 12.1% of all Eagle residents.
| Immigration Origin | # Population | % Population |
| Europe | 4 | 4.0% |
| Germany | 4 | 4.0% |
| Western Europe | 4 | 4.0% | View All 3 Rows |
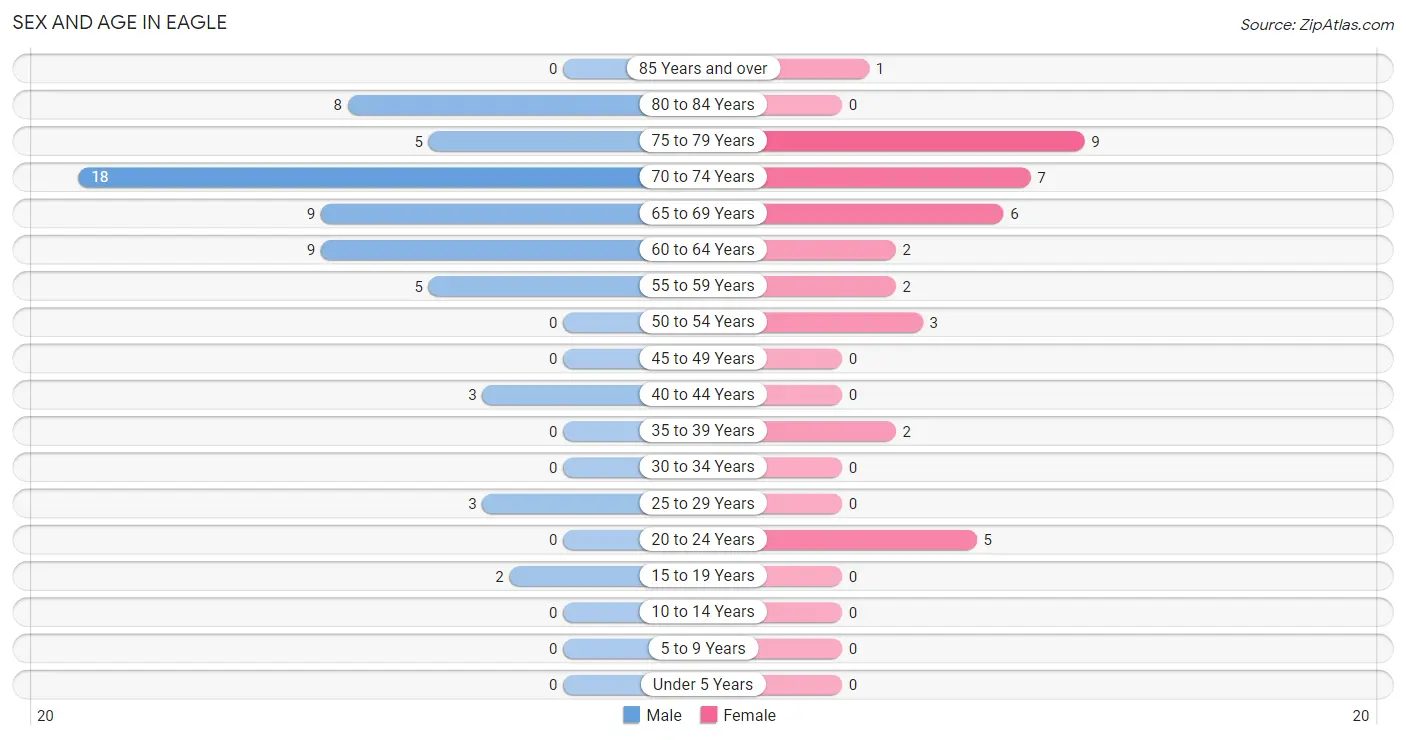
Sex and Age in Eagle
Sex and Age in Eagle
The most populous age groups in Eagle are 70 to 74 Years (18 | 29.0%) for men and 75 to 79 Years (9 | 24.3%) for women.
| Age Bracket | Male | Female |
| Under 5 Years | 0 (0.0%) | 0 (0.0%) |
| 5 to 9 Years | 0 (0.0%) | 0 (0.0%) |
| 10 to 14 Years | 0 (0.0%) | 0 (0.0%) |
| 15 to 19 Years | 2 (3.2%) | 0 (0.0%) |
| 20 to 24 Years | 0 (0.0%) | 5 (13.5%) |
| 25 to 29 Years | 3 (4.8%) | 0 (0.0%) |
| 30 to 34 Years | 0 (0.0%) | 0 (0.0%) |
| 35 to 39 Years | 0 (0.0%) | 2 (5.4%) |
| 40 to 44 Years | 3 (4.8%) | 0 (0.0%) |
| 45 to 49 Years | 0 (0.0%) | 0 (0.0%) |
| 50 to 54 Years | 0 (0.0%) | 3 (8.1%) |
| 55 to 59 Years | 5 (8.1%) | 2 (5.4%) |
| 60 to 64 Years | 9 (14.5%) | 2 (5.4%) |
| 65 to 69 Years | 9 (14.5%) | 6 (16.2%) |
| 70 to 74 Years | 18 (29.0%) | 7 (18.9%) |
| 75 to 79 Years | 5 (8.1%) | 9 (24.3%) |
| 80 to 84 Years | 8 (12.9%) | 0 (0.0%) |
| 85 Years and over | 0 (0.0%) | 1 (2.7%) |
| Total | 62 (100.0%) | 37 (100.0%) |
Families and Households in Eagle
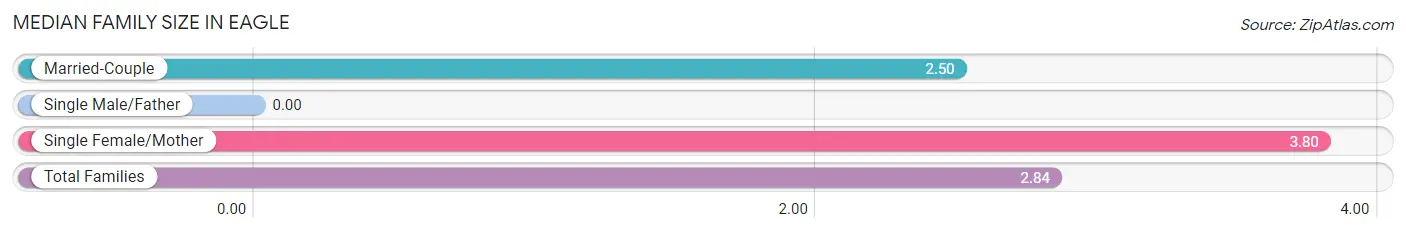
Median Family Size in Eagle
| Family Type | # Families | Family Size |
| Married-Couple | 14 (73.7%) | 2.50 |
| Single Male/Father | 0 (0.0%) | - |
| Single Female/Mother | 5 (26.3%) | 3.80 |
| Total Families | 19 (100.0%) | 2.84 |
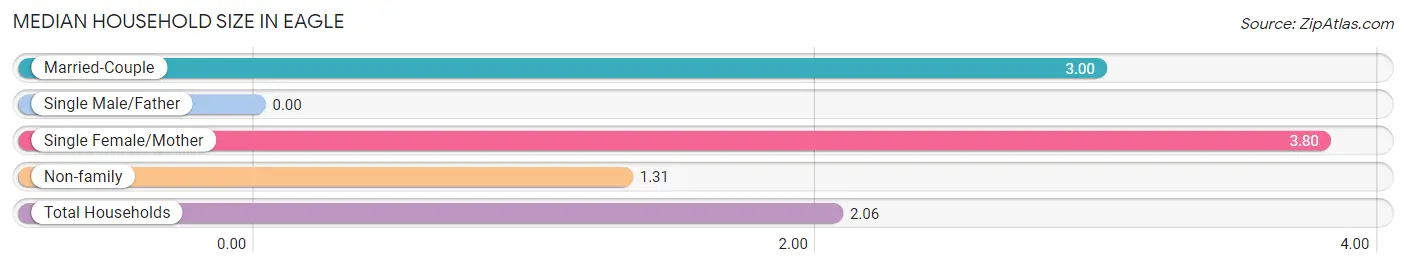
Median Household Size in Eagle
| Household Type | # Households | Household Size |
| Married-Couple | 14 (29.2%) | 3.00 |
| Single Male/Father | 0 (0.0%) | - |
| Single Female/Mother | 5 (10.4%) | 3.80 |
| Non-family | 29 (60.4%) | 1.31 |
| Total Households | 48 (100.0%) | 2.06 |
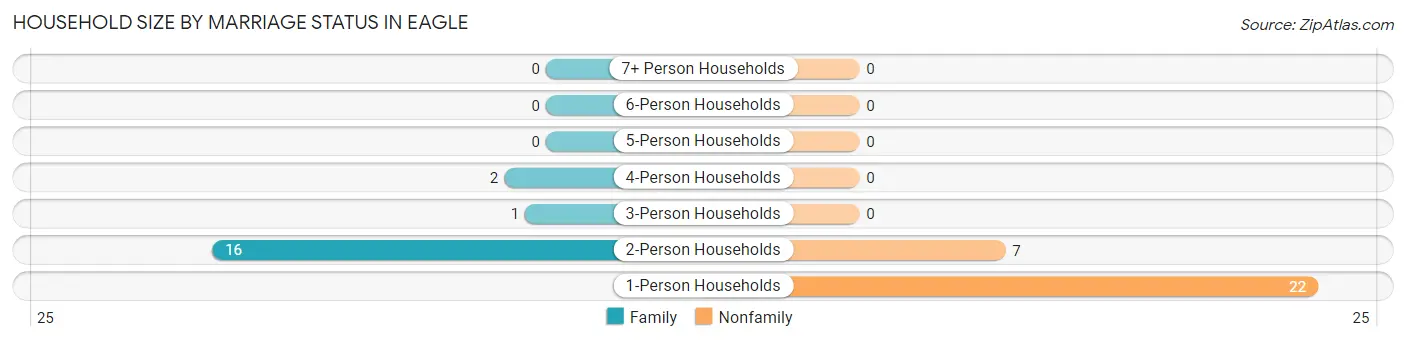
Household Size by Marriage Status in Eagle
Out of a total of 48 households in Eagle, 19 (39.6%) are family households, while 29 (60.4%) are nonfamily households. The most numerous type of family households are 2-person households, comprising 16, and the most common type of nonfamily households are 1-person households, comprising 22.
| Household Size | Family Households | Nonfamily Households |
| 1-Person Households | - | 22 (45.8%) |
| 2-Person Households | 16 (33.3%) | 7 (14.6%) |
| 3-Person Households | 1 (2.1%) | 0 (0.0%) |
| 4-Person Households | 2 (4.2%) | 0 (0.0%) |
| 5-Person Households | 0 (0.0%) | 0 (0.0%) |
| 6-Person Households | 0 (0.0%) | 0 (0.0%) |
| 7+ Person Households | 0 (0.0%) | 0 (0.0%) |
| Total | 19 (39.6%) | 29 (60.4%) |
Female Fertility in Eagle
Fertility by Age in Eagle
| Age Bracket | Women with Births | Births / 1,000 Women |
| 15 to 19 years | 0 (0.0%) | 0.0 |
| 20 to 34 years | 0 (0.0%) | 0.0 |
| 35 to 50 years | 0 (0.0%) | 0.0 |
| Total | 0 (0.0%) | 0.0 |
Fertility by Age by Marriage Status in Eagle
| Age Bracket | Married | Unmarried |
| 15 to 19 years | 0 (0.0%) | 0 (0.0%) |
| 20 to 34 years | 0 (0.0%) | 0 (0.0%) |
| 35 to 50 years | 0 (0.0%) | 0 (0.0%) |
| Total | 0 (0.0%) | 0 (0.0%) |
Fertility by Education in Eagle
| Educational Attainment | Women with Births | Births / 1,000 Women |
| Less than High School | 0 (0.0%) | 0.0 |
| High School Diploma | 0 (0.0%) | 0.0 |
| College or Associate's Degree | 0 (0.0%) | 0.0 |
| Bachelor's Degree | 0 (0.0%) | 0.0 |
| Graduate Degree | 0 (0.0%) | 0.0 |
| Total | 0 (0.0%) | 0.0 |
Fertility by Education by Marriage Status in Eagle
| Educational Attainment | Married | Unmarried |
| Less than High School | 0 (0.0%) | 0 (0.0%) |
| High School Diploma | 0 (0.0%) | 0 (0.0%) |
| College or Associate's Degree | 0 (0.0%) | 0 (0.0%) |
| Bachelor's Degree | 0 (0.0%) | 0 (0.0%) |
| Graduate Degree | 0 (0.0%) | 0 (0.0%) |
| Total | 0 (0.0%) | 0 (0.0%) |
Employment Characteristics in Eagle
Employment by Class of Employer in Eagle
Among the 26 employed individuals in Eagle, state government employees (13 | 50.0%), self-employed (not incorporated) (9 | 34.6%), and private company employees (2 | 7.7%) make up the most common classes of employment.
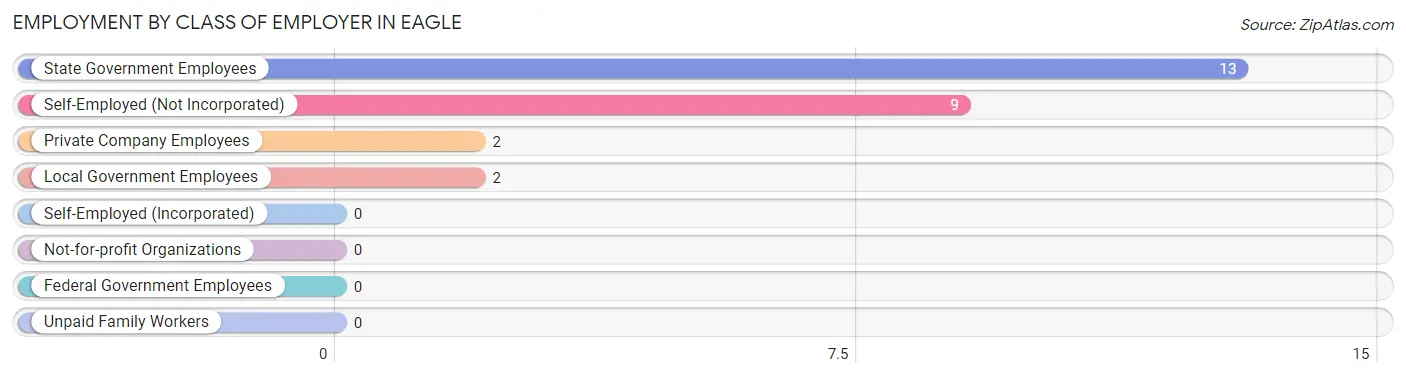
| Employer Class | # Employees | % Employees |
| Private Company Employees | 2 | 7.7% |
| Self-Employed (Incorporated) | 0 | 0.0% |
| Self-Employed (Not Incorporated) | 9 | 34.6% |
| Not-for-profit Organizations | 0 | 0.0% |
| Local Government Employees | 2 | 7.7% |
| State Government Employees | 13 | 50.0% |
| Federal Government Employees | 0 | 0.0% |
| Unpaid Family Workers | 0 | 0.0% |
| Total | 26 | 100.0% |
Employment Status by Age in Eagle
According to the labor force statistics for Eagle, out of the total population over 16 years of age (99), 42.4% or 42 individuals are in the labor force, with 35.7% or 15 of them unemployed. The age group with the highest labor force participation rate is 25 to 29 years, with 100.0% or 3 individuals in the labor force. Within the labor force, the 35 to 44 years age range has the highest percentage of unemployed individuals, with 100.0% or 3 of them being unemployed.
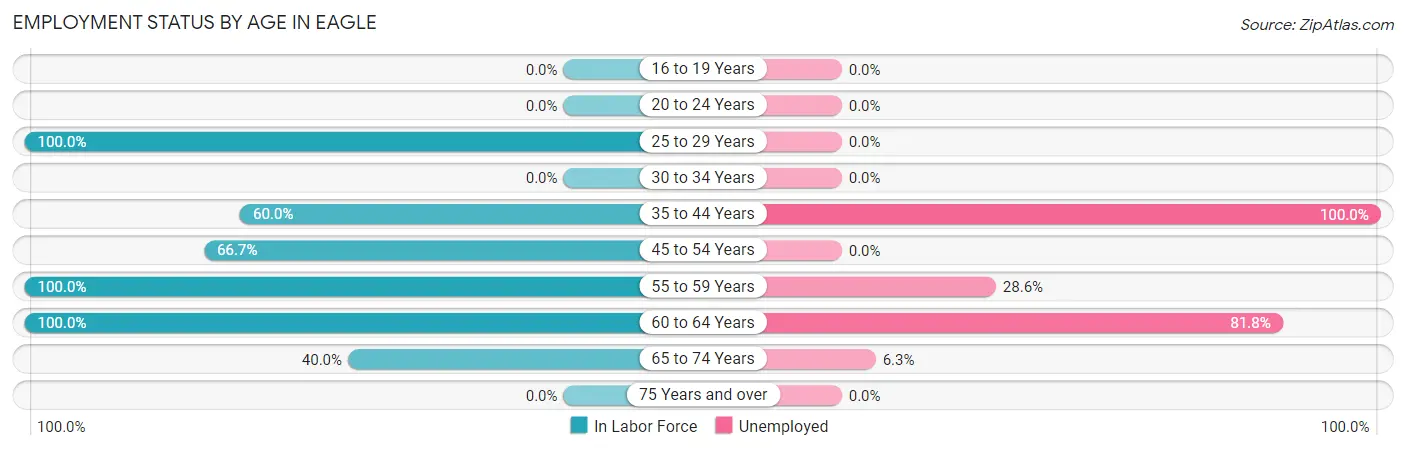
| Age Bracket | In Labor Force | Unemployed |
| 16 to 19 Years | 0 (0.0%) | 0 (0.0%) |
| 20 to 24 Years | 0 (0.0%) | 0 (0.0%) |
| 25 to 29 Years | 3 (100.0%) | 0 (0.0%) |
| 30 to 34 Years | 0 (0.0%) | 0 (0.0%) |
| 35 to 44 Years | 3 (60.0%) | 3 (100.0%) |
| 45 to 54 Years | 2 (66.7%) | 0 (0.0%) |
| 55 to 59 Years | 7 (100.0%) | 2 (28.6%) |
| 60 to 64 Years | 11 (100.0%) | 9 (81.8%) |
| 65 to 74 Years | 16 (40.0%) | 1 (6.3%) |
| 75 Years and over | 0 (0.0%) | 0 (0.0%) |
| Total | 42 (42.4%) | 15 (35.7%) |
Employment Status by Educational Attainment in Eagle
According to labor force statistics for Eagle, 89.7% of individuals (26) out of the total population between 25 and 64 years of age (29) are in the labor force, with 53.8% or 14 of them being unemployed. The group with the highest labor force participation rate are those with the educational attainment of college / associate degree, with 100.0% or 13 individuals in the labor force. Within the labor force, individuals with college / associate degree education have the highest percentage of unemployment, with 69.2% or 9 of them being unemployed.
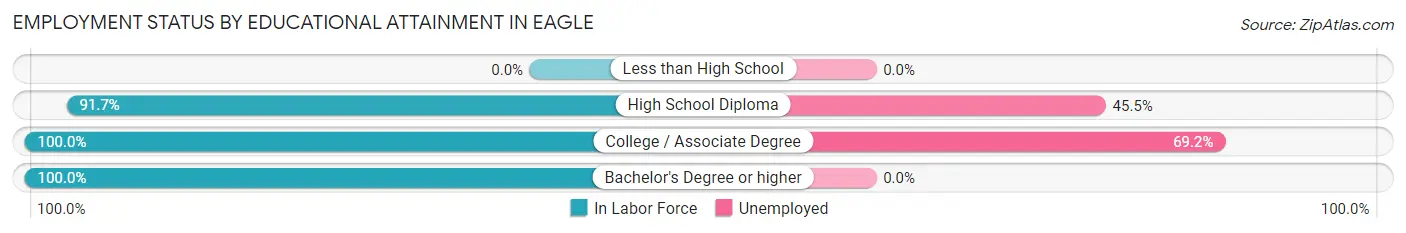
| Educational Attainment | In Labor Force | Unemployed |
| Less than High School | 0 (0.0%) | 0 (0.0%) |
| High School Diploma | 11 (91.7%) | 5 (45.5%) |
| College / Associate Degree | 13 (100.0%) | 9 (69.2%) |
| Bachelor's Degree or higher | 2 (100.0%) | 0 (0.0%) |
| Total | 26 (89.7%) | 16 (53.8%) |
Employment Occupations by Sex in Eagle
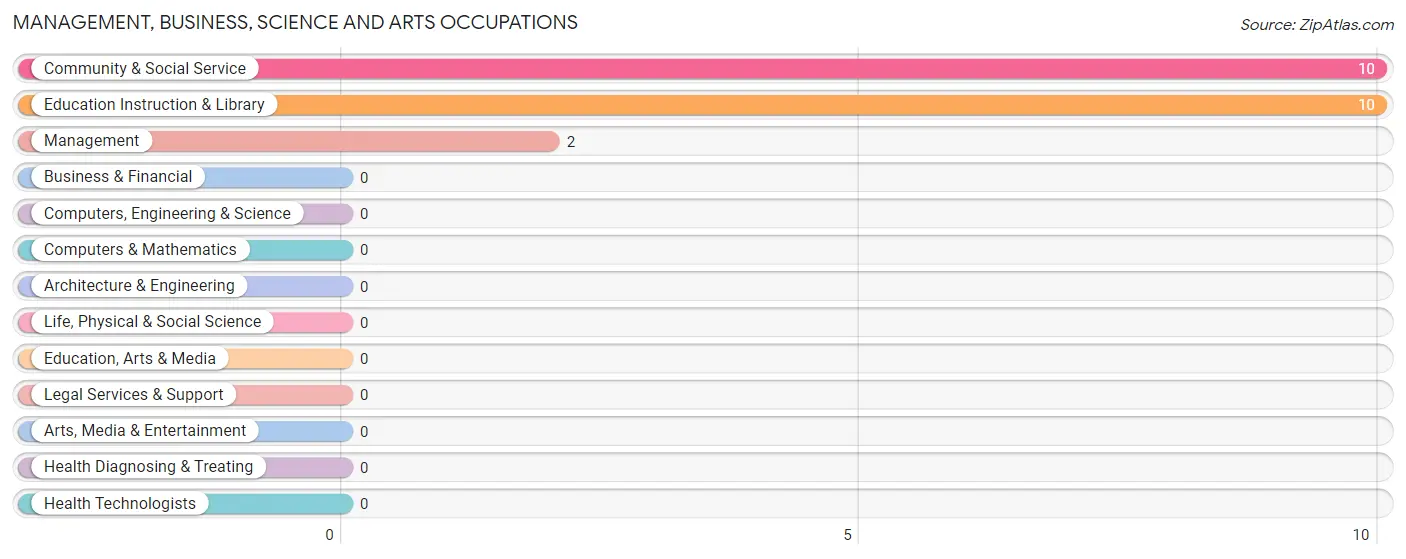
Management, Business, Science and Arts Occupations
The most common Management, Business, Science and Arts occupations in Eagle are Community & Social Service (10 | 37.0%), Education Instruction & Library (10 | 37.0%), and Management (2 | 7.4%).
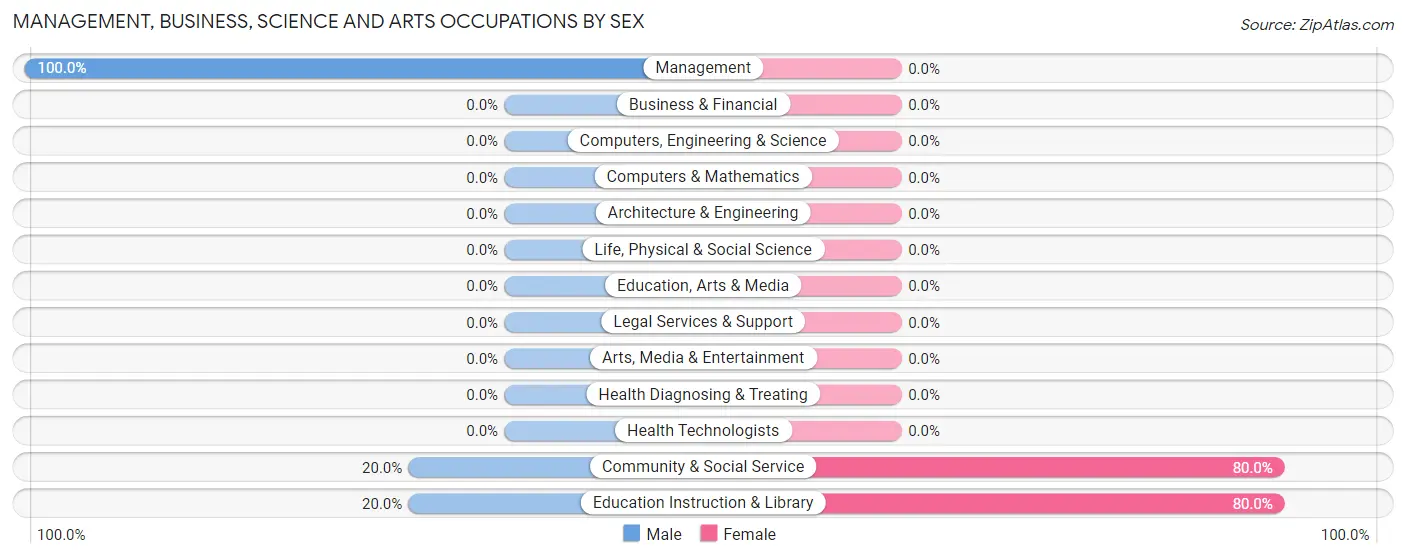
Management, Business, Science and Arts Occupations by Sex
Within the Management, Business, Science and Arts occupations in Eagle, the most male-oriented occupations are Management (100.0%), Community & Social Service (20.0%), and Education Instruction & Library (20.0%), while the most female-oriented occupations are Community & Social Service (80.0%), and Education Instruction & Library (80.0%).
| Occupation | Male | Female |
| Management | 2 (100.0%) | 0 (0.0%) |
| Business & Financial | 0 (0.0%) | 0 (0.0%) |
| Computers, Engineering & Science | 0 (0.0%) | 0 (0.0%) |
| Computers & Mathematics | 0 (0.0%) | 0 (0.0%) |
| Architecture & Engineering | 0 (0.0%) | 0 (0.0%) |
| Life, Physical & Social Science | 0 (0.0%) | 0 (0.0%) |
| Community & Social Service | 2 (20.0%) | 8 (80.0%) |
| Education, Arts & Media | 0 (0.0%) | 0 (0.0%) |
| Legal Services & Support | 0 (0.0%) | 0 (0.0%) |
| Education Instruction & Library | 2 (20.0%) | 8 (80.0%) |
| Arts, Media & Entertainment | 0 (0.0%) | 0 (0.0%) |
| Health Diagnosing & Treating | 0 (0.0%) | 0 (0.0%) |
| Health Technologists | 0 (0.0%) | 0 (0.0%) |
| Total (Category) | 4 (33.3%) | 8 (66.7%) |
| Total (Overall) | 16 (59.3%) | 11 (40.7%) |
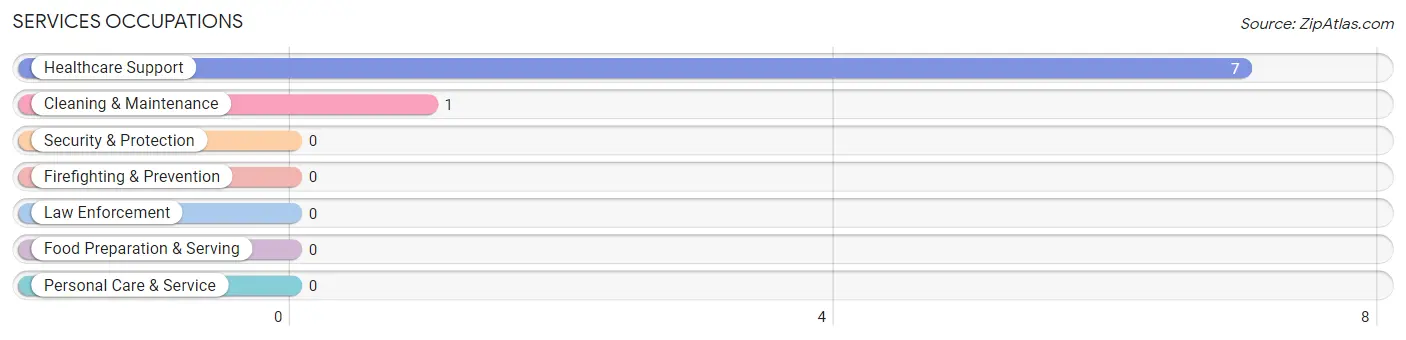
Services Occupations
The most common Services occupations in Eagle are Healthcare Support (7 | 25.9%), and Cleaning & Maintenance (1 | 3.7%).
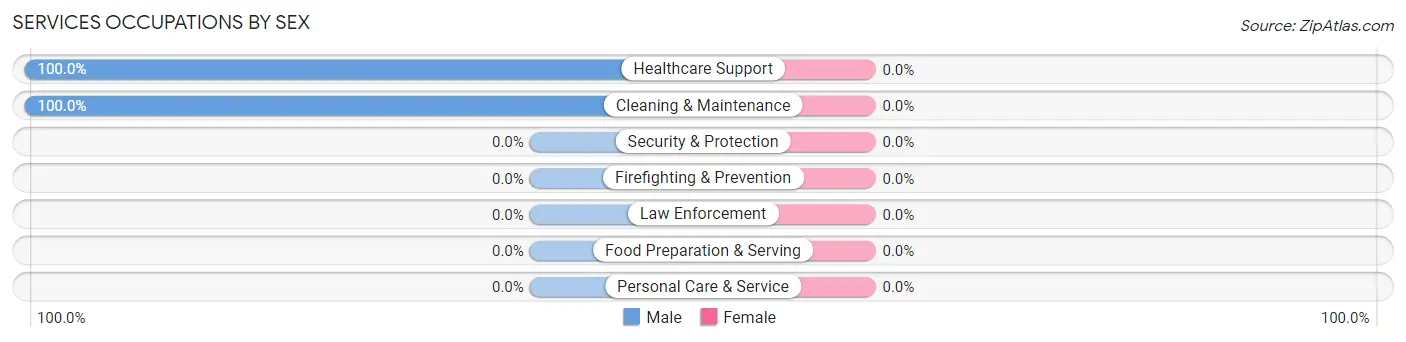
Services Occupations by Sex
| Occupation | Male | Female |
| Healthcare Support | 7 (100.0%) | 0 (0.0%) |
| Security & Protection | 0 (0.0%) | 0 (0.0%) |
| Firefighting & Prevention | 0 (0.0%) | 0 (0.0%) |
| Law Enforcement | 0 (0.0%) | 0 (0.0%) |
| Food Preparation & Serving | 0 (0.0%) | 0 (0.0%) |
| Cleaning & Maintenance | 1 (100.0%) | 0 (0.0%) |
| Personal Care & Service | 0 (0.0%) | 0 (0.0%) |
| Total (Category) | 8 (100.0%) | 0 (0.0%) |
| Total (Overall) | 16 (59.3%) | 11 (40.7%) |
Sales and Office Occupations
Sales and Office Occupations by Sex
| Occupation | Male | Female |
| Sales & Related | 0 (0.0%) | 0 (0.0%) |
| Office & Administration | 0 (0.0%) | 0 (0.0%) |
| Total (Category) | 0 (0.0%) | 0 (0.0%) |
| Total (Overall) | 16 (59.3%) | 11 (40.7%) |
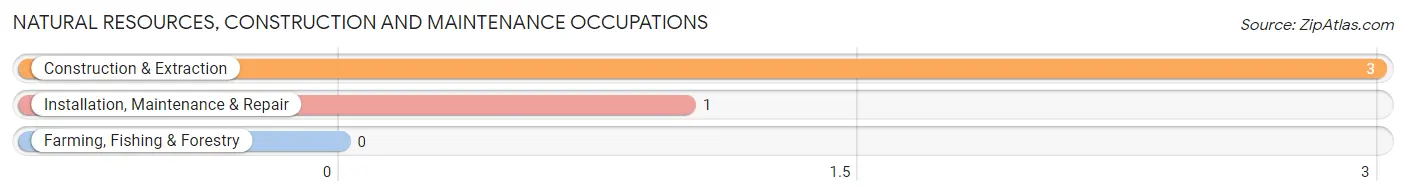
Natural Resources, Construction and Maintenance Occupations
The most common Natural Resources, Construction and Maintenance occupations in Eagle are Construction & Extraction (3 | 11.1%), and Installation, Maintenance & Repair (1 | 3.7%).
Natural Resources, Construction and Maintenance Occupations by Sex
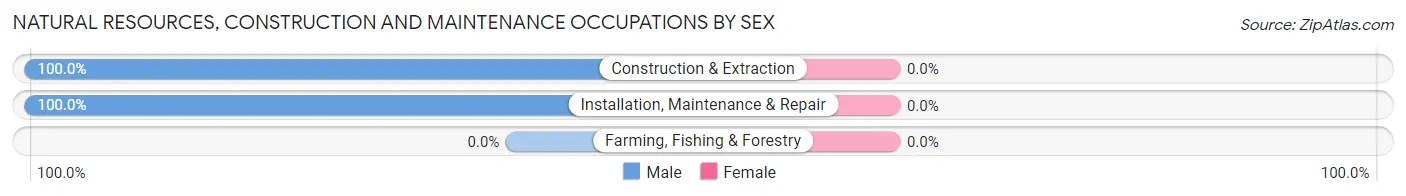
| Occupation | Male | Female |
| Farming, Fishing & Forestry | 0 (0.0%) | 0 (0.0%) |
| Construction & Extraction | 3 (100.0%) | 0 (0.0%) |
| Installation, Maintenance & Repair | 1 (100.0%) | 0 (0.0%) |
| Total (Category) | 4 (100.0%) | 0 (0.0%) |
| Total (Overall) | 16 (59.3%) | 11 (40.7%) |
Production, Transportation and Moving Occupations
The most common Production, Transportation and Moving occupations in Eagle are Transportation (2 | 7.4%), and Material Moving (1 | 3.7%).
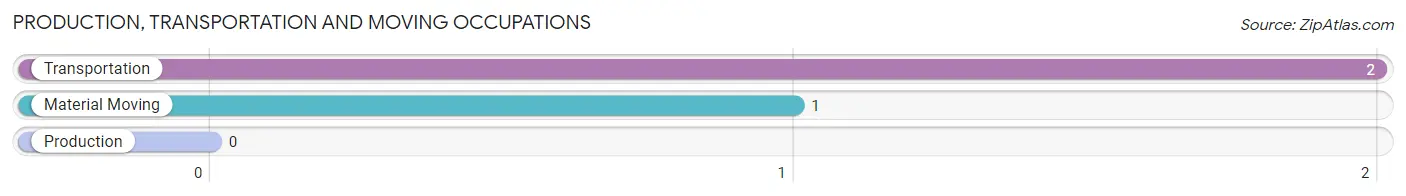
Production, Transportation and Moving Occupations by Sex
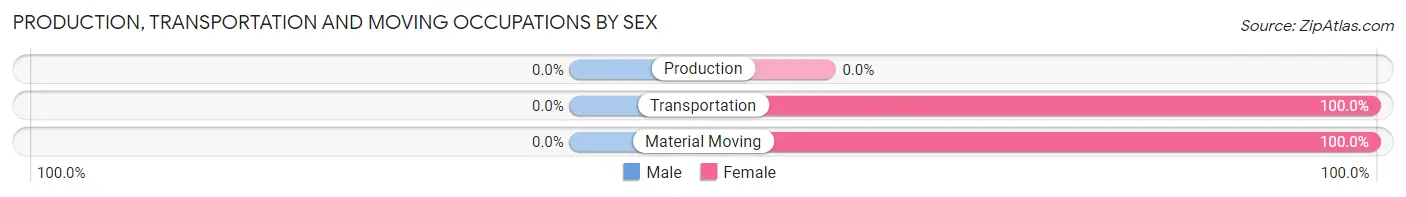
| Occupation | Male | Female |
| Production | 0 (0.0%) | 0 (0.0%) |
| Transportation | 0 (0.0%) | 2 (100.0%) |
| Material Moving | 0 (0.0%) | 1 (100.0%) |
| Total (Category) | 0 (0.0%) | 3 (100.0%) |
| Total (Overall) | 16 (59.3%) | 11 (40.7%) |
Employment Industries by Sex in Eagle
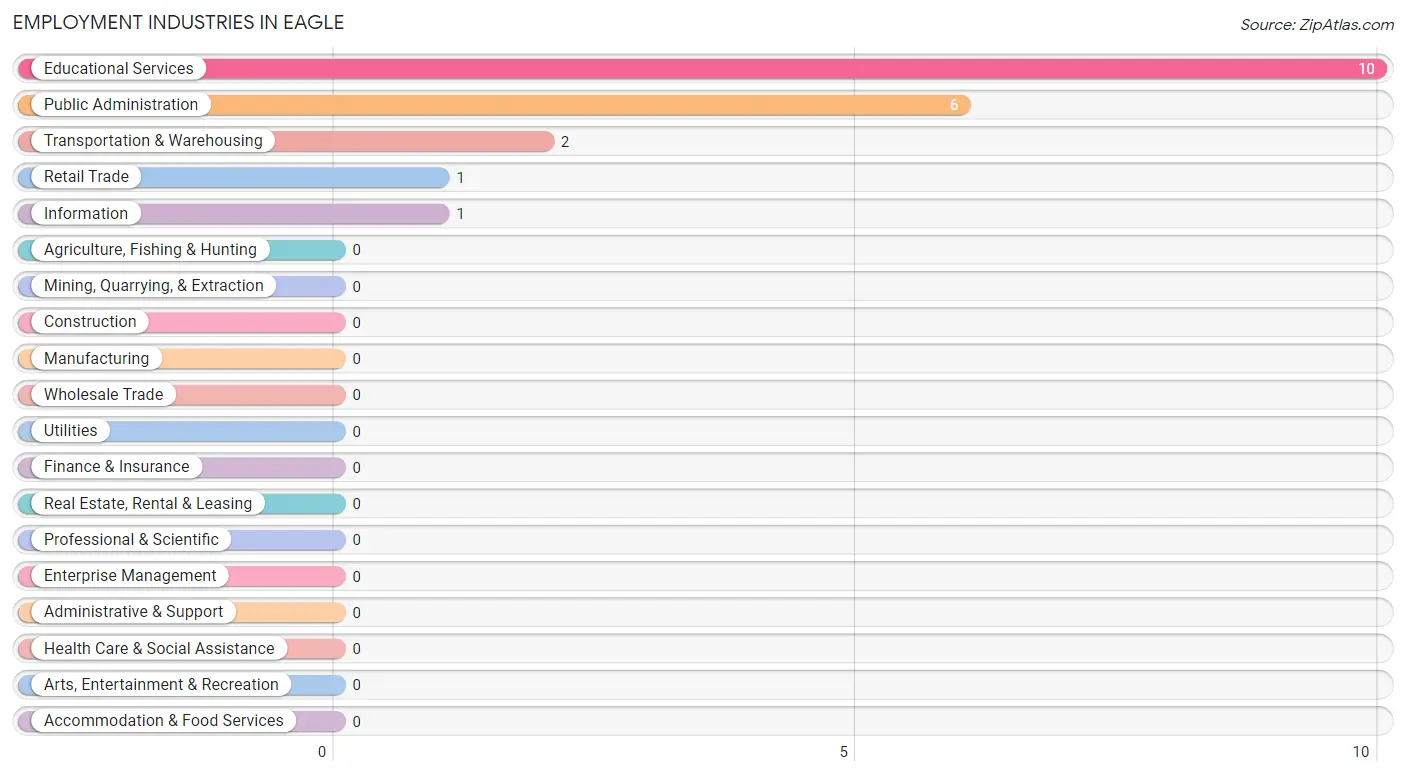
Employment Industries in Eagle
The major employment industries in Eagle include Educational Services (10 | 37.0%), Public Administration (6 | 22.2%), Transportation & Warehousing (2 | 7.4%), Retail Trade (1 | 3.7%), and Information (1 | 3.7%).
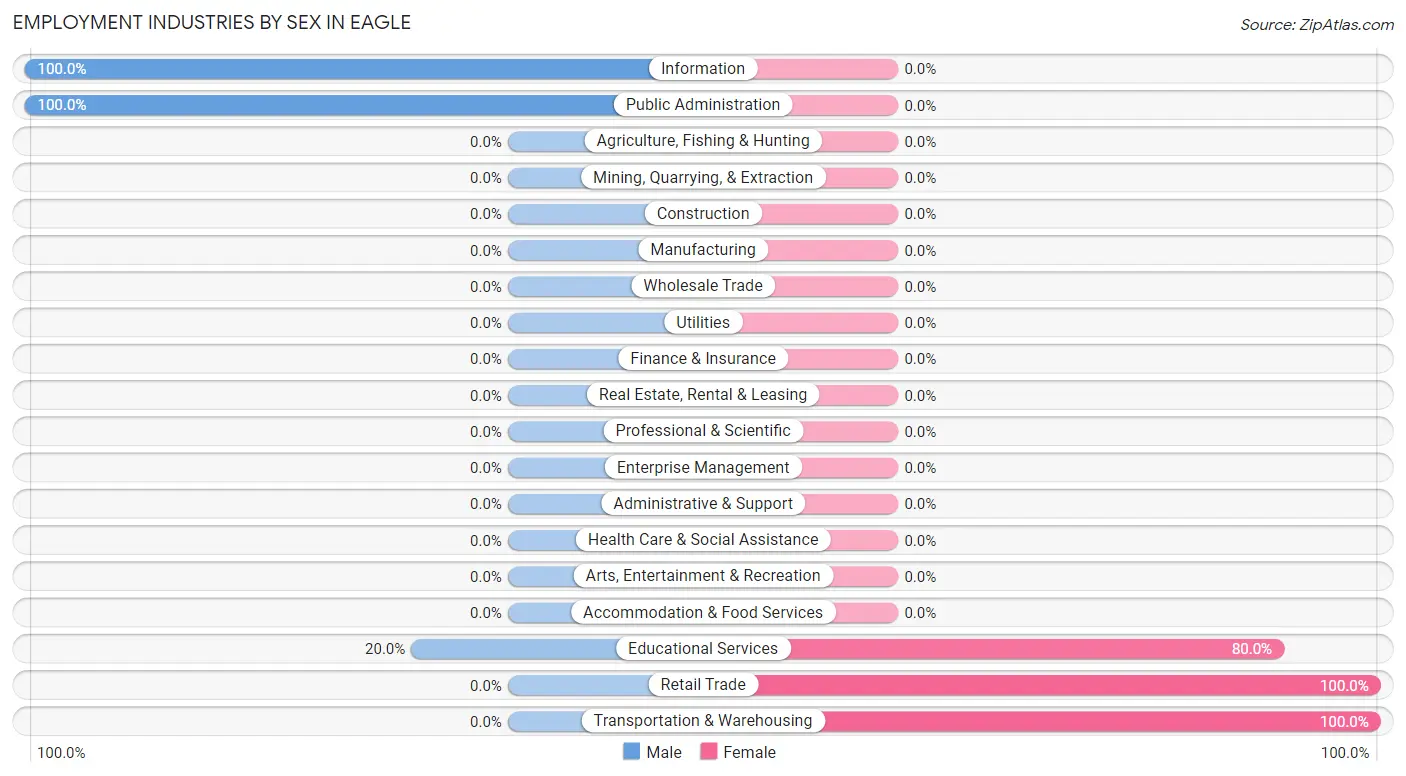
Employment Industries by Sex in Eagle
The Eagle industries that see more men than women are Information (100.0%), Public Administration (100.0%), and Educational Services (20.0%), whereas the industries that tend to have a higher number of women are Retail Trade (100.0%), Transportation & Warehousing (100.0%), and Educational Services (80.0%).
| Industry | Male | Female |
| Agriculture, Fishing & Hunting | 0 (0.0%) | 0 (0.0%) |
| Mining, Quarrying, & Extraction | 0 (0.0%) | 0 (0.0%) |
| Construction | 0 (0.0%) | 0 (0.0%) |
| Manufacturing | 0 (0.0%) | 0 (0.0%) |
| Wholesale Trade | 0 (0.0%) | 0 (0.0%) |
| Retail Trade | 0 (0.0%) | 1 (100.0%) |
| Transportation & Warehousing | 0 (0.0%) | 2 (100.0%) |
| Utilities | 0 (0.0%) | 0 (0.0%) |
| Information | 1 (100.0%) | 0 (0.0%) |
| Finance & Insurance | 0 (0.0%) | 0 (0.0%) |
| Real Estate, Rental & Leasing | 0 (0.0%) | 0 (0.0%) |
| Professional & Scientific | 0 (0.0%) | 0 (0.0%) |
| Enterprise Management | 0 (0.0%) | 0 (0.0%) |
| Administrative & Support | 0 (0.0%) | 0 (0.0%) |
| Educational Services | 2 (20.0%) | 8 (80.0%) |
| Health Care & Social Assistance | 0 (0.0%) | 0 (0.0%) |
| Arts, Entertainment & Recreation | 0 (0.0%) | 0 (0.0%) |
| Accommodation & Food Services | 0 (0.0%) | 0 (0.0%) |
| Public Administration | 6 (100.0%) | 0 (0.0%) |
| Total | 16 (59.3%) | 11 (40.7%) |
Education in Eagle
School Enrollment in Eagle
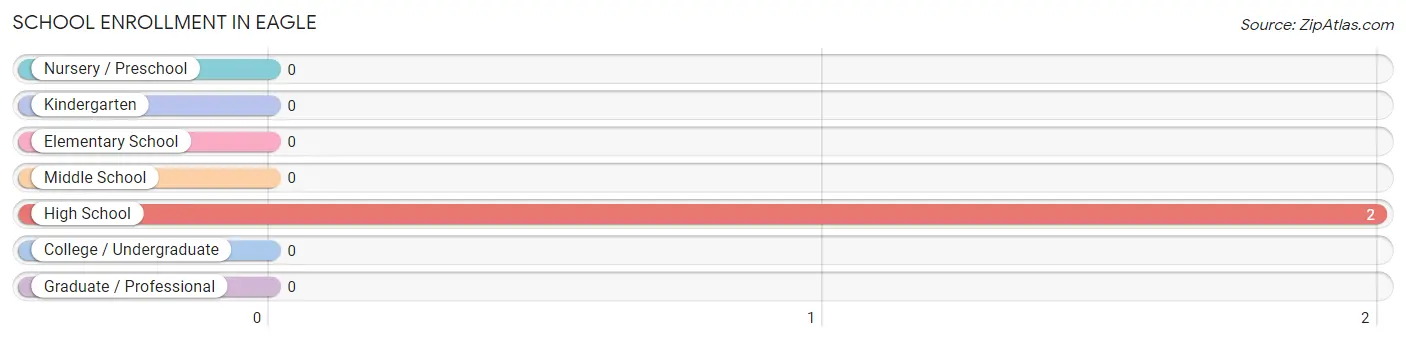
| School Level | # Students | % Students |
| Nursery / Preschool | 0 | 0.0% |
| Kindergarten | 0 | 0.0% |
| Elementary School | 0 | 0.0% |
| Middle School | 0 | 0.0% |
| High School | 2 | 100.0% |
| College / Undergraduate | 0 | 0.0% |
| Graduate / Professional | 0 | 0.0% |
| Total | 2 | 100.0% |
School Enrollment by Age by Funding Source in Eagle
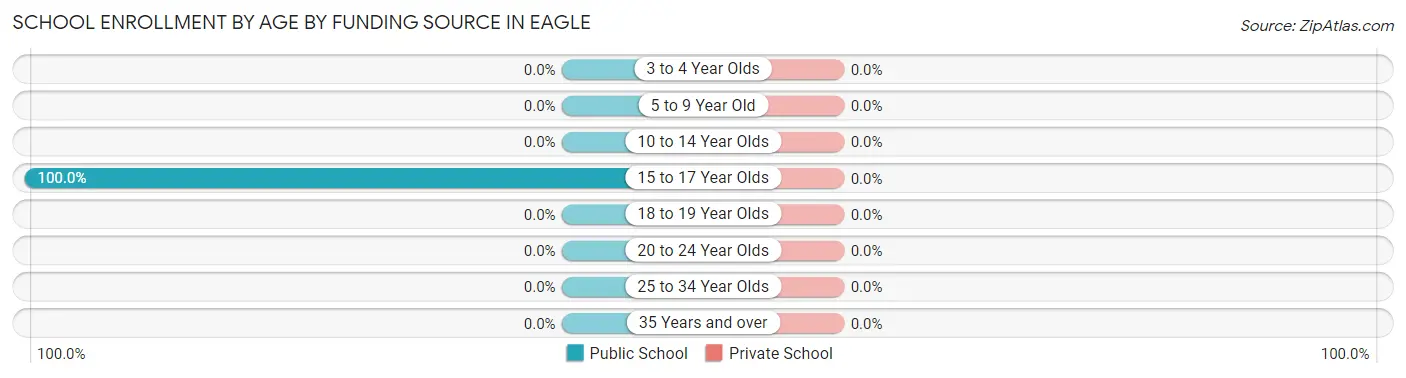
| Age Bracket | Public School | Private School |
| 3 to 4 Year Olds | 0 (0.0%) | 0 (0.0%) |
| 5 to 9 Year Old | 0 (0.0%) | 0 (0.0%) |
| 10 to 14 Year Olds | 0 (0.0%) | 0 (0.0%) |
| 15 to 17 Year Olds | 2 (100.0%) | 0 (0.0%) |
| 18 to 19 Year Olds | 0 (0.0%) | 0 (0.0%) |
| 20 to 24 Year Olds | 0 (0.0%) | 0 (0.0%) |
| 25 to 34 Year Olds | 0 (0.0%) | 0 (0.0%) |
| 35 Years and over | 0 (0.0%) | 0 (0.0%) |
| Total | 2 (100.0%) | 0 (0.0%) |
Educational Attainment by Field of Study in Eagle
Education (4 | 36.4%), bio, nature & agricultural (3 | 27.3%), literature & languages (2 | 18.2%), and liberal arts & history (2 | 18.2%) are the most common fields of study among 11 individuals in Eagle who have obtained a bachelor's degree or higher.
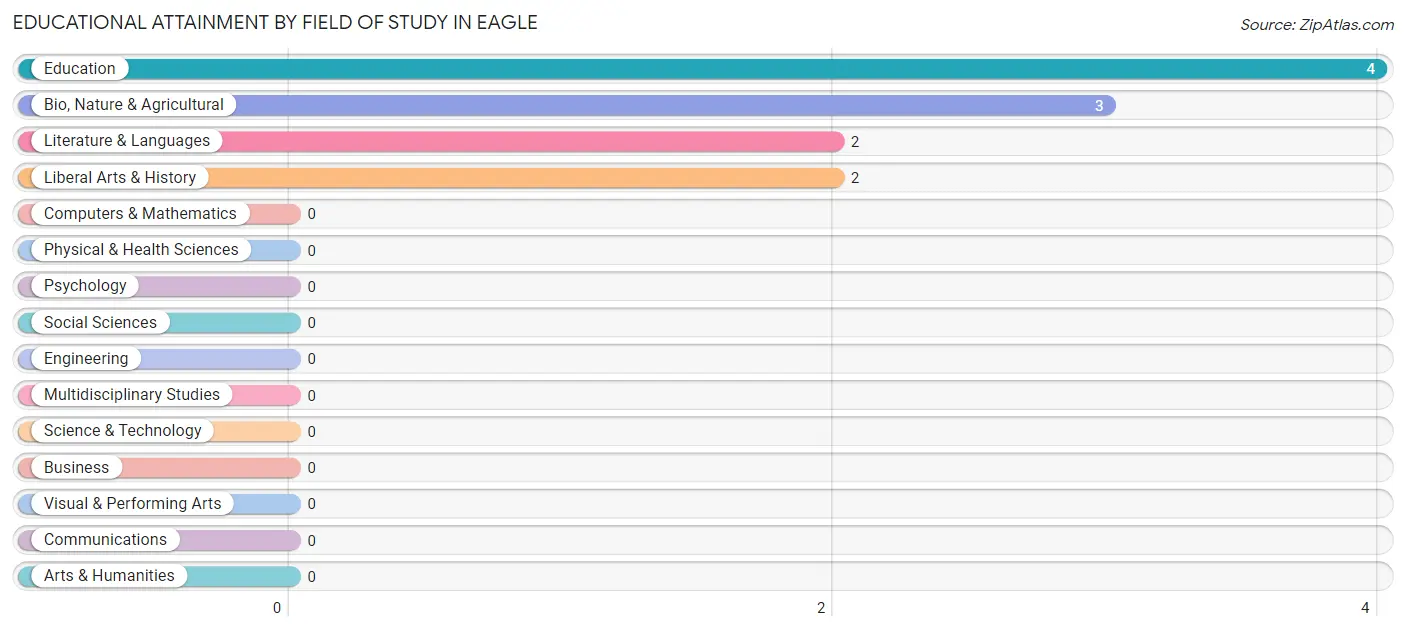
| Field of Study | # Graduates | % Graduates |
| Computers & Mathematics | 0 | 0.0% |
| Bio, Nature & Agricultural | 3 | 27.3% |
| Physical & Health Sciences | 0 | 0.0% |
| Psychology | 0 | 0.0% |
| Social Sciences | 0 | 0.0% |
| Engineering | 0 | 0.0% |
| Multidisciplinary Studies | 0 | 0.0% |
| Science & Technology | 0 | 0.0% |
| Business | 0 | 0.0% |
| Education | 4 | 36.4% |
| Literature & Languages | 2 | 18.2% |
| Liberal Arts & History | 2 | 18.2% |
| Visual & Performing Arts | 0 | 0.0% |
| Communications | 0 | 0.0% |
| Arts & Humanities | 0 | 0.0% |
| Total | 11 | 100.0% |
Transportation & Commute in Eagle
Vehicle Availability by Sex in Eagle
The most prevalent vehicle ownership categories in Eagle are males with 3 vehicles (9, accounting for 60.0%) and females with 3 vehicles (2, making up 81.8%).
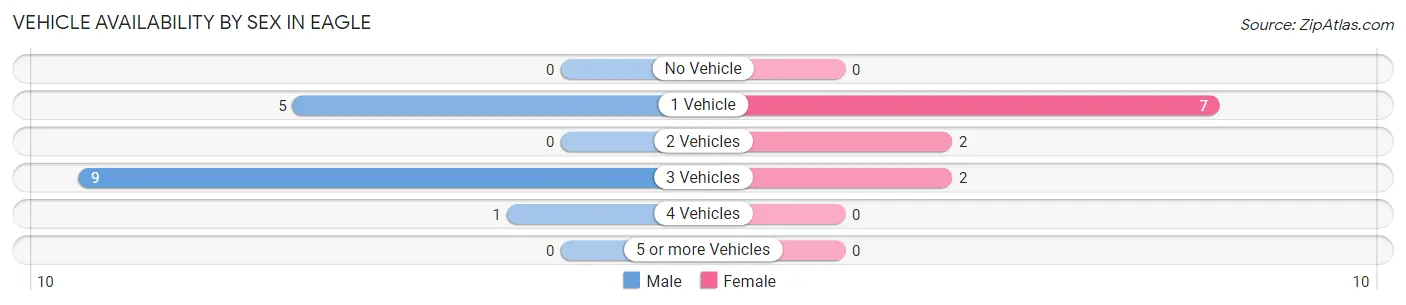
| Vehicles Available | Male | Female |
| No Vehicle | 0 (0.0%) | 0 (0.0%) |
| 1 Vehicle | 5 (33.3%) | 7 (63.6%) |
| 2 Vehicles | 0 (0.0%) | 2 (18.2%) |
| 3 Vehicles | 9 (60.0%) | 2 (18.2%) |
| 4 Vehicles | 1 (6.7%) | 0 (0.0%) |
| 5 or more Vehicles | 0 (0.0%) | 0 (0.0%) |
| Total | 15 (100.0%) | 11 (100.0%) |
Commute Time in Eagle
The most frequently occuring commute durations in Eagle are 10 to 14 minutes (7 commuters, 36.8%), less than 5 minutes (6 commuters, 31.6%), and 5 to 9 minutes (6 commuters, 31.6%).
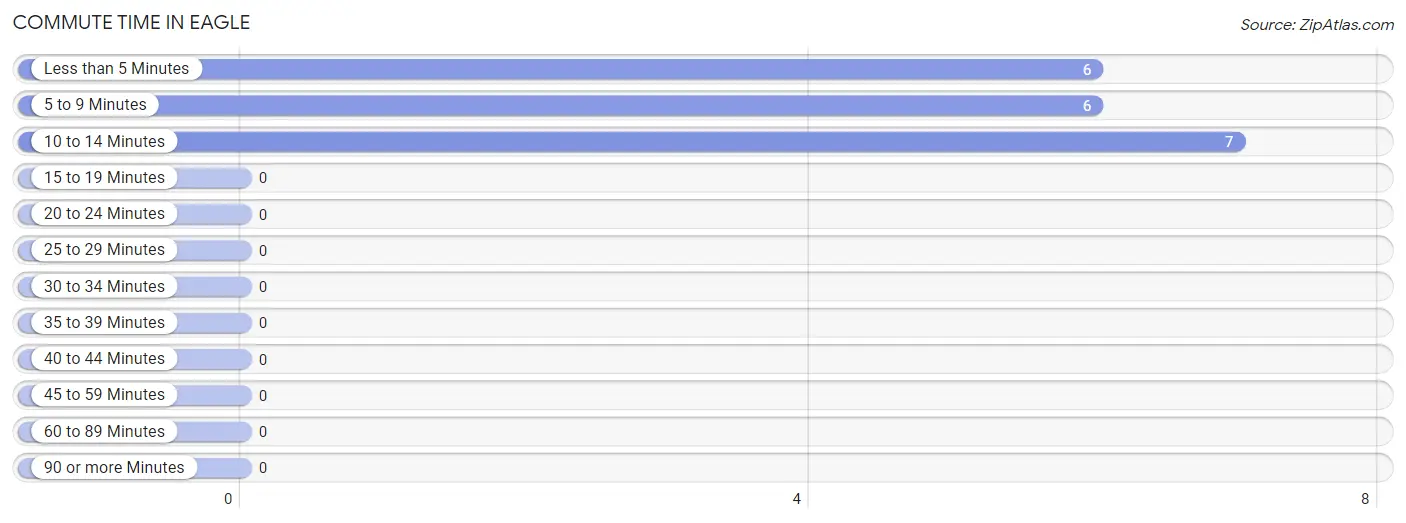
| Commute Time | # Commuters | % Commuters |
| Less than 5 Minutes | 6 | 31.6% |
| 5 to 9 Minutes | 6 | 31.6% |
| 10 to 14 Minutes | 7 | 36.8% |
| 15 to 19 Minutes | 0 | 0.0% |
| 20 to 24 Minutes | 0 | 0.0% |
| 25 to 29 Minutes | 0 | 0.0% |
| 30 to 34 Minutes | 0 | 0.0% |
| 35 to 39 Minutes | 0 | 0.0% |
| 40 to 44 Minutes | 0 | 0.0% |
| 45 to 59 Minutes | 0 | 0.0% |
| 60 to 89 Minutes | 0 | 0.0% |
| 90 or more Minutes | 0 | 0.0% |
Commute Time by Sex in Eagle
The most common commute times in Eagle are less than 5 minutes (4 commuters, 50.0%) for males and 10 to 14 minutes (5 commuters, 45.5%) for females.
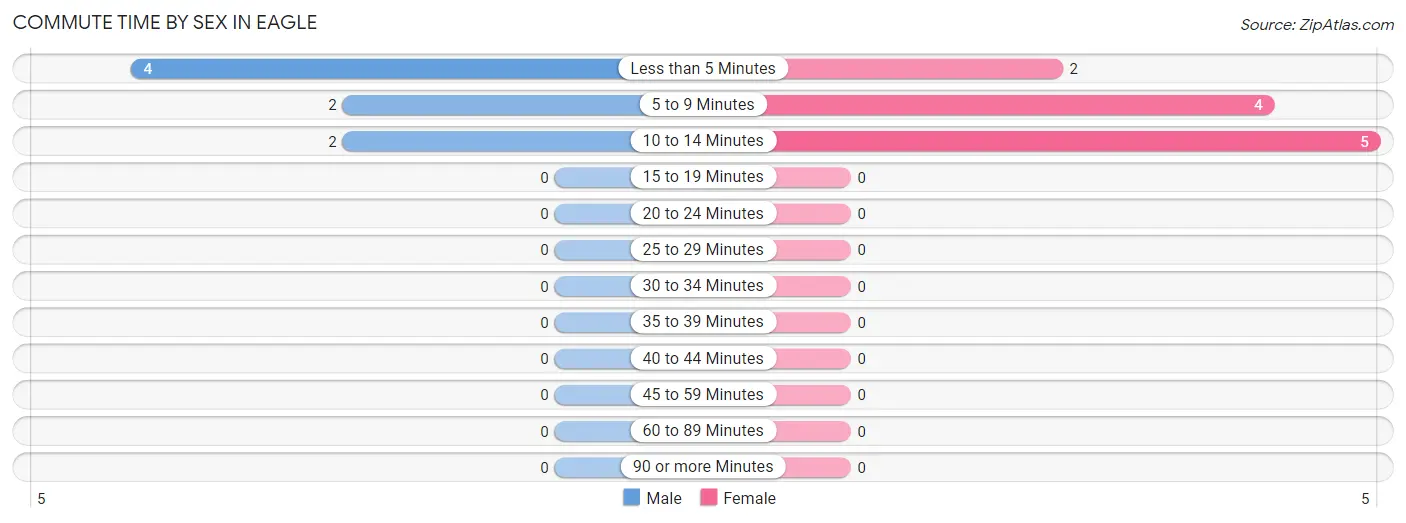
| Commute Time | Male | Female |
| Less than 5 Minutes | 4 (50.0%) | 2 (18.2%) |
| 5 to 9 Minutes | 2 (25.0%) | 4 (36.4%) |
| 10 to 14 Minutes | 2 (25.0%) | 5 (45.5%) |
| 15 to 19 Minutes | 0 (0.0%) | 0 (0.0%) |
| 20 to 24 Minutes | 0 (0.0%) | 0 (0.0%) |
| 25 to 29 Minutes | 0 (0.0%) | 0 (0.0%) |
| 30 to 34 Minutes | 0 (0.0%) | 0 (0.0%) |
| 35 to 39 Minutes | 0 (0.0%) | 0 (0.0%) |
| 40 to 44 Minutes | 0 (0.0%) | 0 (0.0%) |
| 45 to 59 Minutes | 0 (0.0%) | 0 (0.0%) |
| 60 to 89 Minutes | 0 (0.0%) | 0 (0.0%) |
| 90 or more Minutes | 0 (0.0%) | 0 (0.0%) |
Time of Departure to Work by Sex in Eagle
The most frequent times of departure to work in Eagle are 6:30 AM to 6:59 AM (4, 50.0%) for males and 8:00 AM to 8:29 AM (4, 36.4%) for females.
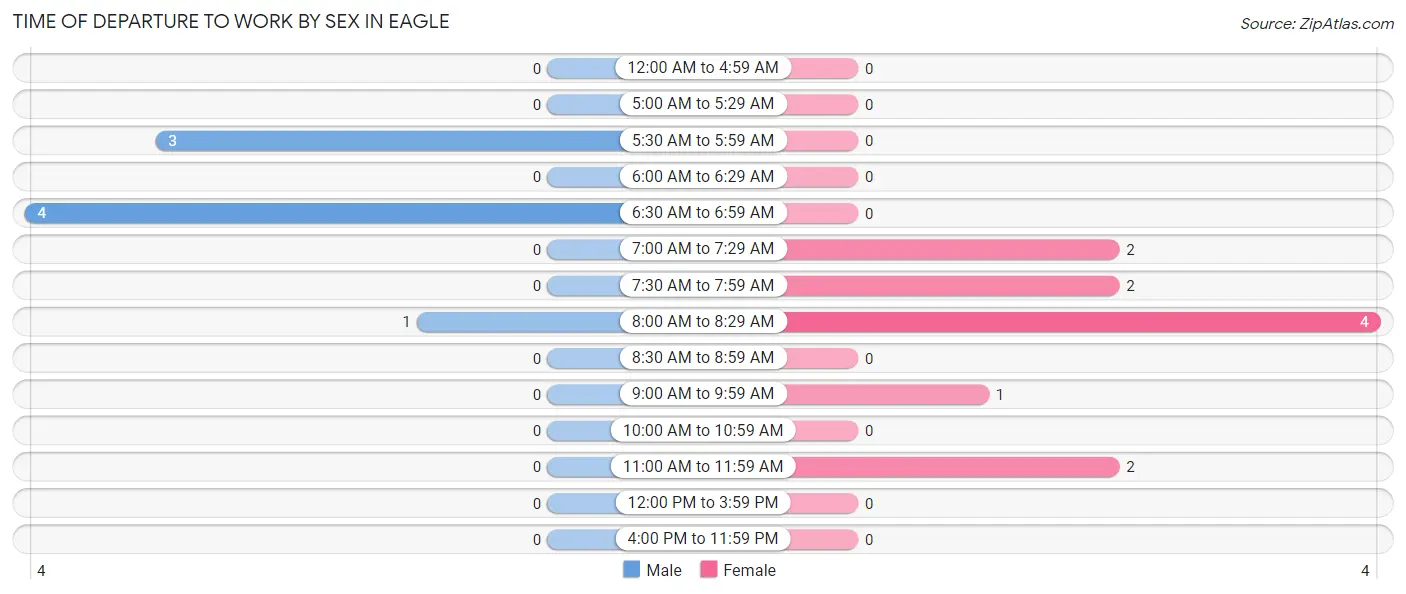
| Time of Departure | Male | Female |
| 12:00 AM to 4:59 AM | 0 (0.0%) | 0 (0.0%) |
| 5:00 AM to 5:29 AM | 0 (0.0%) | 0 (0.0%) |
| 5:30 AM to 5:59 AM | 3 (37.5%) | 0 (0.0%) |
| 6:00 AM to 6:29 AM | 0 (0.0%) | 0 (0.0%) |
| 6:30 AM to 6:59 AM | 4 (50.0%) | 0 (0.0%) |
| 7:00 AM to 7:29 AM | 0 (0.0%) | 2 (18.2%) |
| 7:30 AM to 7:59 AM | 0 (0.0%) | 2 (18.2%) |
| 8:00 AM to 8:29 AM | 1 (12.5%) | 4 (36.4%) |
| 8:30 AM to 8:59 AM | 0 (0.0%) | 0 (0.0%) |
| 9:00 AM to 9:59 AM | 0 (0.0%) | 1 (9.1%) |
| 10:00 AM to 10:59 AM | 0 (0.0%) | 0 (0.0%) |
| 11:00 AM to 11:59 AM | 0 (0.0%) | 2 (18.2%) |
| 12:00 PM to 3:59 PM | 0 (0.0%) | 0 (0.0%) |
| 4:00 PM to 11:59 PM | 0 (0.0%) | 0 (0.0%) |
| Total | 8 (100.0%) | 11 (100.0%) |
Housing Occupancy in Eagle
Occupancy by Ownership in Eagle
Of the total 48 dwellings in Eagle, owner-occupied units account for 38 (79.2%), while renter-occupied units make up 10 (20.8%).
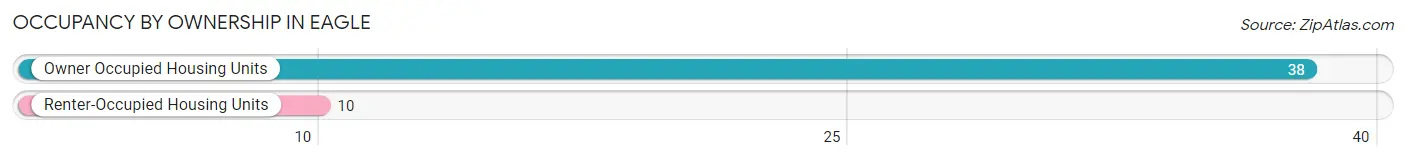
| Occupancy | # Housing Units | % Housing Units |
| Owner Occupied Housing Units | 38 | 79.2% |
| Renter-Occupied Housing Units | 10 | 20.8% |
| Total Occupied Housing Units | 48 | 100.0% |
Occupancy by Household Size in Eagle
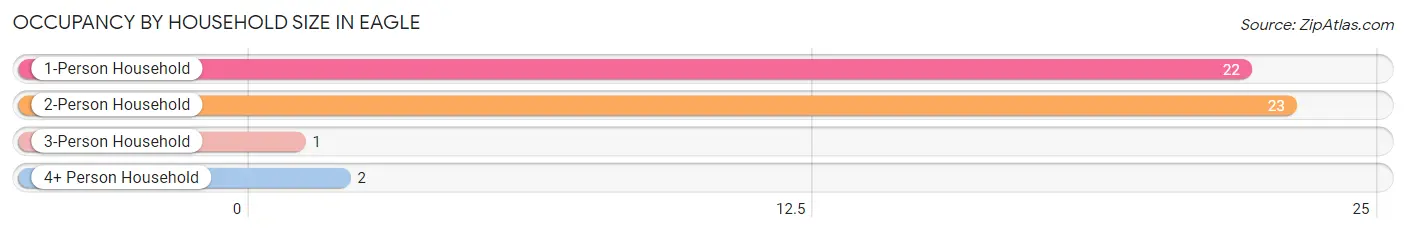
| Household Size | # Housing Units | % Housing Units |
| 1-Person Household | 22 | 45.8% |
| 2-Person Household | 23 | 47.9% |
| 3-Person Household | 1 | 2.1% |
| 4+ Person Household | 2 | 4.2% |
| Total Housing Units | 48 | 100.0% |
Occupancy by Ownership by Household Size in Eagle
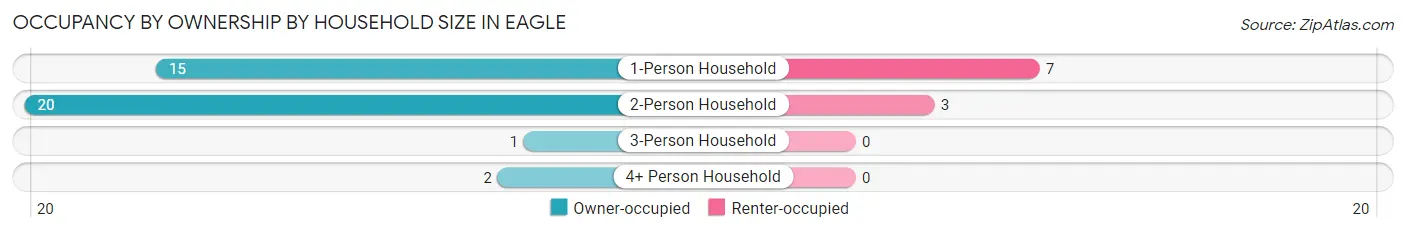
| Household Size | Owner-occupied | Renter-occupied |
| 1-Person Household | 15 (68.2%) | 7 (31.8%) |
| 2-Person Household | 20 (87.0%) | 3 (13.0%) |
| 3-Person Household | 1 (100.0%) | 0 (0.0%) |
| 4+ Person Household | 2 (100.0%) | 0 (0.0%) |
| Total Housing Units | 38 (79.2%) | 10 (20.8%) |
Occupancy by Educational Attainment in Eagle
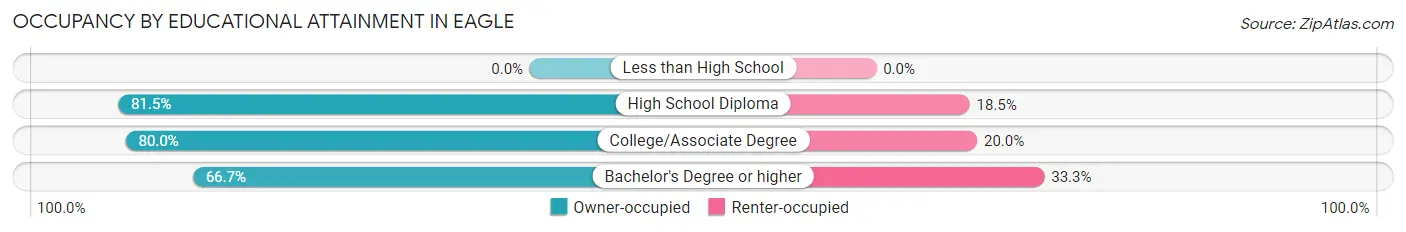
| Household Size | Owner-occupied | Renter-occupied |
| Less than High School | 0 (0.0%) | 0 (0.0%) |
| High School Diploma | 22 (81.5%) | 5 (18.5%) |
| College/Associate Degree | 12 (80.0%) | 3 (20.0%) |
| Bachelor's Degree or higher | 4 (66.7%) | 2 (33.3%) |
Occupancy by Age of Householder in Eagle
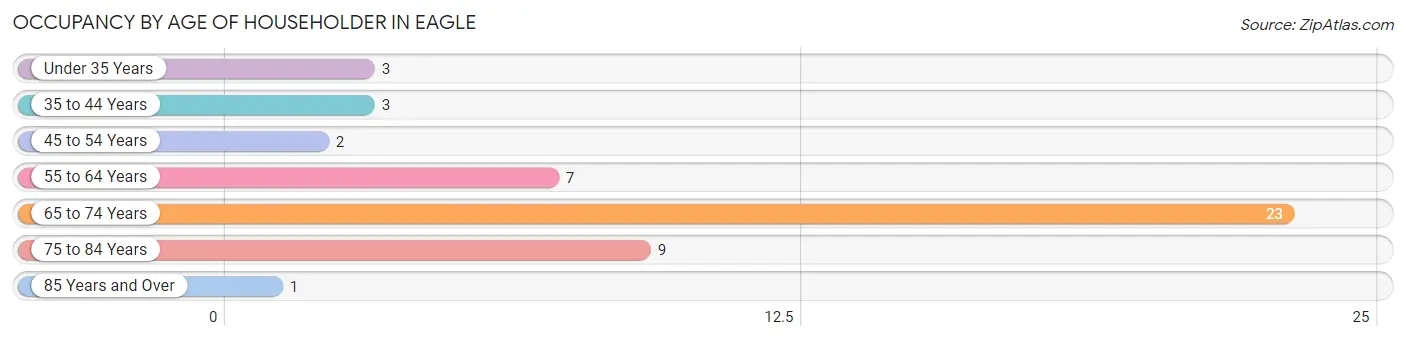
| Age Bracket | # Households | % Households |
| Under 35 Years | 3 | 6.2% |
| 35 to 44 Years | 3 | 6.2% |
| 45 to 54 Years | 2 | 4.2% |
| 55 to 64 Years | 7 | 14.6% |
| 65 to 74 Years | 23 | 47.9% |
| 75 to 84 Years | 9 | 18.8% |
| 85 Years and Over | 1 | 2.1% |
| Total | 48 | 100.0% |
Housing Finances in Eagle
Median Income by Occupancy in Eagle
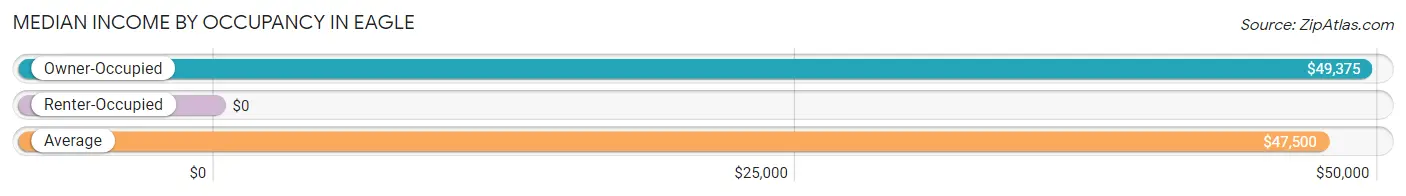
| Occupancy Type | # Households | Median Income |
| Owner-Occupied | 38 (79.2%) | $49,375 |
| Renter-Occupied | 10 (20.8%) | $0 |
| Average | 48 (100.0%) | $47,500 |
Occupancy by Householder Income Bracket in Eagle
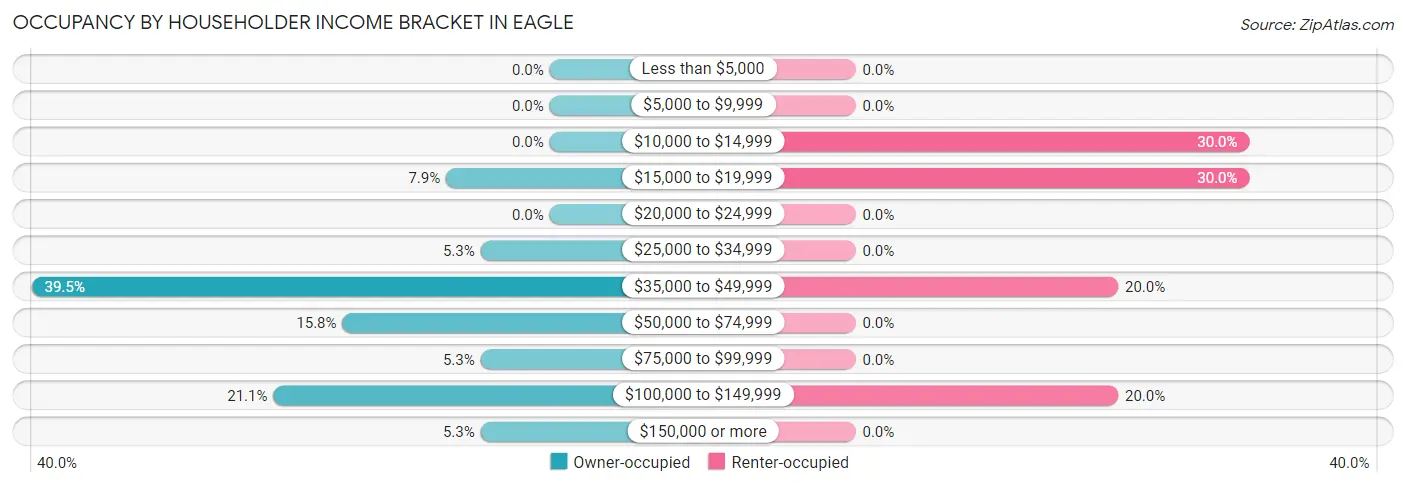
| Income Bracket | Owner-occupied | Renter-occupied |
| Less than $5,000 | 0 (0.0%) | 0 (0.0%) |
| $5,000 to $9,999 | 0 (0.0%) | 0 (0.0%) |
| $10,000 to $14,999 | 0 (0.0%) | 3 (30.0%) |
| $15,000 to $19,999 | 3 (7.9%) | 3 (30.0%) |
| $20,000 to $24,999 | 0 (0.0%) | 0 (0.0%) |
| $25,000 to $34,999 | 2 (5.3%) | 0 (0.0%) |
| $35,000 to $49,999 | 15 (39.5%) | 2 (20.0%) |
| $50,000 to $74,999 | 6 (15.8%) | 0 (0.0%) |
| $75,000 to $99,999 | 2 (5.3%) | 0 (0.0%) |
| $100,000 to $149,999 | 8 (21.0%) | 2 (20.0%) |
| $150,000 or more | 2 (5.3%) | 0 (0.0%) |
| Total | 38 (100.0%) | 10 (100.0%) |
Monthly Housing Cost Tiers in Eagle
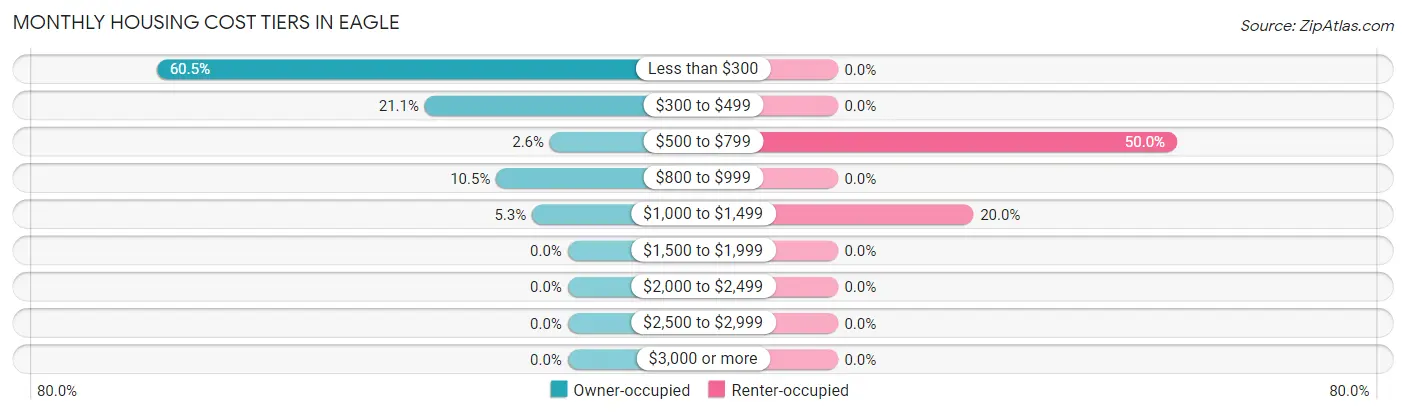
| Monthly Cost | Owner-occupied | Renter-occupied |
| Less than $300 | 23 (60.5%) | 0 (0.0%) |
| $300 to $499 | 8 (21.0%) | 0 (0.0%) |
| $500 to $799 | 1 (2.6%) | 5 (50.0%) |
| $800 to $999 | 4 (10.5%) | 0 (0.0%) |
| $1,000 to $1,499 | 2 (5.3%) | 2 (20.0%) |
| $1,500 to $1,999 | 0 (0.0%) | 0 (0.0%) |
| $2,000 to $2,499 | 0 (0.0%) | 0 (0.0%) |
| $2,500 to $2,999 | 0 (0.0%) | 0 (0.0%) |
| $3,000 or more | 0 (0.0%) | 0 (0.0%) |
| Total | 38 (100.0%) | 10 (100.0%) |
Physical Housing Characteristics in Eagle
Housing Structures in Eagle
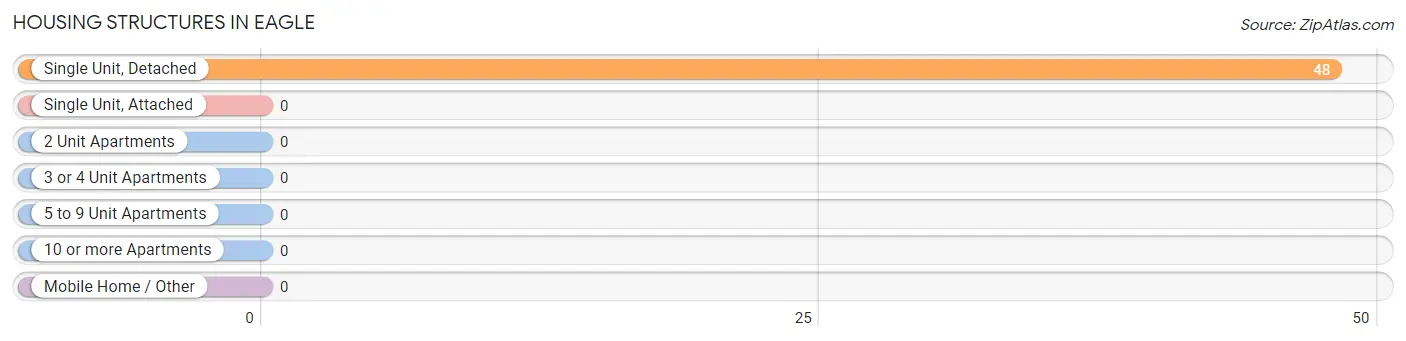
| Structure Type | # Housing Units | % Housing Units |
| Single Unit, Detached | 48 | 100.0% |
| Single Unit, Attached | 0 | 0.0% |
| 2 Unit Apartments | 0 | 0.0% |
| 3 or 4 Unit Apartments | 0 | 0.0% |
| 5 to 9 Unit Apartments | 0 | 0.0% |
| 10 or more Apartments | 0 | 0.0% |
| Mobile Home / Other | 0 | 0.0% |
| Total | 48 | 100.0% |
Housing Structures by Occupancy in Eagle
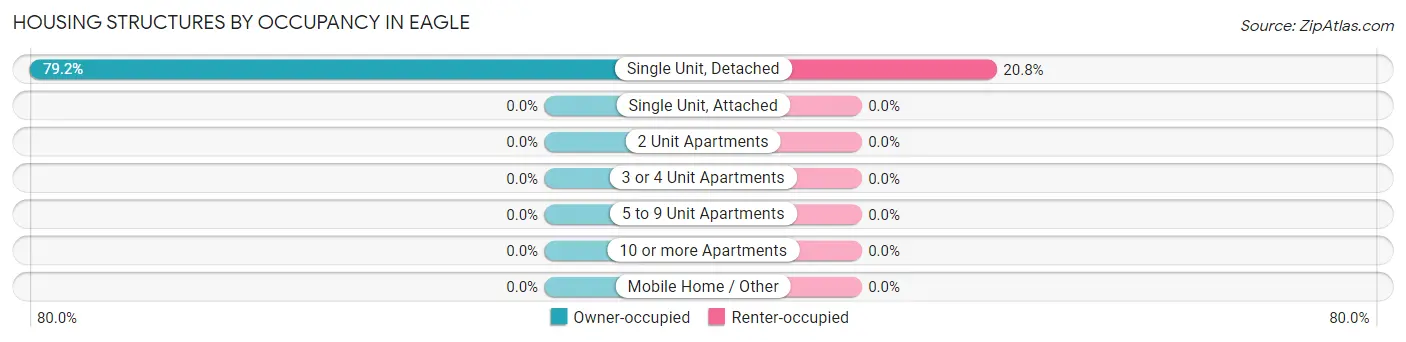
| Structure Type | Owner-occupied | Renter-occupied |
| Single Unit, Detached | 38 (79.2%) | 10 (20.8%) |
| Single Unit, Attached | 0 (0.0%) | 0 (0.0%) |
| 2 Unit Apartments | 0 (0.0%) | 0 (0.0%) |
| 3 or 4 Unit Apartments | 0 (0.0%) | 0 (0.0%) |
| 5 to 9 Unit Apartments | 0 (0.0%) | 0 (0.0%) |
| 10 or more Apartments | 0 (0.0%) | 0 (0.0%) |
| Mobile Home / Other | 0 (0.0%) | 0 (0.0%) |
| Total | 38 (79.2%) | 10 (20.8%) |
Housing Structures by Number of Rooms in Eagle
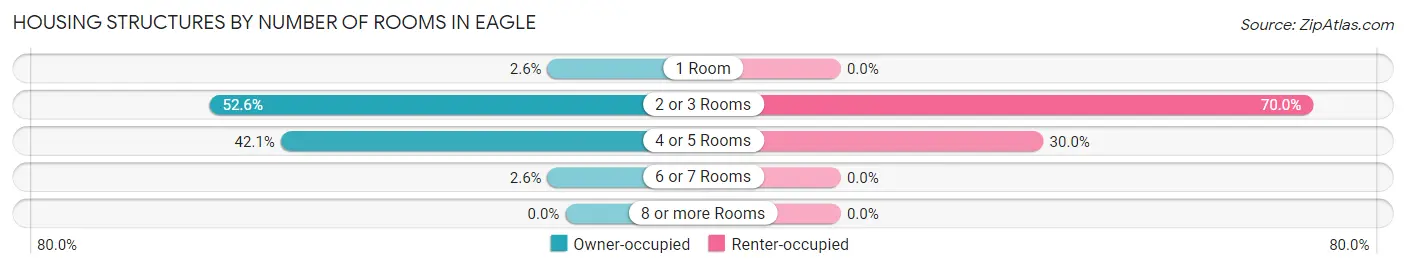
| Number of Rooms | Owner-occupied | Renter-occupied |
| 1 Room | 1 (2.6%) | 0 (0.0%) |
| 2 or 3 Rooms | 20 (52.6%) | 7 (70.0%) |
| 4 or 5 Rooms | 16 (42.1%) | 3 (30.0%) |
| 6 or 7 Rooms | 1 (2.6%) | 0 (0.0%) |
| 8 or more Rooms | 0 (0.0%) | 0 (0.0%) |
| Total | 38 (100.0%) | 10 (100.0%) |
Housing Structure by Heating Type in Eagle
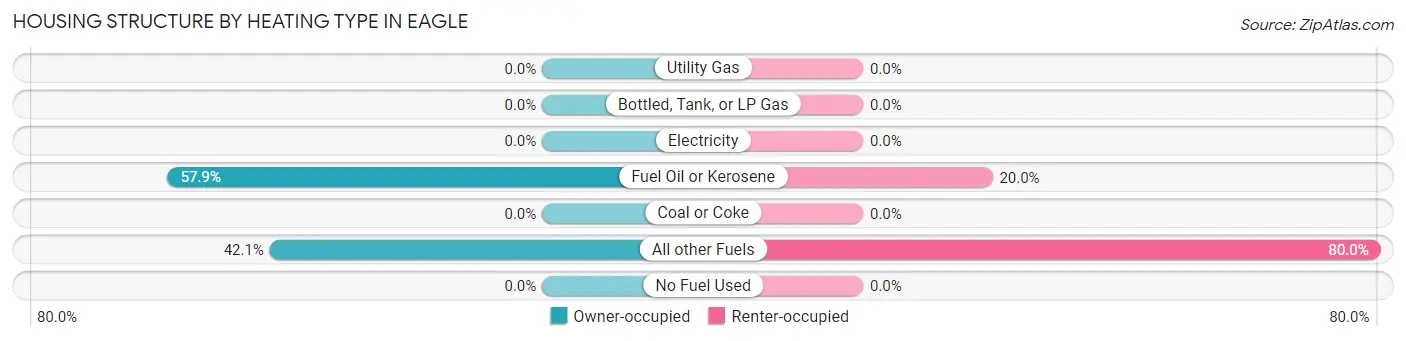
| Heating Type | Owner-occupied | Renter-occupied |
| Utility Gas | 0 (0.0%) | 0 (0.0%) |
| Bottled, Tank, or LP Gas | 0 (0.0%) | 0 (0.0%) |
| Electricity | 0 (0.0%) | 0 (0.0%) |
| Fuel Oil or Kerosene | 22 (57.9%) | 2 (20.0%) |
| Coal or Coke | 0 (0.0%) | 0 (0.0%) |
| All other Fuels | 16 (42.1%) | 8 (80.0%) |
| No Fuel Used | 0 (0.0%) | 0 (0.0%) |
| Total | 38 (100.0%) | 10 (100.0%) |
Household Vehicle Usage in Eagle
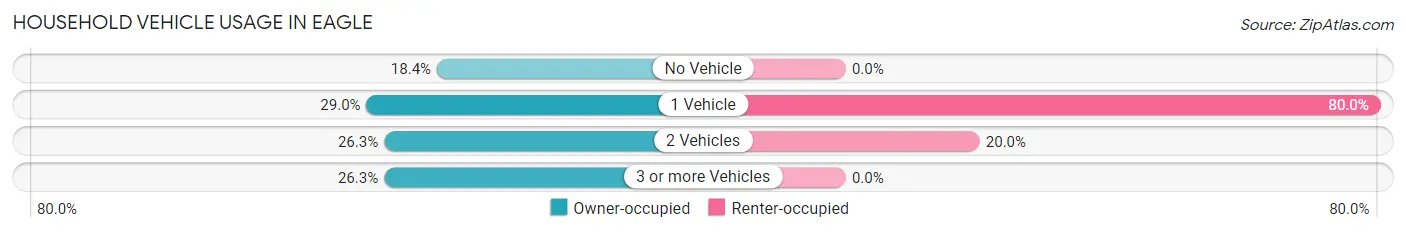
| Vehicles per Household | Owner-occupied | Renter-occupied |
| No Vehicle | 7 (18.4%) | 0 (0.0%) |
| 1 Vehicle | 11 (28.9%) | 8 (80.0%) |
| 2 Vehicles | 10 (26.3%) | 2 (20.0%) |
| 3 or more Vehicles | 10 (26.3%) | 0 (0.0%) |
| Total | 38 (100.0%) | 10 (100.0%) |
Real Estate & Mortgages in Eagle
Real Estate and Mortgage Overview in Eagle
| Characteristic | Without Mortgage | With Mortgage |
| Housing Units | 38 | 0 |
| Median Property Value | $48,300 | $0 |
| Median Household Income | $49,375 | $0 |
| Monthly Housing Costs | $271 | $0 |
| Real Estate Taxes | - | - |
Property Value by Mortgage Status in Eagle
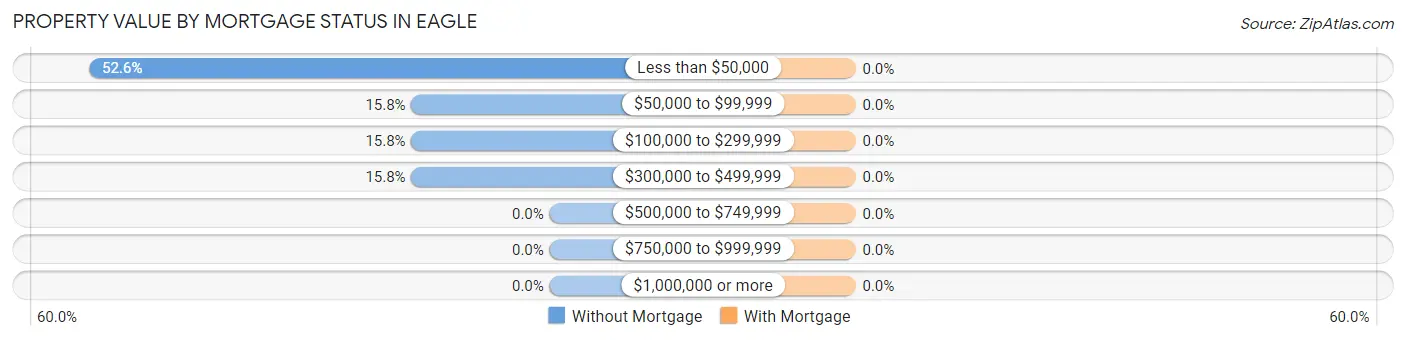
| Property Value | Without Mortgage | With Mortgage |
| Less than $50,000 | 20 (52.6%) | 0 (0.0%) |
| $50,000 to $99,999 | 6 (15.8%) | 0 (0.0%) |
| $100,000 to $299,999 | 6 (15.8%) | 0 (0.0%) |
| $300,000 to $499,999 | 6 (15.8%) | 0 (0.0%) |
| $500,000 to $749,999 | 0 (0.0%) | 0 (0.0%) |
| $750,000 to $999,999 | 0 (0.0%) | 0 (0.0%) |
| $1,000,000 or more | 0 (0.0%) | 0 (0.0%) |
| Total | 38 (100.0%) | 0 (0.0%) |
Household Income by Mortgage Status in Eagle
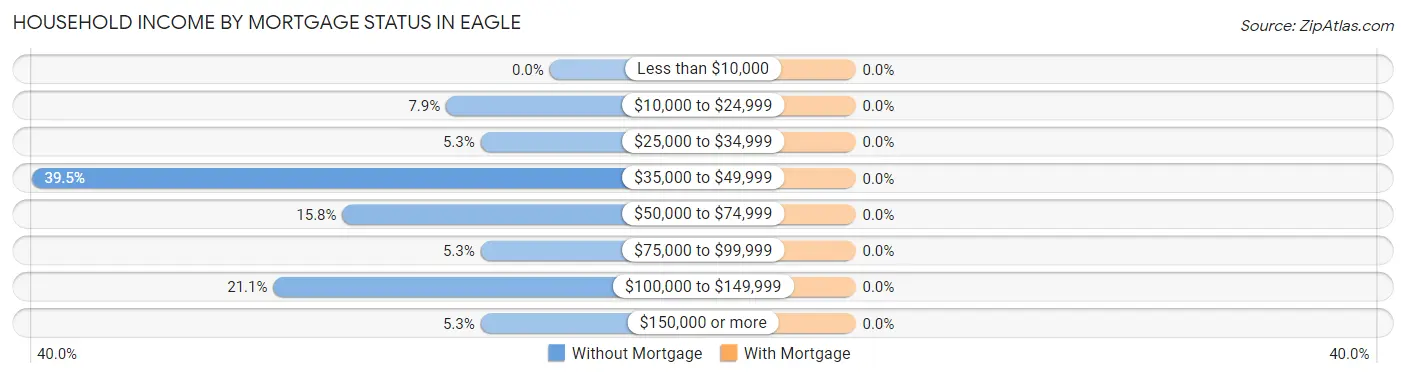
| Household Income | Without Mortgage | With Mortgage |
| Less than $10,000 | 0 (0.0%) | 0 (0.0%) |
| $10,000 to $24,999 | 3 (7.9%) | 0 (0.0%) |
| $25,000 to $34,999 | 2 (5.3%) | 0 (0.0%) |
| $35,000 to $49,999 | 15 (39.5%) | 0 (0.0%) |
| $50,000 to $74,999 | 6 (15.8%) | 0 (0.0%) |
| $75,000 to $99,999 | 2 (5.3%) | 0 (0.0%) |
| $100,000 to $149,999 | 8 (21.0%) | 0 (0.0%) |
| $150,000 or more | 2 (5.3%) | 0 (0.0%) |
| Total | 38 (100.0%) | 0 (0.0%) |
Property Value to Household Income Ratio in Eagle
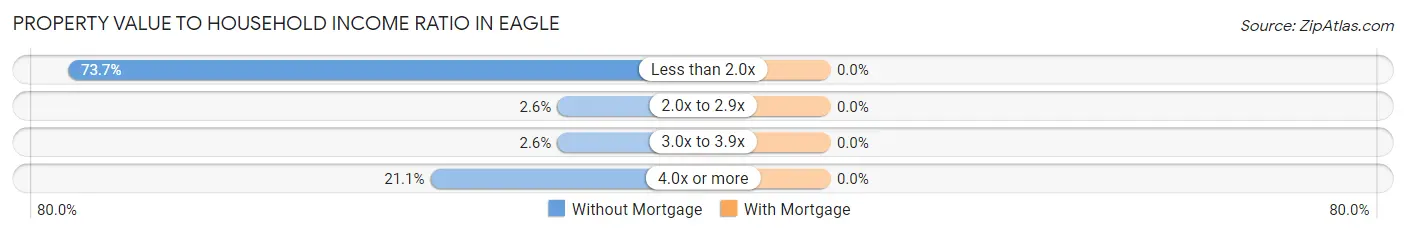
| Value-to-Income Ratio | Without Mortgage | With Mortgage |
| Less than 2.0x | 28 (73.7%) | 0 (0.0%) |
| 2.0x to 2.9x | 1 (2.6%) | 0 (0.0%) |
| 3.0x to 3.9x | 1 (2.6%) | 0 (0.0%) |
| 4.0x or more | 8 (21.0%) | 0 (0.0%) |
| Total | 38 (100.0%) | 0 (0.0%) |
Real Estate Taxes by Mortgage Status in Eagle
| Property Taxes | Without Mortgage | With Mortgage |
| Less than $800 | 0 (0.0%) | 0 (0.0%) |
| $800 to $1,499 | 0 (0.0%) | 0 (0.0%) |
| $800 to $1,499 | 0 (0.0%) | 0 (0.0%) |
| Total | 38 (100.0%) | 0 (0.0%) |
Health & Disability in Eagle
Health Insurance Coverage by Age in Eagle
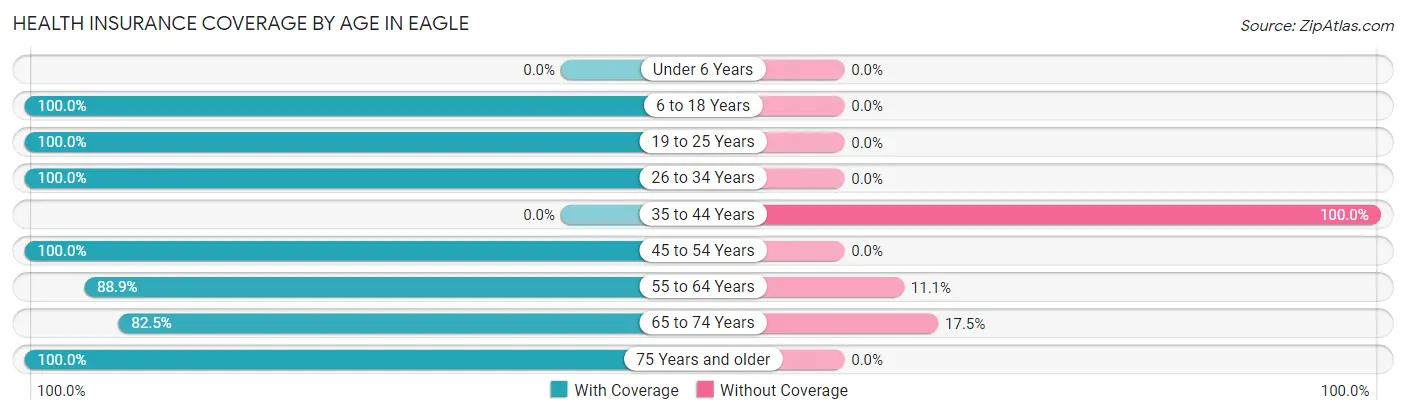
| Age Bracket | With Coverage | Without Coverage |
| Under 6 Years | 0 (0.0%) | 0 (0.0%) |
| 6 to 18 Years | 2 (100.0%) | 0 (0.0%) |
| 19 to 25 Years | 5 (100.0%) | 0 (0.0%) |
| 26 to 34 Years | 3 (100.0%) | 0 (0.0%) |
| 35 to 44 Years | 0 (0.0%) | 5 (100.0%) |
| 45 to 54 Years | 3 (100.0%) | 0 (0.0%) |
| 55 to 64 Years | 16 (88.9%) | 2 (11.1%) |
| 65 to 74 Years | 33 (82.5%) | 7 (17.5%) |
| 75 Years and older | 23 (100.0%) | 0 (0.0%) |
| Total | 85 (85.9%) | 14 (14.1%) |
Health Insurance Coverage by Citizenship Status in Eagle
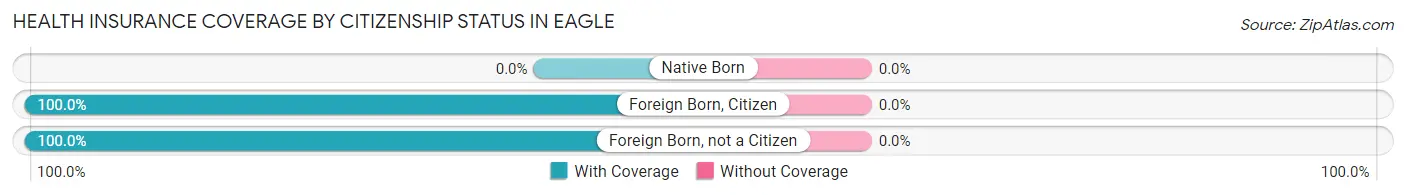
| Citizenship Status | With Coverage | Without Coverage |
| Native Born | 0 (0.0%) | 0 (0.0%) |
| Foreign Born, Citizen | 2 (100.0%) | 0 (0.0%) |
| Foreign Born, not a Citizen | 5 (100.0%) | 0 (0.0%) |
Health Insurance Coverage by Household Income in Eagle
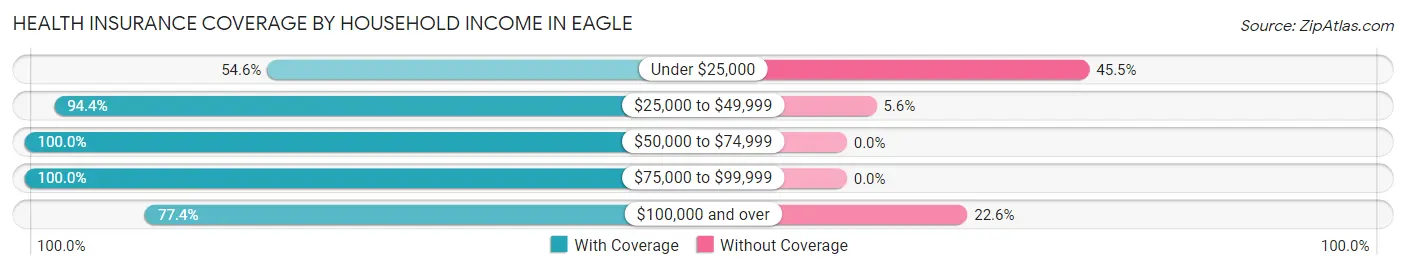
| Household Income | With Coverage | Without Coverage |
| Under $25,000 | 6 (54.5%) | 5 (45.5%) |
| $25,000 to $49,999 | 34 (94.4%) | 2 (5.6%) |
| $50,000 to $74,999 | 18 (100.0%) | 0 (0.0%) |
| $75,000 to $99,999 | 3 (100.0%) | 0 (0.0%) |
| $100,000 and over | 24 (77.4%) | 7 (22.6%) |
Public vs Private Health Insurance Coverage by Age in Eagle
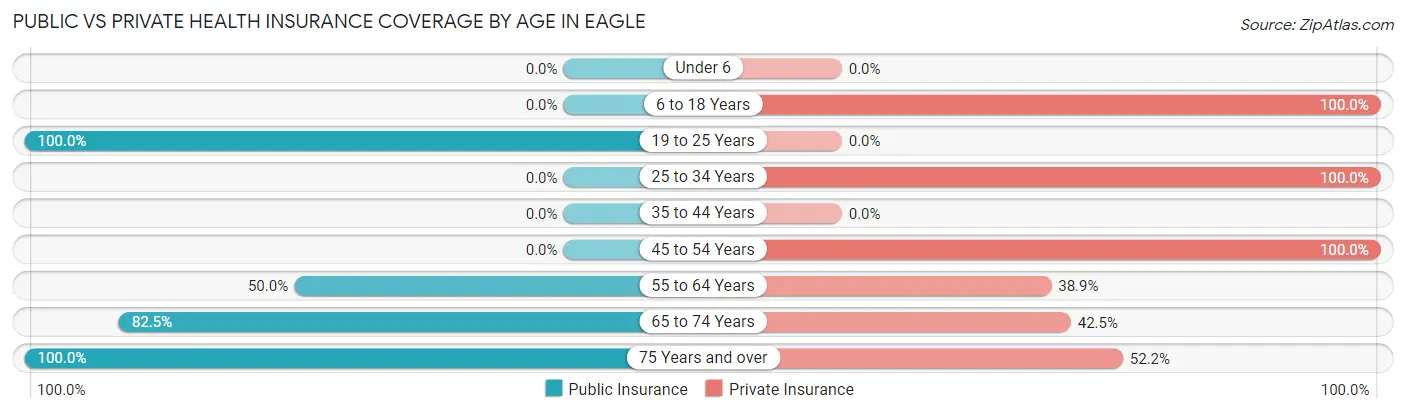
| Age Bracket | Public Insurance | Private Insurance |
| Under 6 | 0 (0.0%) | 0 (0.0%) |
| 6 to 18 Years | 0 (0.0%) | 2 (100.0%) |
| 19 to 25 Years | 5 (100.0%) | 0 (0.0%) |
| 25 to 34 Years | 0 (0.0%) | 3 (100.0%) |
| 35 to 44 Years | 0 (0.0%) | 0 (0.0%) |
| 45 to 54 Years | 0 (0.0%) | 3 (100.0%) |
| 55 to 64 Years | 9 (50.0%) | 7 (38.9%) |
| 65 to 74 Years | 33 (82.5%) | 17 (42.5%) |
| 75 Years and over | 23 (100.0%) | 12 (52.2%) |
| Total | 70 (70.7%) | 44 (44.4%) |
Disability Status by Sex by Age in Eagle
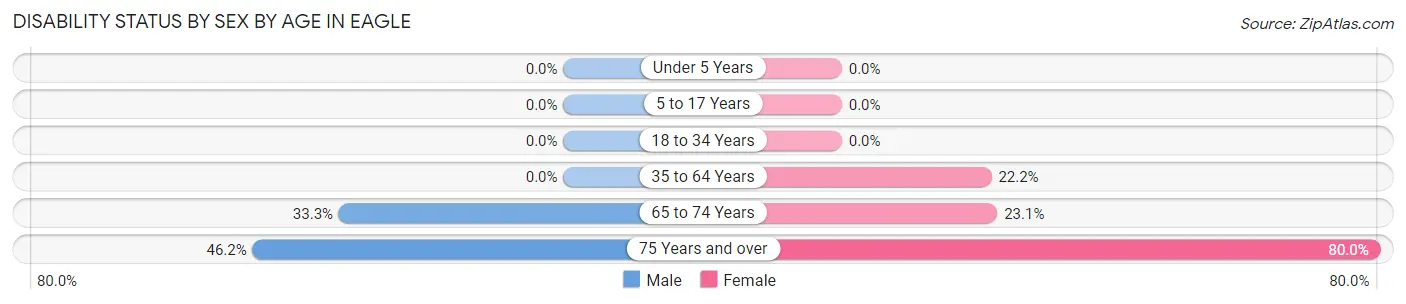
| Age Bracket | Male | Female |
| Under 5 Years | 0 (0.0%) | 0 (0.0%) |
| 5 to 17 Years | 0 (0.0%) | 0 (0.0%) |
| 18 to 34 Years | 0 (0.0%) | 0 (0.0%) |
| 35 to 64 Years | 0 (0.0%) | 2 (22.2%) |
| 65 to 74 Years | 9 (33.3%) | 3 (23.1%) |
| 75 Years and over | 6 (46.2%) | 8 (80.0%) |
Disability Class by Sex by Age in Eagle
Disability Class: Hearing Difficulty
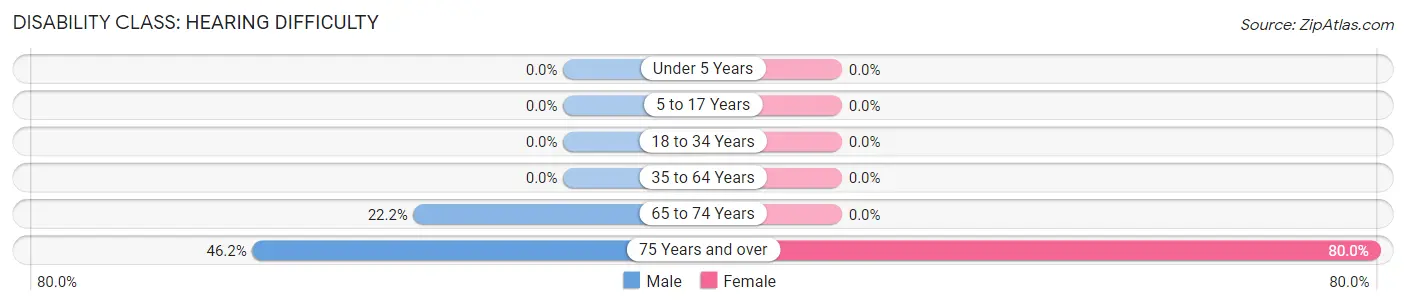
| Age Bracket | Male | Female |
| Under 5 Years | 0 (0.0%) | 0 (0.0%) |
| 5 to 17 Years | 0 (0.0%) | 0 (0.0%) |
| 18 to 34 Years | 0 (0.0%) | 0 (0.0%) |
| 35 to 64 Years | 0 (0.0%) | 0 (0.0%) |
| 65 to 74 Years | 6 (22.2%) | 0 (0.0%) |
| 75 Years and over | 6 (46.2%) | 8 (80.0%) |
Disability Class: Vision Difficulty
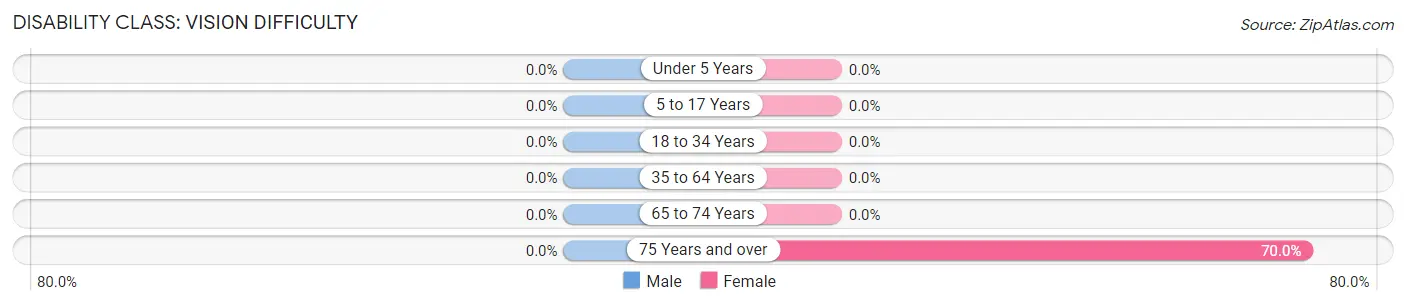
| Age Bracket | Male | Female |
| Under 5 Years | 0 (0.0%) | 0 (0.0%) |
| 5 to 17 Years | 0 (0.0%) | 0 (0.0%) |
| 18 to 34 Years | 0 (0.0%) | 0 (0.0%) |
| 35 to 64 Years | 0 (0.0%) | 0 (0.0%) |
| 65 to 74 Years | 0 (0.0%) | 0 (0.0%) |
| 75 Years and over | 0 (0.0%) | 7 (70.0%) |
Disability Class: Cognitive Difficulty
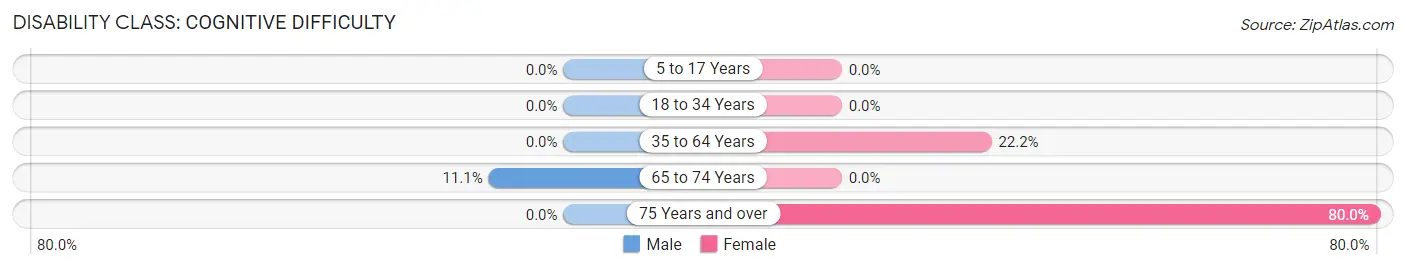
| Age Bracket | Male | Female |
| 5 to 17 Years | 0 (0.0%) | 0 (0.0%) |
| 18 to 34 Years | 0 (0.0%) | 0 (0.0%) |
| 35 to 64 Years | 0 (0.0%) | 2 (22.2%) |
| 65 to 74 Years | 3 (11.1%) | 0 (0.0%) |
| 75 Years and over | 0 (0.0%) | 8 (80.0%) |
Disability Class: Ambulatory Difficulty
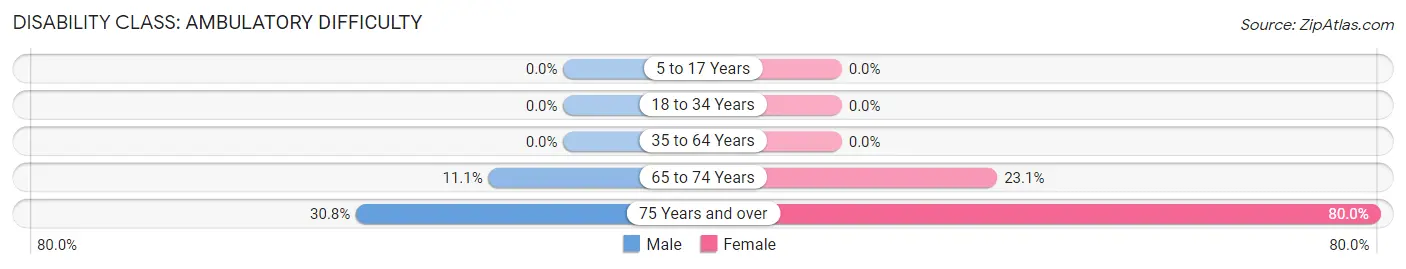
| Age Bracket | Male | Female |
| 5 to 17 Years | 0 (0.0%) | 0 (0.0%) |
| 18 to 34 Years | 0 (0.0%) | 0 (0.0%) |
| 35 to 64 Years | 0 (0.0%) | 0 (0.0%) |
| 65 to 74 Years | 3 (11.1%) | 3 (23.1%) |
| 75 Years and over | 4 (30.8%) | 8 (80.0%) |
Disability Class: Self-Care Difficulty
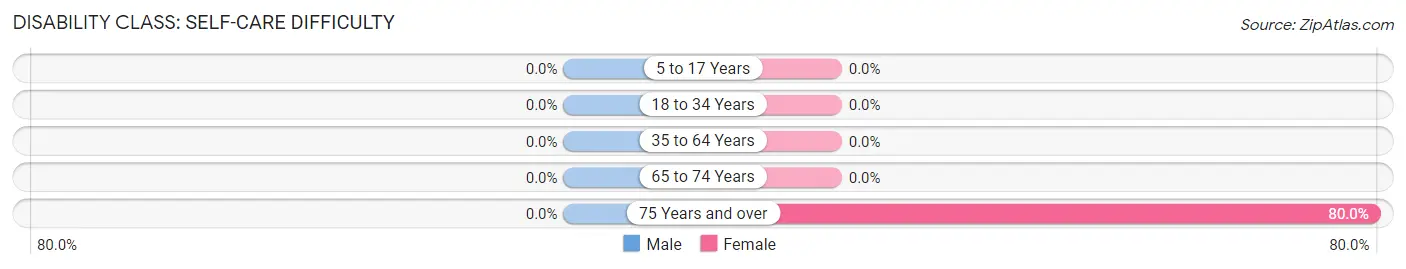
| Age Bracket | Male | Female |
| 5 to 17 Years | 0 (0.0%) | 0 (0.0%) |
| 18 to 34 Years | 0 (0.0%) | 0 (0.0%) |
| 35 to 64 Years | 0 (0.0%) | 0 (0.0%) |
| 65 to 74 Years | 0 (0.0%) | 0 (0.0%) |
| 75 Years and over | 0 (0.0%) | 8 (80.0%) |
Technology Access in Eagle
Computing Device Access in Eagle
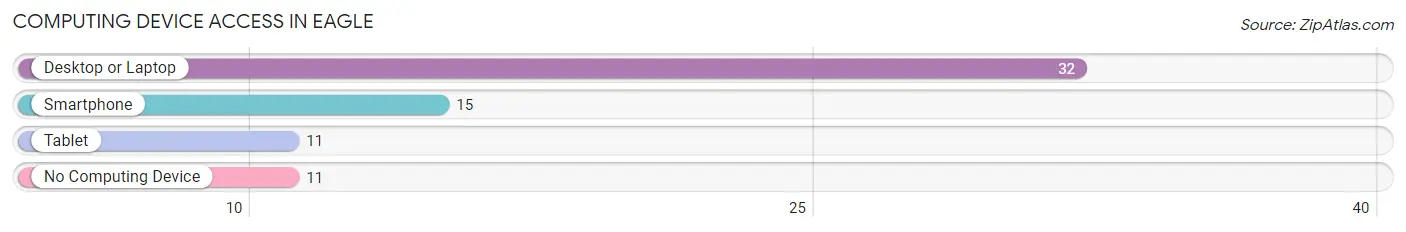
| Device Type | # Households | % Households |
| Desktop or Laptop | 32 | 66.7% |
| Smartphone | 15 | 31.2% |
| Tablet | 11 | 22.9% |
| No Computing Device | 11 | 22.9% |
| Total | 48 | 100.0% |
Internet Access in Eagle
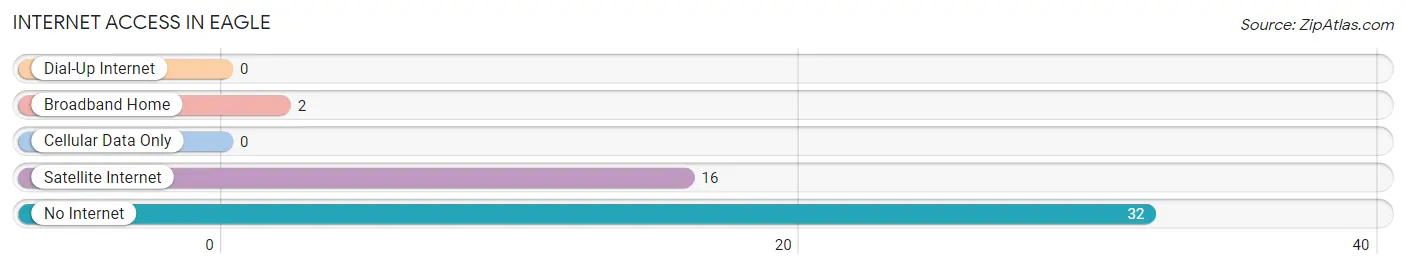
| Internet Type | # Households | % Households |
| Dial-Up Internet | 0 | 0.0% |
| Broadband Home | 2 | 4.2% |
| Cellular Data Only | 0 | 0.0% |
| Satellite Internet | 16 | 33.3% |
| No Internet | 32 | 66.7% |
| Total | 48 | 100.0% |
Eagle Summary
Eagle, Alaska is a small city located in the southeastern corner of the state, near the Canadian border. It is the only incorporated city in the Yukon-Koyukuk Census Area, and is the largest city in the region. The city has a population of approximately 1,000 people, and is the gateway to the Yukon-Koyukuk region.
Geography
Eagle is located in the Yukon-Koyukuk Census Area, in the southeastern corner of Alaska. It is situated on the banks of the Yukon River, near the Canadian border. The city is surrounded by mountains, and is located in a valley. The climate in Eagle is cold and dry, with temperatures ranging from -20 to 80 degrees Fahrenheit.
Economy
Eagle’s economy is largely based on tourism and subsistence activities. The city is a popular destination for hunters, fishermen, and other outdoor enthusiasts. The city also has a small commercial sector, with a few stores and restaurants. The city is also home to a small airport, which serves as a hub for air travel in the region.
Demographics
As of the 2010 census, Eagle had a population of 1,006 people. The racial makeup of the city was 95.2% White, 0.7% Native American, 0.3% Asian, 0.2% Pacific Islander, 0.1% from other races, and 3.5% from two or more races. The median household income was $45,000, and the median family income was $50,000.
The population of Eagle is largely made up of Native Americans, with the majority of the population being of Athabascan descent. The city also has a small population of non-Native Americans, including Europeans, Asians, and Pacific Islanders.
Conclusion
Eagle, Alaska is a small city located in the southeastern corner of the state, near the Canadian border. It is the only incorporated city in the Yukon-Koyukuk Census Area, and is the largest city in the region. The city has a population of approximately 1,000 people, and is the gateway to the Yukon-Koyukuk region. The economy of Eagle is largely based on tourism and subsistence activities, and the city is a popular destination for hunters, fishermen, and other outdoor enthusiasts. The population of Eagle is largely made up of Native Americans, with the majority of the population being of Athabascan descent.
Common Questions
What is Per Capita Income in Eagle?
Per Capita income in Eagle is $34,690.
What is the Median Family Income in Eagle?
Median Family Income in Eagle is $49,063.
What is the Median Household income in Eagle?
Median Household Income in Eagle is $47,500.
What is Inequality or Gini Index in Eagle?
Inequality or Gini Index in Eagle is 0.39.
What is the Total Population of Eagle?
Total Population of Eagle is 99.
What is the Total Male Population of Eagle?
Total Male Population of Eagle is 62.
What is the Total Female Population of Eagle?
Total Female Population of Eagle is 37.
What is the Ratio of Males per 100 Females in Eagle?
There are 167.57 Males per 100 Females in Eagle.
What is the Ratio of Females per 100 Males in Eagle?
There are 59.68 Females per 100 Males in Eagle.
What is the Median Population Age in Eagle?
Median Population Age in Eagle is 69.8 Years.
What is the Average Family Size in Eagle
Average Family Size in Eagle is 2.8 People.
What is the Average Household Size in Eagle
Average Household Size in Eagle is 2.1 People.
How Large is the Labor Force in Eagle?
There are 42 People in the Labor Forcein in Eagle.
What is the Percentage of People in the Labor Force in Eagle?
42.4% of People are in the Labor Force in Eagle.
What is the Unemployment Rate in Eagle?
Unemployment Rate in Eagle is 35.7%.