Cities with the Highest Percentage of Households with Income Above $200,000 in Michigan
RELATED REPORTS & OPTIONS
Household Income | $200k+
Michigan
Compare Cities
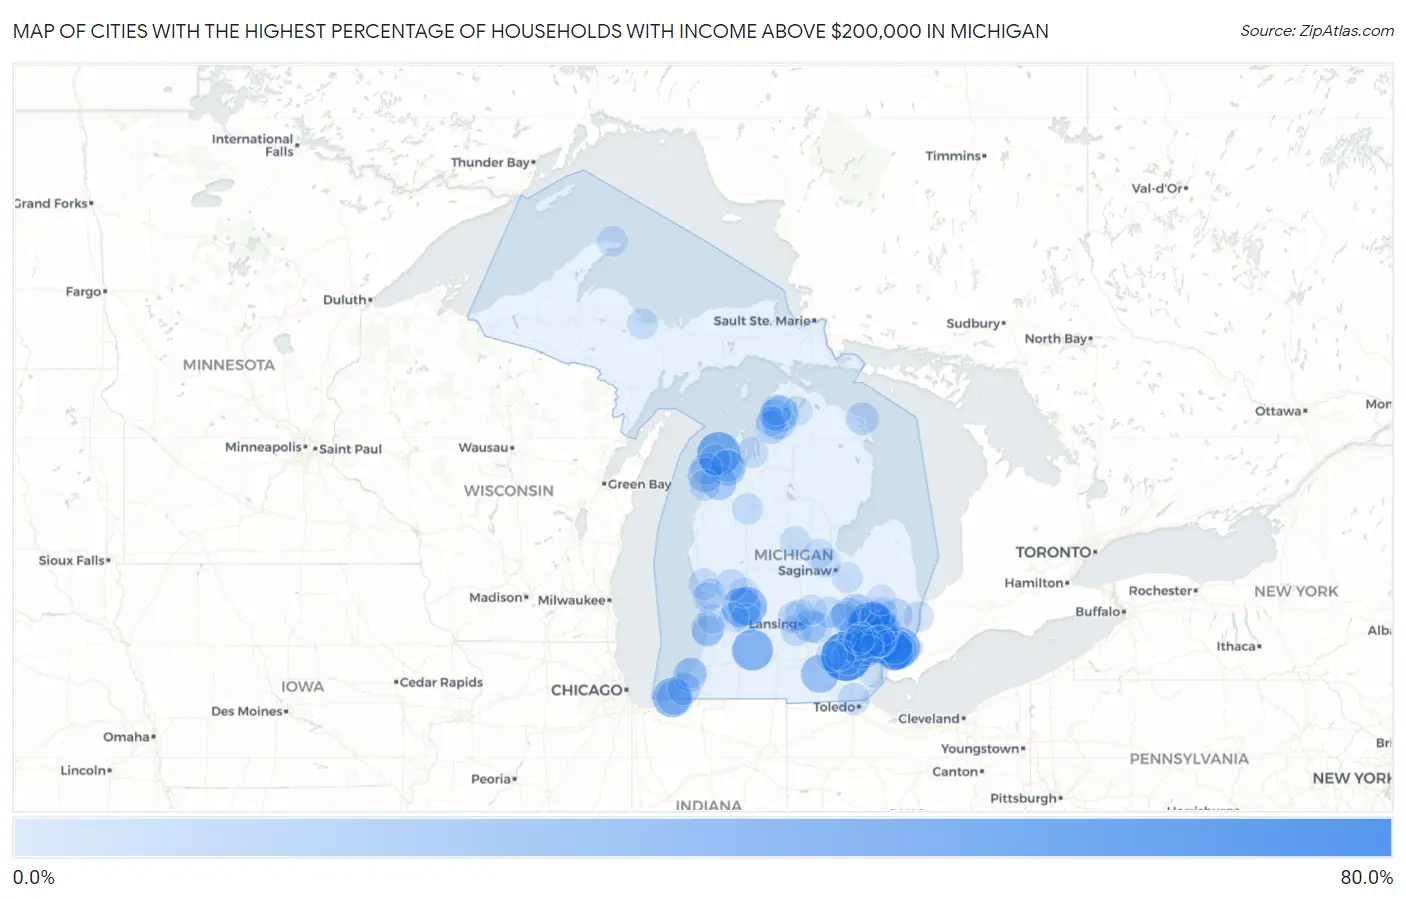
Map of Cities with the Highest Percentage of Households with Income Above $200,000 in Michigan
0.0%
80.0%
Cities with the Highest Percentage of Households with Income Above $200,000 in Michigan
| City | Households with Income > $200k | vs State | vs National | |
| 1. | Barton Hills | 68.4% | 8.2%(+60.2)#1 | 11.4%(+57.0)#89 |
| 2. | Lake Angelus | 63.5% | 8.2%(+55.3)#2 | 11.4%(+52.1)#131 |
| 3. | Orchard Lake Village | 54.7% | 8.2%(+46.5)#3 | 11.4%(+43.3)#307 |
| 4. | Bloomfield Hills | 50.0% | 8.2%(+41.8)#4 | 11.4%(+38.6)#444 |
| 5. | Bingham Farms | 49.4% | 8.2%(+41.2)#5 | 11.4%(+38.0)#472 |
| 6. | Glen Arbor | 49.3% | 8.2%(+41.1)#6 | 11.4%(+37.9)#474 |
| 7. | Franklin | 45.7% | 8.2%(+37.5)#7 | 11.4%(+34.3)#587 |
| 8. | Huntington Woods | 44.9% | 8.2%(+36.7)#8 | 11.4%(+33.5)#614 |
| 9. | South Gull Lake | 42.0% | 8.2%(+33.8)#9 | 11.4%(+30.6)#738 |
| 10. | Village Of Grosse Pointe Shores | 40.7% | 8.2%(+32.5)#10 | 11.4%(+29.3)#789 |
| 11. | Beverly Hills | 39.9% | 8.2%(+31.7)#11 | 11.4%(+28.5)#841 |
| 12. | Birmingham | 38.8% | 8.2%(+30.6)#12 | 11.4%(+27.4)#907 |
| 13. | Michiana | 37.7% | 8.2%(+29.5)#13 | 11.4%(+26.3)#979 |
| 14. | East Grand Rapids | 36.6% | 8.2%(+28.4)#14 | 11.4%(+25.2)#1,041 |
| 15. | Forest Hills | 35.8% | 8.2%(+27.6)#15 | 11.4%(+24.4)#1,094 |
| 16. | Pleasant Ridge | 35.6% | 8.2%(+27.4)#16 | 11.4%(+24.2)#1,119 |
| 17. | Grosse Pointe Farms | 35.3% | 8.2%(+27.1)#17 | 11.4%(+23.9)#1,151 |
| 18. | Northville | 33.9% | 8.2%(+25.7)#18 | 11.4%(+22.5)#1,256 |
| 19. | Grosse Pointe Park | 33.6% | 8.2%(+25.4)#19 | 11.4%(+22.2)#1,276 |
| 20. | Vineyard Lake | 32.7% | 8.2%(+24.5)#20 | 11.4%(+21.3)#1,365 |
| 21. | Grosse Pointe | 31.6% | 8.2%(+23.4)#21 | 11.4%(+20.2)#1,466 |
| 22. | Bay View | 28.1% | 8.2%(+19.9)#22 | 11.4%(+16.7)#1,807 |
| 23. | Maple Grove | 28.0% | 8.2%(+19.8)#23 | 11.4%(+16.6)#1,821 |
| 24. | Grosse Pointe Woods | 25.2% | 8.2%(+17.0)#24 | 11.4%(+13.8)#2,144 |
| 25. | Rochester | 24.9% | 8.2%(+16.7)#25 | 11.4%(+13.5)#2,179 |
| 26. | Plymouth | 24.8% | 8.2%(+16.6)#26 | 11.4%(+13.4)#2,187 |
| 27. | Crystal Mountain | 24.5% | 8.2%(+16.3)#27 | 11.4%(+13.1)#2,239 |
| 28. | Elberta | 23.6% | 8.2%(+15.4)#28 | 11.4%(+12.2)#2,387 |
| 29. | Grand Beach | 23.0% | 8.2%(+14.8)#29 | 11.4%(+11.6)#2,485 |
| 30. | Sylvan Lake | 22.9% | 8.2%(+14.7)#30 | 11.4%(+11.5)#2,497 |
| 31. | Novi | 22.6% | 8.2%(+14.4)#31 | 11.4%(+11.2)#2,539 |
| 32. | Lake Fenton | 22.0% | 8.2%(+13.8)#32 | 11.4%(+10.6)#2,655 |
| 33. | Troy | 21.9% | 8.2%(+13.7)#33 | 11.4%(+10.5)#2,674 |
| 34. | Rochester Hills | 21.5% | 8.2%(+13.3)#34 | 11.4%(+10.1)#2,745 |
| 35. | Walloon Lake | 20.3% | 8.2%(+12.1)#35 | 11.4%(+8.90)#2,988 |
| 36. | Milford | 20.1% | 8.2%(+11.9)#36 | 11.4%(+8.70)#3,018 |
| 37. | Shoreham | 20.0% | 8.2%(+11.8)#37 | 11.4%(+8.60)#3,045 |
| 38. | Saugatuck | 19.2% | 8.2%(+11.0)#38 | 11.4%(+7.80)#3,228 |
| 39. | Advance | 19.1% | 8.2%(+10.9)#39 | 11.4%(+7.70)#3,255 |
| 40. | Village Of Clarkston | 18.8% | 8.2%(+10.6)#40 | 11.4%(+7.40)#3,330 |
| 41. | Lake Orion | 18.1% | 8.2%(+9.90)#41 | 11.4%(+6.70)#3,479 |
| 42. | Shorewood Tower Hills Harbert | 18.0% | 8.2%(+9.80)#42 | 11.4%(+6.60)#3,497 |
| 43. | Presque Isle Harbor | 17.9% | 8.2%(+9.70)#43 | 11.4%(+6.50)#3,532 |
| 44. | Okemos | 17.8% | 8.2%(+9.60)#44 | 11.4%(+6.40)#3,544 |
| 45. | Armada | 17.8% | 8.2%(+9.60)#45 | 11.4%(+6.40)#3,557 |
| 46. | Ann Arbor | 16.4% | 8.2%(+8.20)#46 | 11.4%(+5.00)#3,875 |
| 47. | Lake Ann | 16.2% | 8.2%(+8.00)#47 | 11.4%(+4.80)#3,938 |
| 48. | Farmington Hills | 15.8% | 8.2%(+7.60)#48 | 11.4%(+4.40)#4,020 |
| 49. | South Lyon | 15.4% | 8.2%(+7.20)#49 | 11.4%(+4.00)#4,147 |
| 50. | Leonard | 15.3% | 8.2%(+7.10)#50 | 11.4%(+3.90)#4,221 |
| 51. | Crystal Downs Country Club | 15.2% | 8.2%(+7.00)#51 | 11.4%(+3.80)#4,250 |
| 52. | Williamston | 15.1% | 8.2%(+6.90)#52 | 11.4%(+3.70)#4,262 |
| 53. | Wacousta | 14.7% | 8.2%(+6.50)#53 | 11.4%(+3.30)#4,393 |
| 54. | Casnovia | 14.7% | 8.2%(+6.50)#54 | 11.4%(+3.30)#4,410 |
| 55. | Lambertville | 14.6% | 8.2%(+6.40)#55 | 11.4%(+3.20)#4,428 |
| 56. | Royal Oak | 14.3% | 8.2%(+6.10)#56 | 11.4%(+2.90)#4,524 |
| 57. | Dimondale | 14.3% | 8.2%(+6.10)#57 | 11.4%(+2.90)#4,543 |
| 58. | Berkley | 13.9% | 8.2%(+5.70)#58 | 11.4%(+2.50)#4,686 |
| 59. | Douglas | 13.9% | 8.2%(+5.70)#59 | 11.4%(+2.50)#4,706 |
| 60. | Bancroft | 13.8% | 8.2%(+5.60)#60 | 11.4%(+2.40)#4,746 |
| 61. | Petoskey | 13.7% | 8.2%(+5.50)#61 | 11.4%(+2.30)#4,777 |
| 62. | Dewitt | 13.7% | 8.2%(+5.50)#62 | 11.4%(+2.30)#4,782 |
| 63. | Lamont | 13.3% | 8.2%(+5.10)#63 | 11.4%(+1.90)#4,942 |
| 64. | Wedgewood | 13.3% | 8.2%(+5.10)#64 | 11.4%(+1.90)#4,951 |
| 65. | Arcadia | 13.1% | 8.2%(+4.90)#65 | 11.4%(+1.70)#5,041 |
| 66. | Dexter | 12.7% | 8.2%(+4.50)#66 | 11.4%(+1.30)#5,200 |
| 67. | Harbor Springs | 12.7% | 8.2%(+4.50)#67 | 11.4%(+1.30)#5,208 |
| 68. | Empire | 12.7% | 8.2%(+4.50)#68 | 11.4%(+1.30)#5,216 |
| 69. | North Muskegon | 12.6% | 8.2%(+4.40)#69 | 11.4%(+1.20)#5,248 |
| 70. | Chelsea | 12.5% | 8.2%(+4.30)#70 | 11.4%(+1.10)#5,279 |
| 71. | Lathrup Village | 12.5% | 8.2%(+4.30)#71 | 11.4%(+1.10)#5,281 |
| 72. | Harvey | 12.3% | 8.2%(+4.10)#72 | 11.4%(+0.900)#5,388 |
| 73. | Copper Harbor | 12.2% | 8.2%(+4.00)#73 | 11.4%(+0.800)#5,465 |
| 74. | St Joseph | 12.1% | 8.2%(+3.90)#74 | 11.4%(+0.700)#5,478 |
| 75. | Goodrich | 12.1% | 8.2%(+3.90)#75 | 11.4%(+0.700)#5,493 |
| 76. | Elk Rapids | 12.1% | 8.2%(+3.90)#76 | 11.4%(+0.700)#5,495 |
| 77. | Fruitport | 12.1% | 8.2%(+3.90)#77 | 11.4%(+0.700)#5,496 |
| 78. | Loomis | 11.9% | 8.2%(+3.70)#78 | 11.4%(+0.500)#5,598 |
| 79. | St Clair | 11.8% | 8.2%(+3.60)#79 | 11.4%(+0.400)#5,620 |
| 80. | Frankenmuth | 11.8% | 8.2%(+3.60)#80 | 11.4%(+0.400)#5,621 |
| 81. | Oxford | 11.8% | 8.2%(+3.60)#81 | 11.4%(+0.400)#5,625 |
| 82. | Farmington | 11.7% | 8.2%(+3.50)#82 | 11.4%(+0.300)#5,663 |
| 83. | Caledonia | 11.2% | 8.2%(+3.00)#83 | 11.4%(-0.200)#5,883 |
| 84. | Attica | 11.2% | 8.2%(+3.00)#84 | 11.4%(-0.200)#5,889 |
| 85. | Midland | 10.8% | 8.2%(+2.60)#85 | 11.4%(-0.600)#6,061 |
| 86. | Lake Victoria | 10.8% | 8.2%(+2.60)#86 | 11.4%(-0.600)#6,097 |
| 87. | Horton Bay | 10.8% | 8.2%(+2.60)#87 | 11.4%(-0.600)#6,101 |
| 88. | Grand Blanc | 10.6% | 8.2%(+2.40)#88 | 11.4%(-0.800)#6,179 |
| 89. | Argentine | 10.6% | 8.2%(+2.40)#89 | 11.4%(-0.800)#6,191 |
| 90. | Linden | 10.5% | 8.2%(+2.30)#90 | 11.4%(-0.900)#6,236 |
| 91. | Beechwood | 10.5% | 8.2%(+2.30)#91 | 11.4%(-0.900)#6,237 |
| 92. | Spring Lake | 10.5% | 8.2%(+2.30)#92 | 11.4%(-0.900)#6,238 |
| 93. | Rockford | 10.3% | 8.2%(+2.10)#93 | 11.4%(-1.10)#6,337 |
| 94. | Freeland | 10.2% | 8.2%(+2.00)#94 | 11.4%(-1.20)#6,391 |
| 95. | Byron Center | 10.2% | 8.2%(+2.00)#95 | 11.4%(-1.20)#6,394 |
| 96. | Livonia | 10.0% | 8.2%(+1.80)#96 | 11.4%(-1.40)#6,489 |
| 97. | Wolverine Lake | 10.0% | 8.2%(+1.80)#97 | 11.4%(-1.40)#6,506 |
| 98. | Indian River | 10.0% | 8.2%(+1.80)#98 | 11.4%(-1.40)#6,513 |
| 99. | Wixom | 9.9% | 8.2%(+1.70)#99 | 11.4%(-1.50)#6,557 |
| 100. | Flat Rock | 9.9% | 8.2%(+1.70)#100 | 11.4%(-1.50)#6,567 |
Common Questions
What are the Top 10 Cities with the Highest Percentage of Households with Income Above $200,000 in Michigan?
Top 10 Cities with the Highest Percentage of Households with Income Above $200,000 in Michigan are:
#1
68.4%
#2
63.5%
#3
54.7%
#4
50.0%
#5
49.4%
#6
49.3%
#7
45.7%
#8
44.9%
#9
42.0%
#10
40.7%
What city has the Highest Percentage of Households with Income Above $200,000 in Michigan?
Barton Hills has the Highest Percentage of Households with Income Above $200,000 in Michigan with 68.4%.
What is the Percentage of Households with Income Above $200,000 in the State of Michigan?
Percentage of Households with Income Above $200,000 in Michigan is 8.2%.
What is the Percentage of Households with Income Above $200,000 in the United States?
Percentage of Households with Income Above $200,000 in the United States is 11.4%.