Village of Clarkston, MI Map & Demographics
Village of Clarkston Map
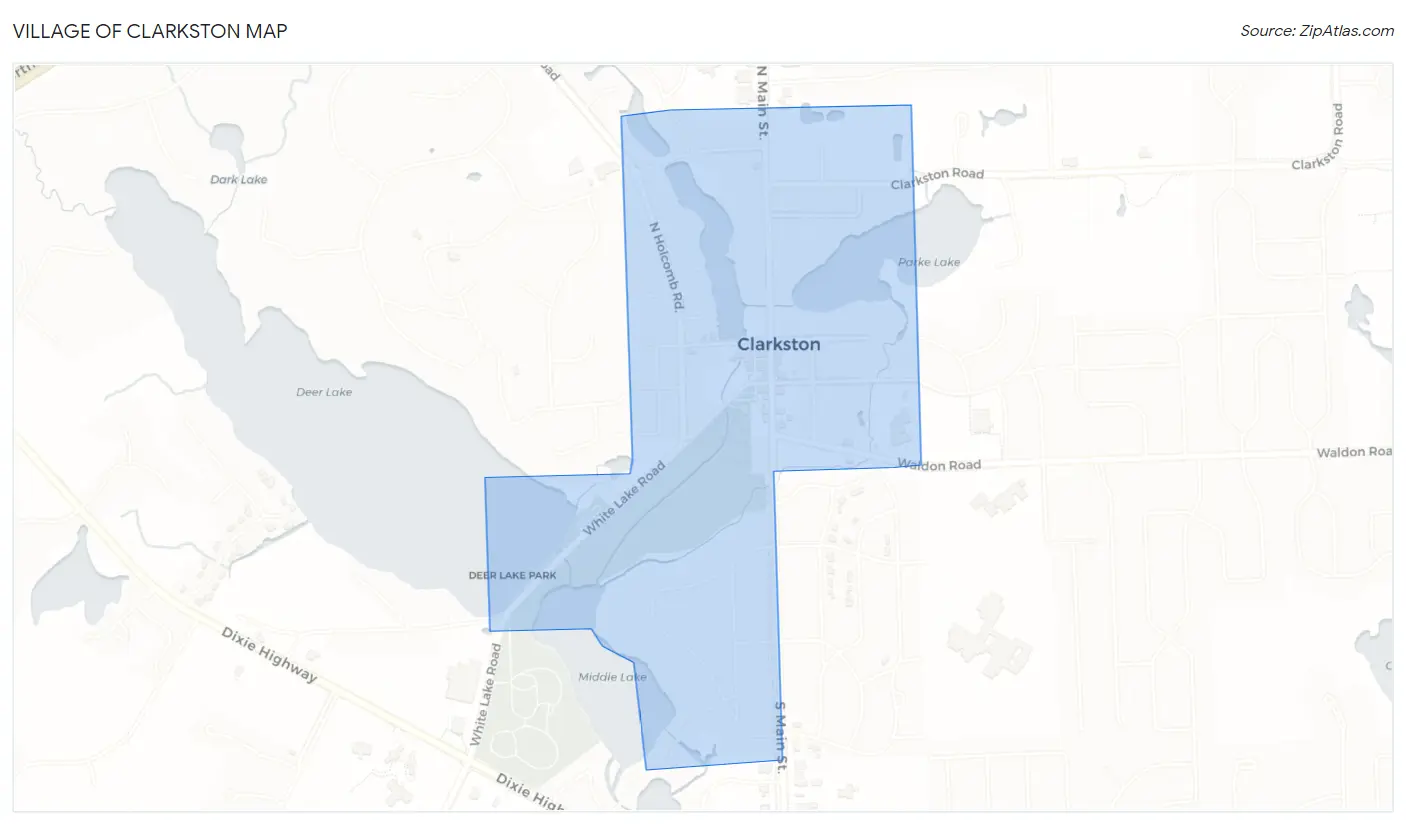
Village of Clarkston Overview
$60,006
PER CAPITA INCOME
$145,455
AVG FAMILY INCOME
$95,313
AVG HOUSEHOLD INCOME
48.9%
WAGE / INCOME GAP [ % ]
51.1¢/ $1
WAGE / INCOME GAP [ $ ]
0.45
INEQUALITY / GINI INDEX
775
TOTAL POPULATION
388
MALE POPULATION
387
FEMALE POPULATION
100.26
MALES / 100 FEMALES
99.74
FEMALES / 100 MALES
54.9
MEDIAN AGE
2.9
AVG FAMILY SIZE
2.2
AVG HOUSEHOLD SIZE
399
LABOR FORCE [ PEOPLE ]
61.1%
PERCENT IN LABOR FORCE
3.5%
UNEMPLOYMENT RATE
Income in Village of Clarkston
Income Overview in Village of Clarkston
Per Capita Income in Village of Clarkston is $60,006, while median incomes of families and households are $145,455 and $95,313 respectively.
| Characteristic | Number | Measure |
| Per Capita Income | 775 | $60,006 |
| Median Family Income | 222 | $145,455 |
| Mean Family Income | 222 | $178,423 |
| Median Household Income | 351 | $95,313 |
| Mean Household Income | 351 | $132,620 |
| Income Deficit | 222 | $0 |
| Wage / Income Gap (%) | 775 | 48.88% |
| Wage / Income Gap ($) | 775 | 51.12¢ per $1 |
| Gini / Inequality Index | 775 | 0.45 |
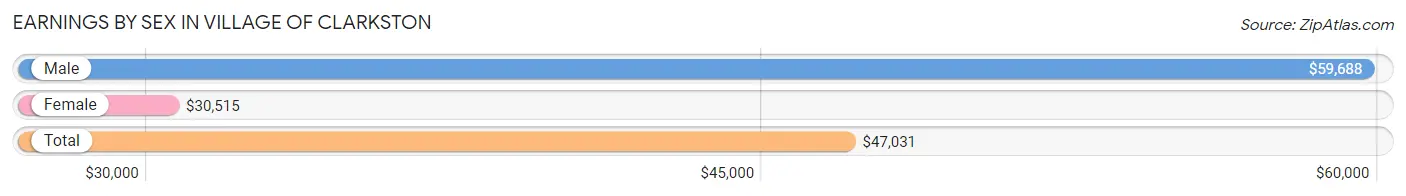
Earnings by Sex in Village of Clarkston
Average Earnings in Village of Clarkston are $47,031, $59,688 for men and $30,515 for women, a difference of 48.9%.
| Sex | Number | Average Earnings |
| Male | 217 (51.2%) | $59,688 |
| Female | 207 (48.8%) | $30,515 |
| Total | 424 (100.0%) | $47,031 |
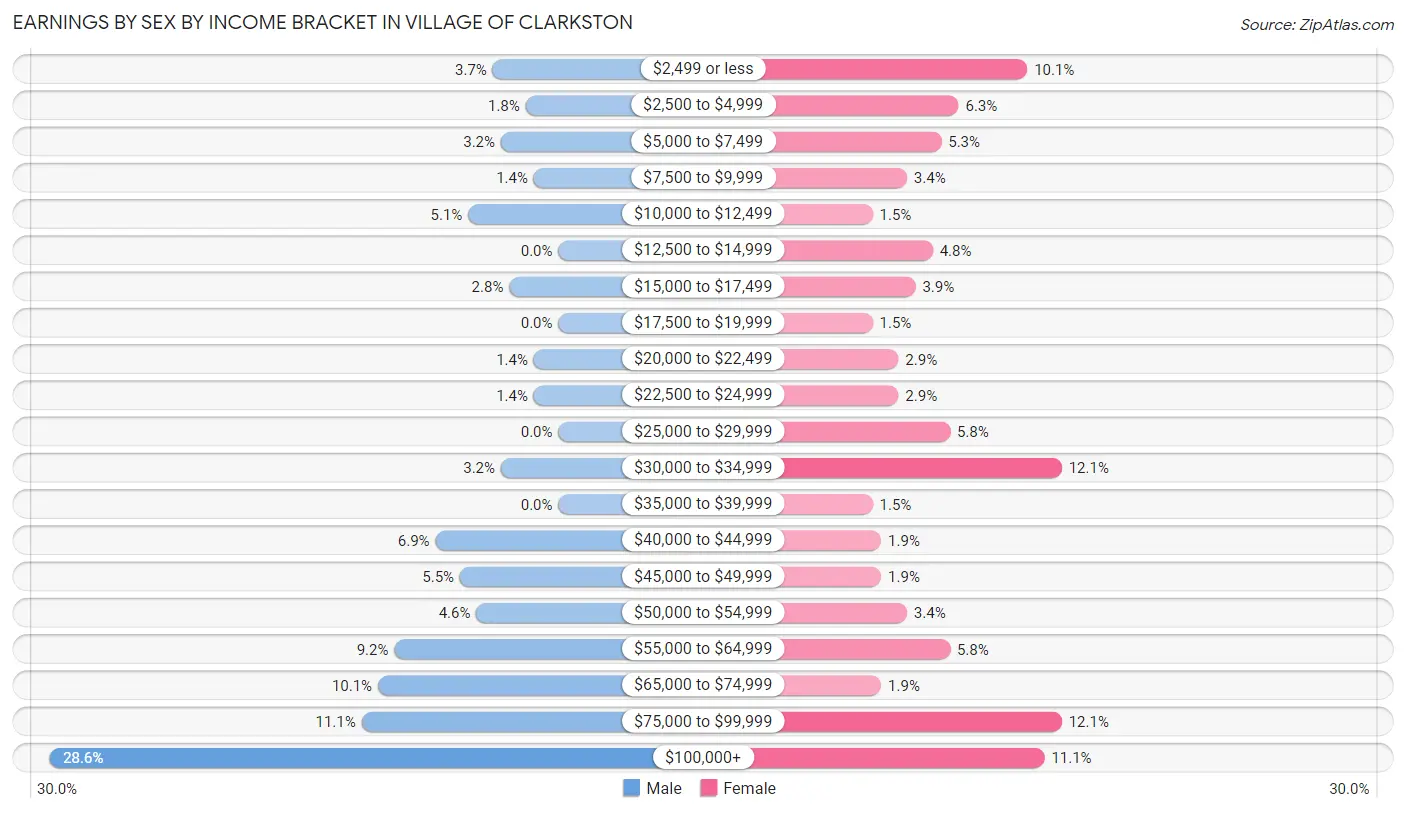
Earnings by Sex by Income Bracket in Village of Clarkston
The most common earnings brackets in Village of Clarkston are $100,000+ for men (62 | 28.6%) and $30,000 to $34,999 for women (25 | 12.1%).
| Income | Male | Female |
| $2,499 or less | 8 (3.7%) | 21 (10.1%) |
| $2,500 to $4,999 | 4 (1.8%) | 13 (6.3%) |
| $5,000 to $7,499 | 7 (3.2%) | 11 (5.3%) |
| $7,500 to $9,999 | 3 (1.4%) | 7 (3.4%) |
| $10,000 to $12,499 | 11 (5.1%) | 3 (1.5%) |
| $12,500 to $14,999 | 0 (0.0%) | 10 (4.8%) |
| $15,000 to $17,499 | 6 (2.8%) | 8 (3.9%) |
| $17,500 to $19,999 | 0 (0.0%) | 3 (1.5%) |
| $20,000 to $22,499 | 3 (1.4%) | 6 (2.9%) |
| $22,500 to $24,999 | 3 (1.4%) | 6 (2.9%) |
| $25,000 to $29,999 | 0 (0.0%) | 12 (5.8%) |
| $30,000 to $34,999 | 7 (3.2%) | 25 (12.1%) |
| $35,000 to $39,999 | 0 (0.0%) | 3 (1.5%) |
| $40,000 to $44,999 | 15 (6.9%) | 4 (1.9%) |
| $45,000 to $49,999 | 12 (5.5%) | 4 (1.9%) |
| $50,000 to $54,999 | 10 (4.6%) | 7 (3.4%) |
| $55,000 to $64,999 | 20 (9.2%) | 12 (5.8%) |
| $65,000 to $74,999 | 22 (10.1%) | 4 (1.9%) |
| $75,000 to $99,999 | 24 (11.1%) | 25 (12.1%) |
| $100,000+ | 62 (28.6%) | 23 (11.1%) |
| Total | 217 (100.0%) | 207 (100.0%) |
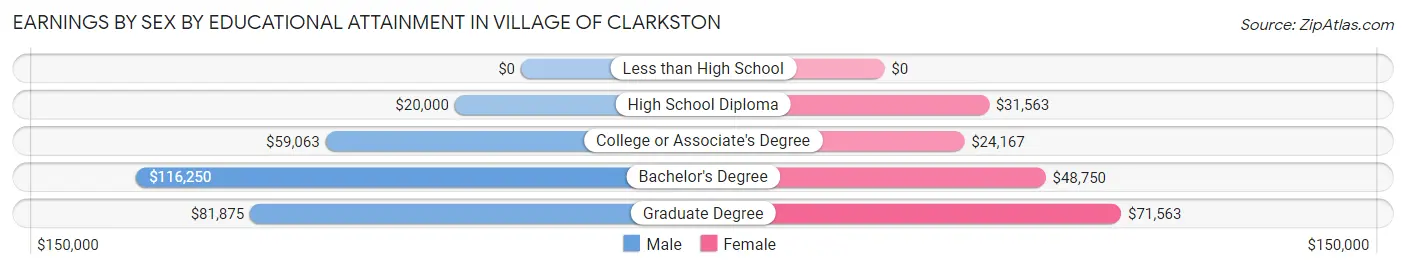
Earnings by Sex by Educational Attainment in Village of Clarkston
Average earnings in Village of Clarkston are $69,500 for men and $32,500 for women, a difference of 53.2%. Men with an educational attainment of bachelor's degree enjoy the highest average annual earnings of $116,250, while those with high school diploma education earn the least with $20,000. Women with an educational attainment of graduate degree earn the most with the average annual earnings of $71,563, while those with college or associate's degree education have the smallest earnings of $24,167.
| Educational Attainment | Male Income | Female Income |
| Less than High School | - | - |
| High School Diploma | $20,000 | $31,563 |
| College or Associate's Degree | $59,063 | $24,167 |
| Bachelor's Degree | $116,250 | $48,750 |
| Graduate Degree | $81,875 | $71,563 |
| Total | $69,500 | $32,500 |
Family Income in Village of Clarkston
Family Income Brackets in Village of Clarkston
According to the Village of Clarkston family income data, there are 66 families falling into the $200,000+ income range, which is the most common income bracket and makes up 29.7% of all families.
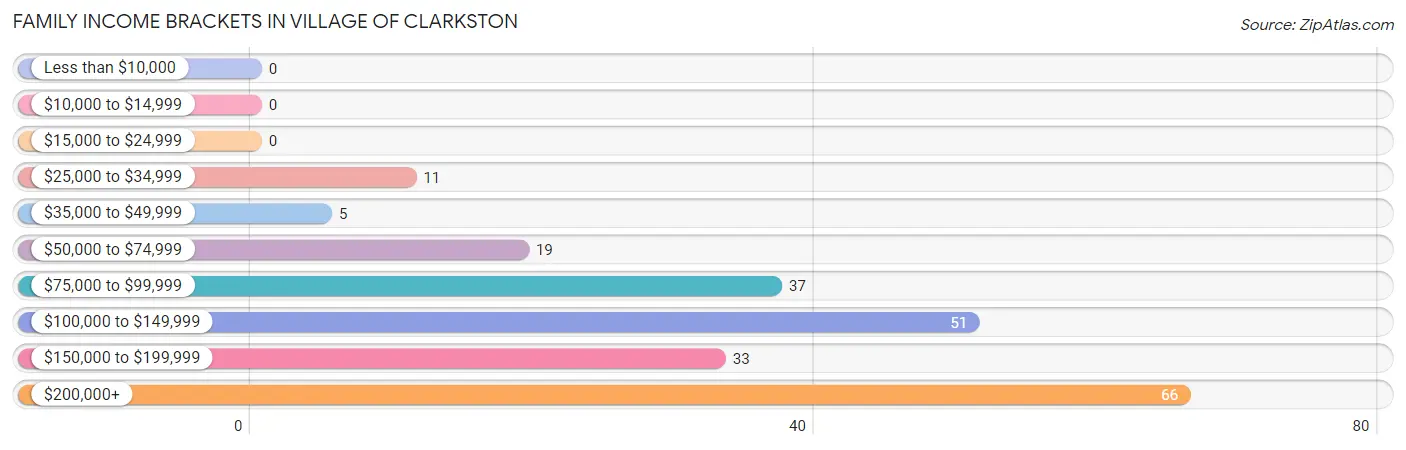
| Income Bracket | # Families | % Families |
| Less than $10,000 | 0 | 0.0% |
| $10,000 to $14,999 | 0 | 0.0% |
| $15,000 to $24,999 | 0 | 0.0% |
| $25,000 to $34,999 | 11 | 5.0% |
| $35,000 to $49,999 | 5 | 2.3% |
| $50,000 to $74,999 | 19 | 8.6% |
| $75,000 to $99,999 | 37 | 16.7% |
| $100,000 to $149,999 | 51 | 23.0% |
| $150,000 to $199,999 | 33 | 14.9% |
| $200,000+ | 66 | 29.7% |
Family Income by Famaliy Size in Village of Clarkston
6-person families (8 | 3.6%) account for the highest median family income in Village of Clarkston with $237,500 per family, while 2-person families (131 | 59.0%) have the highest median income of $57,969 per family member.
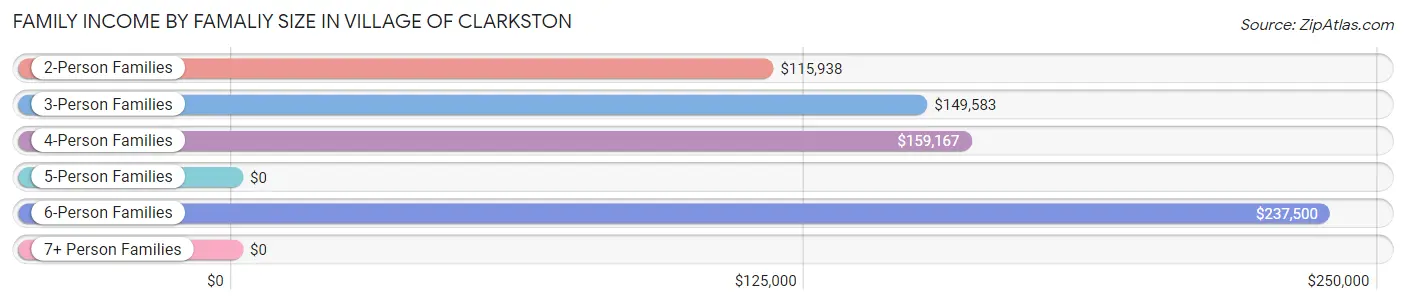
| Income Bracket | # Families | Median Income |
| 2-Person Families | 131 (59.0%) | $115,938 |
| 3-Person Families | 45 (20.3%) | $149,583 |
| 4-Person Families | 20 (9.0%) | $159,167 |
| 5-Person Families | 18 (8.1%) | $0 |
| 6-Person Families | 8 (3.6%) | $237,500 |
| 7+ Person Families | 0 (0.0%) | $0 |
| Total | 222 (100.0%) | $145,455 |
Family Income by Number of Earners in Village of Clarkston
The median family income in Village of Clarkston is $145,455, with families comprising 3+ earners (19) having the highest median family income of $218,750, while families with 1 earner (63) have the lowest median family income of $98,750, accounting for 8.6% and 28.4% of families, respectively.
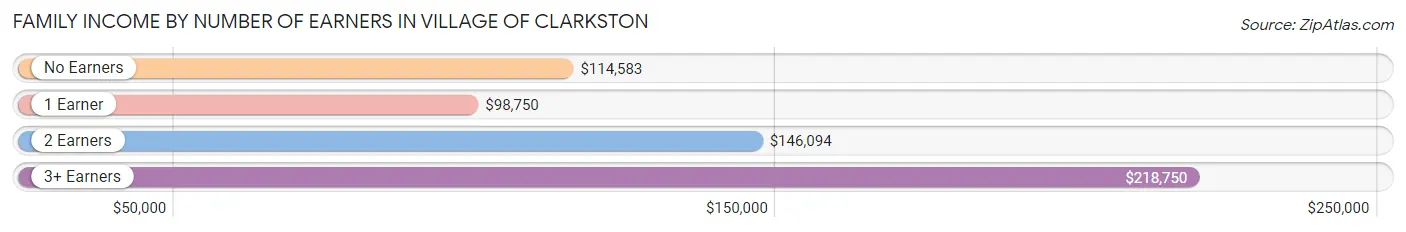
| Number of Earners | # Families | Median Income |
| No Earners | 41 (18.5%) | $114,583 |
| 1 Earner | 63 (28.4%) | $98,750 |
| 2 Earners | 99 (44.6%) | $146,094 |
| 3+ Earners | 19 (8.6%) | $218,750 |
| Total | 222 (100.0%) | $145,455 |
Household Income in Village of Clarkston
Household Income Brackets in Village of Clarkston
With 66 households falling in the category, the $100,000 to $149,999 income range is the most frequent in Village of Clarkston, accounting for 18.8% of all households. In contrast, only 3 households (0.9%) fall into the $10,000 to $14,999 income bracket, making it the least populous group.
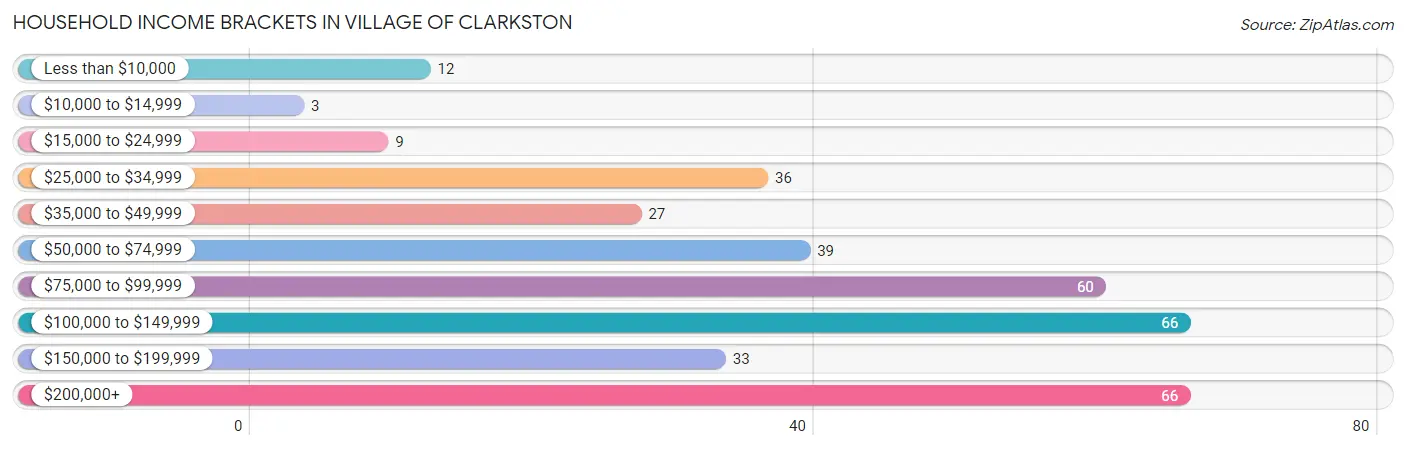
| Income Bracket | # Households | % Households |
| Less than $10,000 | 12 | 3.4% |
| $10,000 to $14,999 | 3 | 0.9% |
| $15,000 to $24,999 | 9 | 2.6% |
| $25,000 to $34,999 | 36 | 10.3% |
| $35,000 to $49,999 | 27 | 7.7% |
| $50,000 to $74,999 | 39 | 11.1% |
| $75,000 to $99,999 | 60 | 17.1% |
| $100,000 to $149,999 | 66 | 18.8% |
| $150,000 to $199,999 | 33 | 9.4% |
| $200,000+ | 66 | 18.8% |
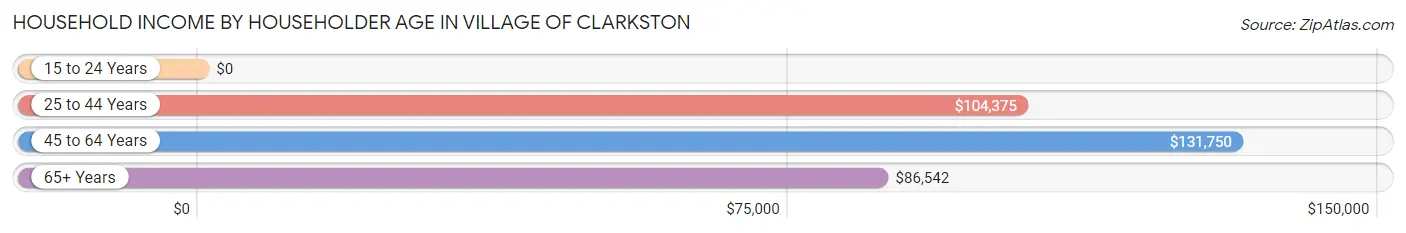
Household Income by Householder Age in Village of Clarkston
The median household income in Village of Clarkston is $95,313, with the highest median household income of $131,750 found in the 45 to 64 years age bracket for the primary householder. A total of 129 households (36.7%) fall into this category.
| Income Bracket | # Households | Median Income |
| 15 to 24 Years | 0 (0.0%) | $0 |
| 25 to 44 Years | 55 (15.7%) | $104,375 |
| 45 to 64 Years | 129 (36.7%) | $131,750 |
| 65+ Years | 167 (47.6%) | $86,542 |
| Total | 351 (100.0%) | $95,313 |
Poverty in Village of Clarkston
Income Below Poverty by Sex and Age in Village of Clarkston
With 3.1% poverty level for males and 10.1% for females among the residents of Village of Clarkston, 15 year old males and 12 to 14 year old females are the most vulnerable to poverty, with 7 males (100.0%) and 14 females (58.3%) in their respective age groups living below the poverty level.
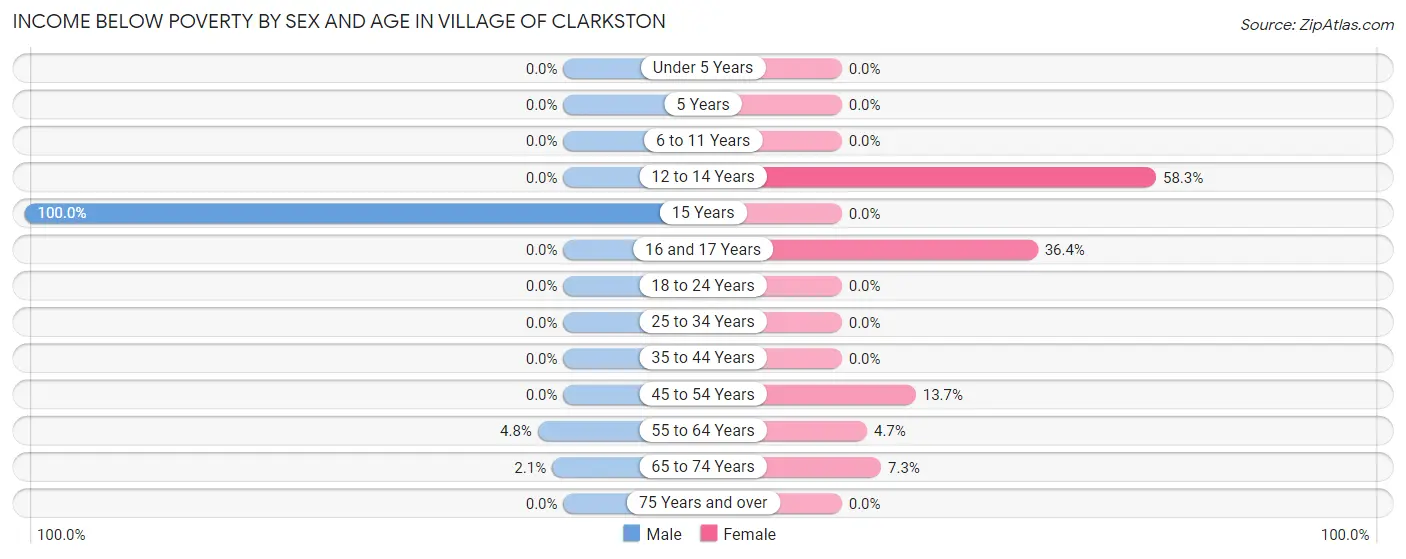
| Age Bracket | Male | Female |
| Under 5 Years | 0 (0.0%) | 0 (0.0%) |
| 5 Years | 0 (0.0%) | 0 (0.0%) |
| 6 to 11 Years | 0 (0.0%) | 0 (0.0%) |
| 12 to 14 Years | 0 (0.0%) | 14 (58.3%) |
| 15 Years | 7 (100.0%) | 0 (0.0%) |
| 16 and 17 Years | 0 (0.0%) | 8 (36.4%) |
| 18 to 24 Years | 0 (0.0%) | 0 (0.0%) |
| 25 to 34 Years | 0 (0.0%) | 0 (0.0%) |
| 35 to 44 Years | 0 (0.0%) | 0 (0.0%) |
| 45 to 54 Years | 0 (0.0%) | 7 (13.7%) |
| 55 to 64 Years | 3 (4.8%) | 3 (4.7%) |
| 65 to 74 Years | 2 (2.1%) | 7 (7.3%) |
| 75 Years and over | 0 (0.0%) | 0 (0.0%) |
| Total | 12 (3.1%) | 39 (10.1%) |
Income Above Poverty by Sex and Age in Village of Clarkston
According to the poverty statistics in Village of Clarkston, males aged under 5 years and females aged under 5 years are the age groups that are most secure financially, with 100.0% of males and 100.0% of females in these age groups living above the poverty line.
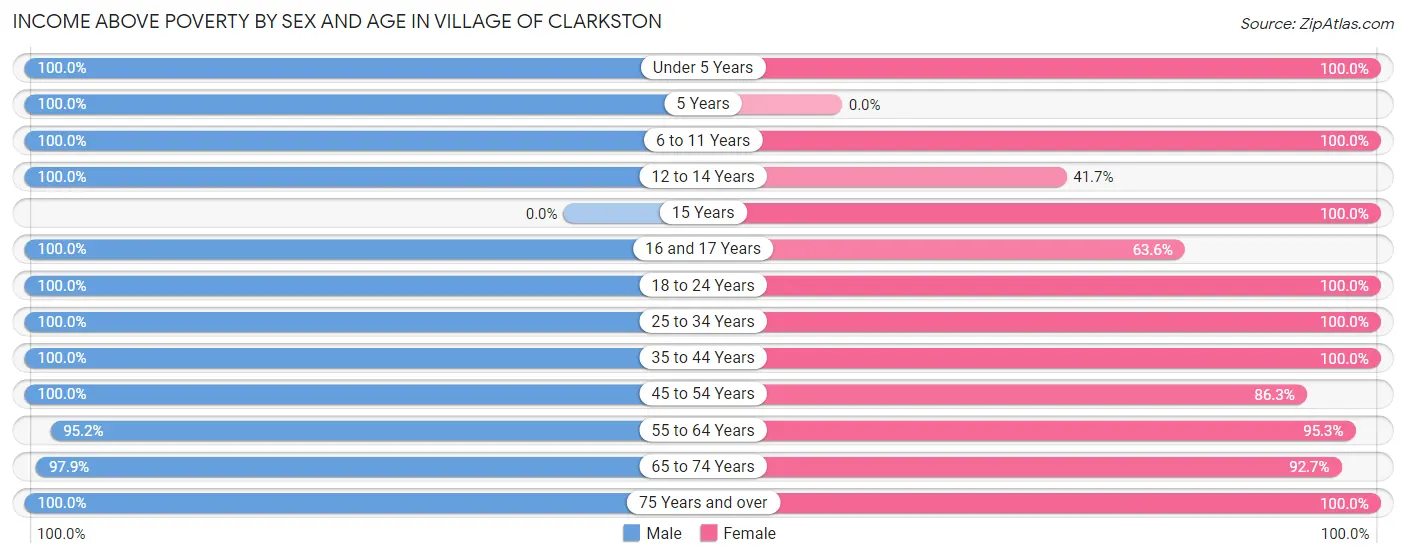
| Age Bracket | Male | Female |
| Under 5 Years | 24 (100.0%) | 8 (100.0%) |
| 5 Years | 4 (100.0%) | 0 (0.0%) |
| 6 to 11 Years | 24 (100.0%) | 16 (100.0%) |
| 12 to 14 Years | 6 (100.0%) | 10 (41.7%) |
| 15 Years | 0 (0.0%) | 9 (100.0%) |
| 16 and 17 Years | 11 (100.0%) | 14 (63.6%) |
| 18 to 24 Years | 20 (100.0%) | 13 (100.0%) |
| 25 to 34 Years | 28 (100.0%) | 33 (100.0%) |
| 35 to 44 Years | 29 (100.0%) | 23 (100.0%) |
| 45 to 54 Years | 37 (100.0%) | 44 (86.3%) |
| 55 to 64 Years | 60 (95.2%) | 61 (95.3%) |
| 65 to 74 Years | 93 (97.9%) | 89 (92.7%) |
| 75 Years and over | 40 (100.0%) | 28 (100.0%) |
| Total | 376 (96.9%) | 348 (89.9%) |
Income Below Poverty Among Married-Couple Families in Village of Clarkston
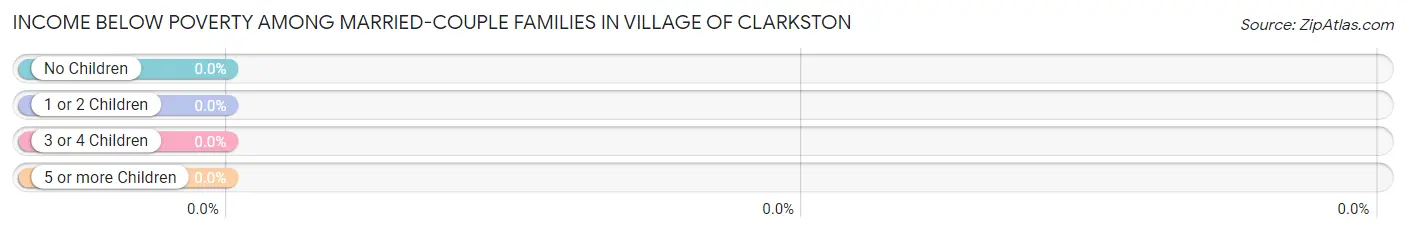
| Children | Above Poverty | Below Poverty |
| No Children | 138 (100.0%) | 0 (0.0%) |
| 1 or 2 Children | 39 (100.0%) | 0 (0.0%) |
| 3 or 4 Children | 10 (100.0%) | 0 (0.0%) |
| 5 or more Children | 0 (0.0%) | 0 (0.0%) |
| Total | 187 (100.0%) | 0 (0.0%) |
Income Below Poverty Among Single-Parent Households in Village of Clarkston
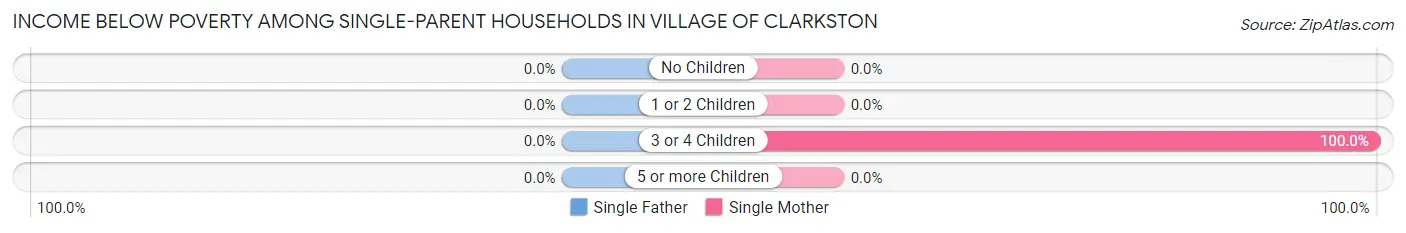
| Children | Single Father | Single Mother |
| No Children | 0 (0.0%) | 0 (0.0%) |
| 1 or 2 Children | 0 (0.0%) | 0 (0.0%) |
| 3 or 4 Children | 0 (0.0%) | 7 (100.0%) |
| 5 or more Children | 0 (0.0%) | 0 (0.0%) |
| Total | 0 (0.0%) | 7 (24.1%) |
Income Below Poverty Among Married-Couple vs Single-Parent Households in Village of Clarkston
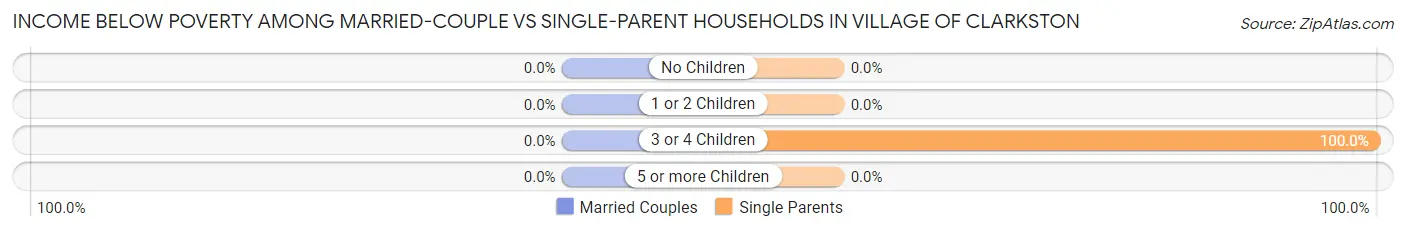
| Children | Married-Couple Families | Single-Parent Households |
| No Children | 0 (0.0%) | 0 (0.0%) |
| 1 or 2 Children | 0 (0.0%) | 0 (0.0%) |
| 3 or 4 Children | 0 (0.0%) | 7 (100.0%) |
| 5 or more Children | 0 (0.0%) | 0 (0.0%) |
| Total | 0 (0.0%) | 7 (20.0%) |
Race in Village of Clarkston
The most populous races in Village of Clarkston are White / Caucasian (707 | 91.2%), Black / African American (36 | 4.6%), and Two or more Races (31 | 4.0%).

| Race | # Population | % Population |
| Asian | 1 | 0.1% |
| Black / African American | 36 | 4.6% |
| Hawaiian / Pacific | 0 | 0.0% |
| Hispanic or Latino | 14 | 1.8% |
| Native / Alaskan | 0 | 0.0% |
| White / Caucasian | 707 | 91.2% |
| Two or more Races | 31 | 4.0% |
| Some other Race | 0 | 0.0% |
| Total | 775 | 100.0% |
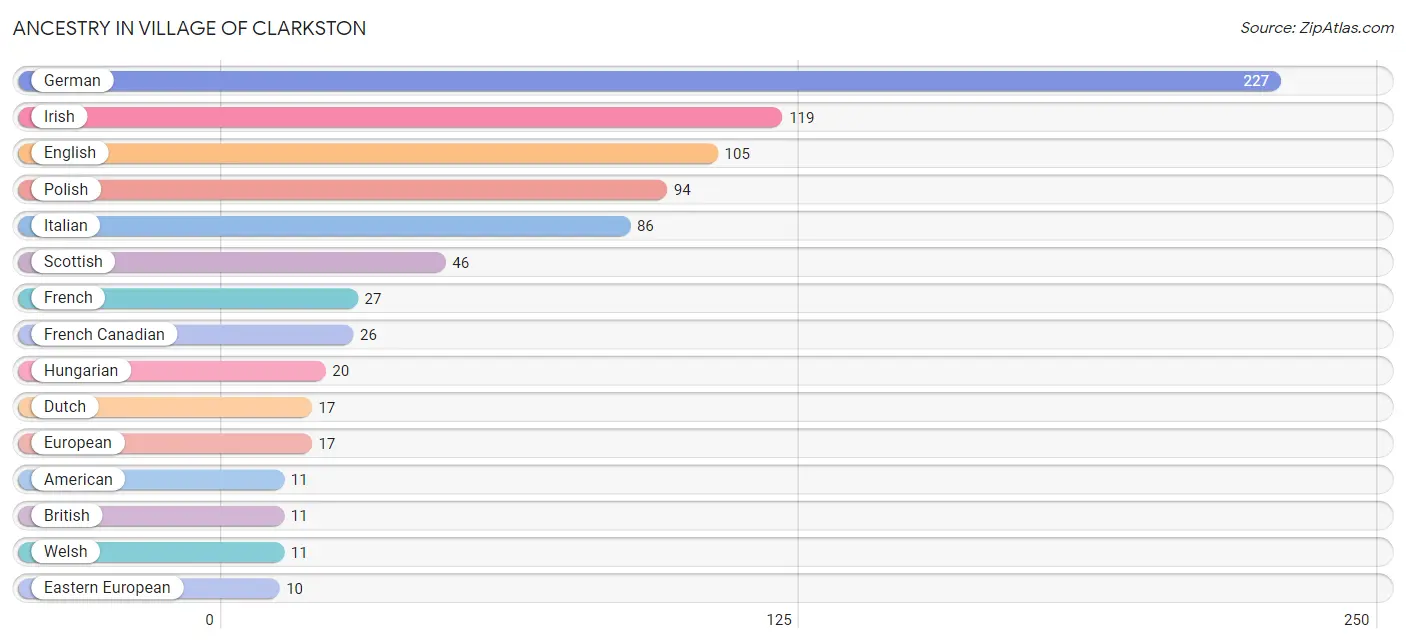
Ancestry in Village of Clarkston
The most populous ancestries reported in Village of Clarkston are German (227 | 29.3%), Irish (119 | 15.3%), English (105 | 13.6%), Polish (94 | 12.1%), and Italian (86 | 11.1%), together accounting for 81.4% of all Village of Clarkston residents.
| Ancestry | # Population | % Population |
| African | 3 | 0.4% |
| American | 11 | 1.4% |
| Arab | 1 | 0.1% |
| British | 11 | 1.4% |
| Canadian | 5 | 0.6% |
| Cherokee | 7 | 0.9% |
| Chippewa | 1 | 0.1% |
| Croatian | 2 | 0.3% |
| Czech | 5 | 0.6% |
| Dutch | 17 | 2.2% |
| Eastern European | 10 | 1.3% |
| English | 105 | 13.6% |
| European | 17 | 2.2% |
| Finnish | 3 | 0.4% |
| French | 27 | 3.5% |
| French Canadian | 26 | 3.4% |
| German | 227 | 29.3% |
| Greek | 9 | 1.2% |
| Hungarian | 20 | 2.6% |
| Irish | 119 | 15.3% |
| Italian | 86 | 11.1% |
| Korean | 5 | 0.6% |
| Lebanese | 1 | 0.1% |
| Macedonian | 4 | 0.5% |
| Mexican | 4 | 0.5% |
| Norwegian | 7 | 0.9% |
| Ottawa | 6 | 0.8% |
| Polish | 94 | 12.1% |
| Russian | 9 | 1.2% |
| Scotch-Irish | 5 | 0.6% |
| Scottish | 46 | 5.9% |
| Serbian | 3 | 0.4% |
| Spanish | 10 | 1.3% |
| Subsaharan African | 3 | 0.4% |
| Swedish | 3 | 0.4% |
| Swiss | 3 | 0.4% |
| Turkish | 6 | 0.8% |
| Ukrainian | 5 | 0.6% |
| Welsh | 11 | 1.4% | View All 39 Rows |
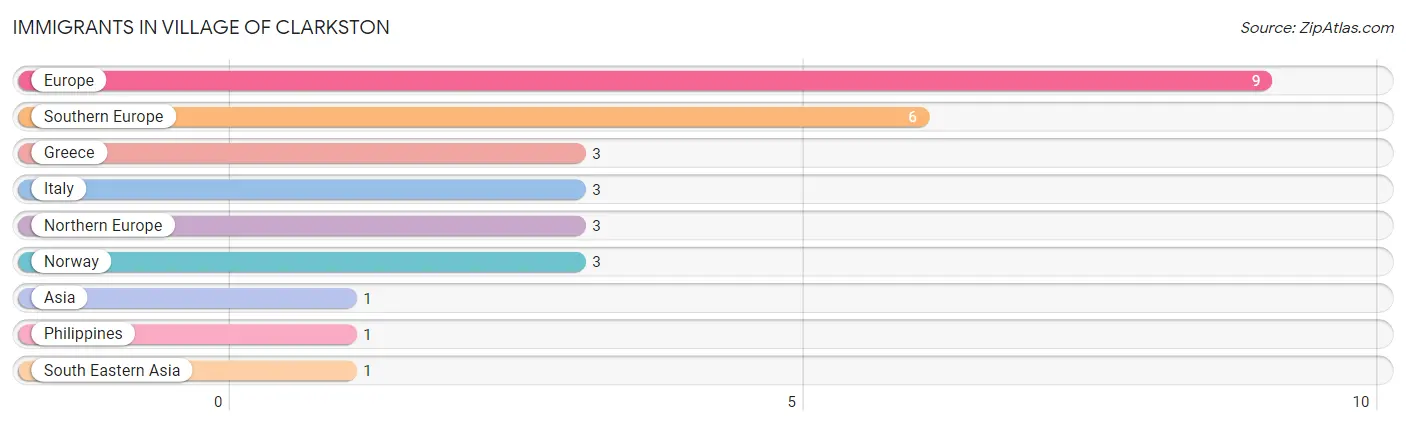
Immigrants in Village of Clarkston
The most numerous immigrant groups reported in Village of Clarkston came from Europe (9 | 1.2%), Southern Europe (6 | 0.8%), Greece (3 | 0.4%), Italy (3 | 0.4%), and Northern Europe (3 | 0.4%), together accounting for 3.1% of all Village of Clarkston residents.
| Immigration Origin | # Population | % Population |
| Asia | 1 | 0.1% |
| Europe | 9 | 1.2% |
| Greece | 3 | 0.4% |
| Italy | 3 | 0.4% |
| Northern Europe | 3 | 0.4% |
| Norway | 3 | 0.4% |
| Philippines | 1 | 0.1% |
| South Eastern Asia | 1 | 0.1% |
| Southern Europe | 6 | 0.8% | View All 9 Rows |
Sex and Age in Village of Clarkston
Sex and Age in Village of Clarkston
The most populous age groups in Village of Clarkston are 70 to 74 Years (78 | 20.1%) for men and 70 to 74 Years (67 | 17.3%) for women.
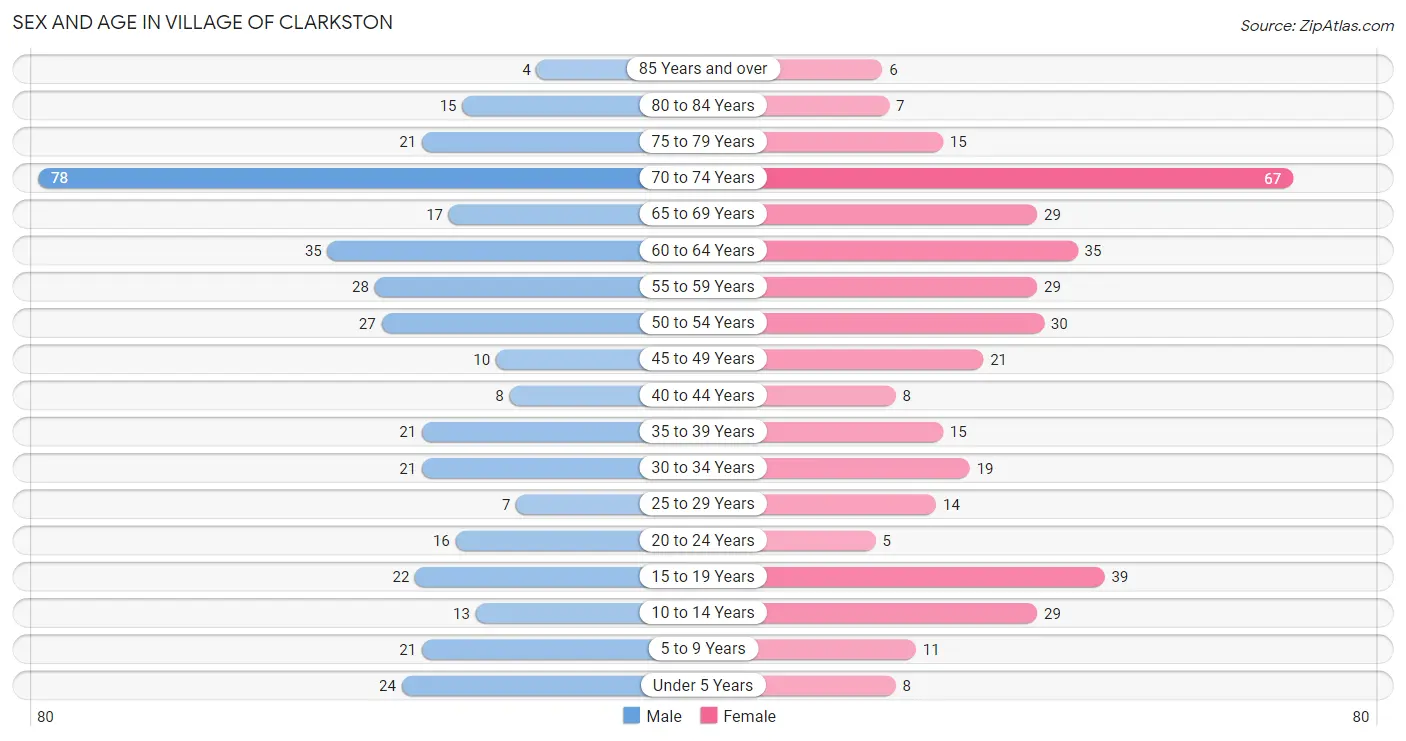
| Age Bracket | Male | Female |
| Under 5 Years | 24 (6.2%) | 8 (2.1%) |
| 5 to 9 Years | 21 (5.4%) | 11 (2.8%) |
| 10 to 14 Years | 13 (3.4%) | 29 (7.5%) |
| 15 to 19 Years | 22 (5.7%) | 39 (10.1%) |
| 20 to 24 Years | 16 (4.1%) | 5 (1.3%) |
| 25 to 29 Years | 7 (1.8%) | 14 (3.6%) |
| 30 to 34 Years | 21 (5.4%) | 19 (4.9%) |
| 35 to 39 Years | 21 (5.4%) | 15 (3.9%) |
| 40 to 44 Years | 8 (2.1%) | 8 (2.1%) |
| 45 to 49 Years | 10 (2.6%) | 21 (5.4%) |
| 50 to 54 Years | 27 (7.0%) | 30 (7.7%) |
| 55 to 59 Years | 28 (7.2%) | 29 (7.5%) |
| 60 to 64 Years | 35 (9.0%) | 35 (9.0%) |
| 65 to 69 Years | 17 (4.4%) | 29 (7.5%) |
| 70 to 74 Years | 78 (20.1%) | 67 (17.3%) |
| 75 to 79 Years | 21 (5.4%) | 15 (3.9%) |
| 80 to 84 Years | 15 (3.9%) | 7 (1.8%) |
| 85 Years and over | 4 (1.0%) | 6 (1.5%) |
| Total | 388 (100.0%) | 387 (100.0%) |
Families and Households in Village of Clarkston
Median Family Size in Village of Clarkston
The median family size in Village of Clarkston is 2.88 persons per family, with single female/mother families (29 | 13.1%) accounting for the largest median family size of 3.45 persons per family. On the other hand, married-couple families (187 | 84.2%) represent the smallest median family size with 2.78 persons per family.
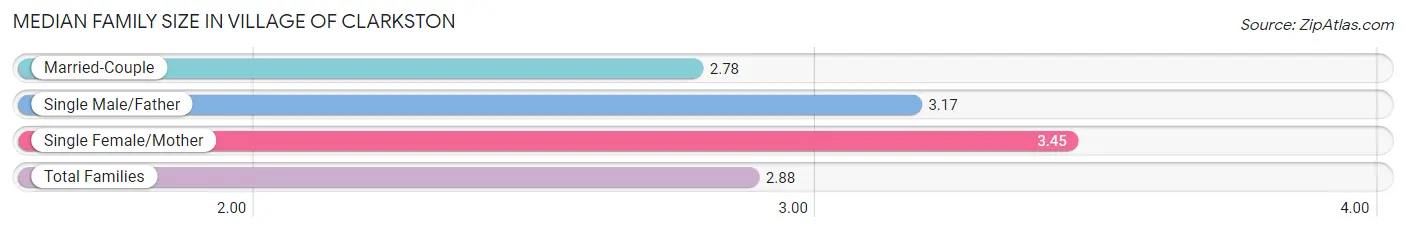
| Family Type | # Families | Family Size |
| Married-Couple | 187 (84.2%) | 2.78 |
| Single Male/Father | 6 (2.7%) | 3.17 |
| Single Female/Mother | 29 (13.1%) | 3.45 |
| Total Families | 222 (100.0%) | 2.88 |
Median Household Size in Village of Clarkston
The median household size in Village of Clarkston is 2.21 persons per household, with single female/mother households (29 | 8.3%) accounting for the largest median household size of 3.62 persons per household. non-family households (129 | 36.7%) represent the smallest median household size with 1.02 persons per household.
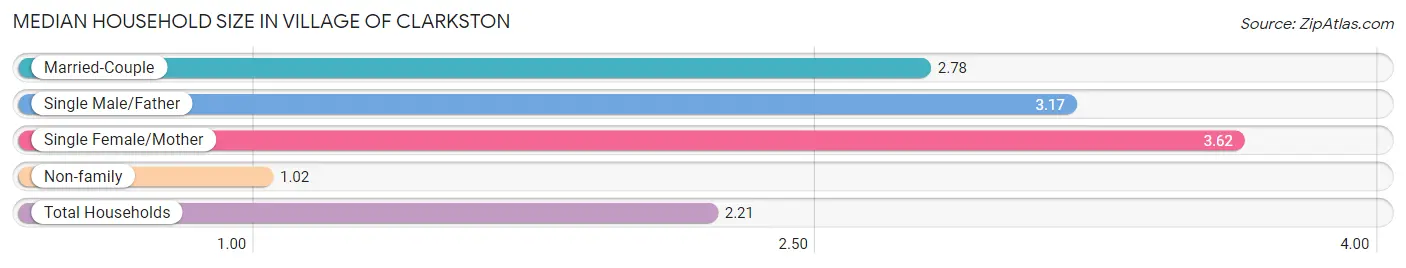
| Household Type | # Households | Household Size |
| Married-Couple | 187 (53.3%) | 2.78 |
| Single Male/Father | 6 (1.7%) | 3.17 |
| Single Female/Mother | 29 (8.3%) | 3.62 |
| Non-family | 129 (36.7%) | 1.02 |
| Total Households | 351 (100.0%) | 2.21 |
Household Size by Marriage Status in Village of Clarkston
Out of a total of 351 households in Village of Clarkston, 222 (63.2%) are family households, while 129 (36.7%) are nonfamily households. The most numerous type of family households are 2-person households, comprising 131, and the most common type of nonfamily households are 1-person households, comprising 127.
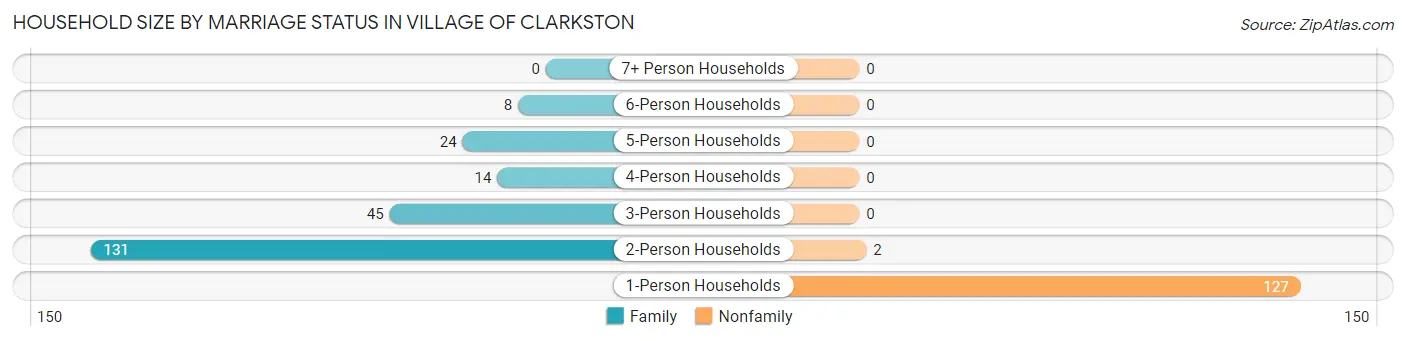
| Household Size | Family Households | Nonfamily Households |
| 1-Person Households | - | 127 (36.2%) |
| 2-Person Households | 131 (37.3%) | 2 (0.6%) |
| 3-Person Households | 45 (12.8%) | 0 (0.0%) |
| 4-Person Households | 14 (4.0%) | 0 (0.0%) |
| 5-Person Households | 24 (6.8%) | 0 (0.0%) |
| 6-Person Households | 8 (2.3%) | 0 (0.0%) |
| 7+ Person Households | 0 (0.0%) | 0 (0.0%) |
| Total | 222 (63.2%) | 129 (36.7%) |
Female Fertility in Village of Clarkston
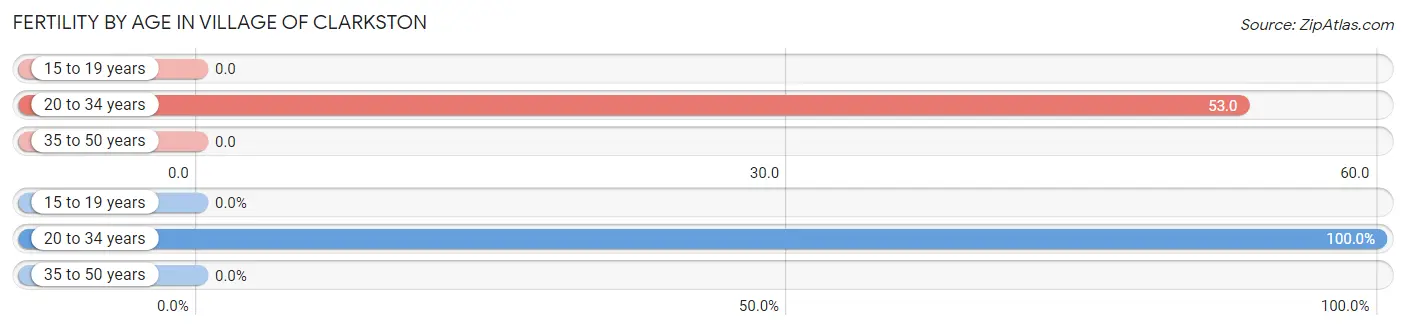
Fertility by Age in Village of Clarkston
Average fertility rate in Village of Clarkston is 16.0 births per 1,000 women. Women in the age bracket of 20 to 34 years have the highest fertility rate with 53.0 births per 1,000 women. Women in the age bracket of 20 to 34 years acount for 100.0% of all women with births.
| Age Bracket | Women with Births | Births / 1,000 Women |
| 15 to 19 years | 0 (0.0%) | 0.0 |
| 20 to 34 years | 2 (100.0%) | 53.0 |
| 35 to 50 years | 0 (0.0%) | 0.0 |
| Total | 2 (100.0%) | 16.0 |
Fertility by Age by Marriage Status in Village of Clarkston
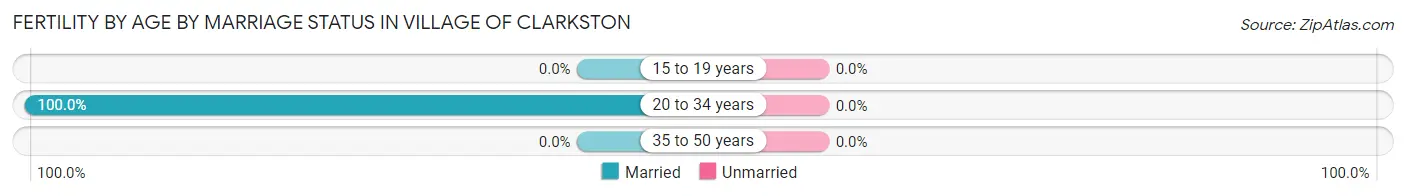
| Age Bracket | Married | Unmarried |
| 15 to 19 years | 0 (0.0%) | 0 (0.0%) |
| 20 to 34 years | 2 (100.0%) | 0 (0.0%) |
| 35 to 50 years | 0 (0.0%) | 0 (0.0%) |
| Total | 2 (100.0%) | 0 (0.0%) |
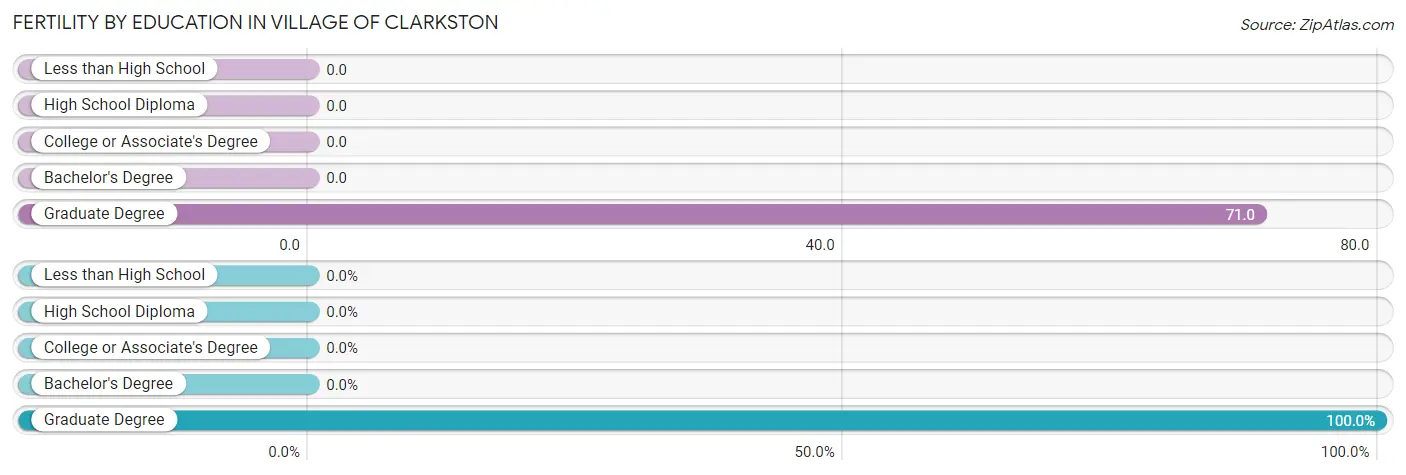
Fertility by Education in Village of Clarkston
| Educational Attainment | Women with Births | Births / 1,000 Women |
| Less than High School | 0 (0.0%) | 0.0 |
| High School Diploma | 0 (0.0%) | 0.0 |
| College or Associate's Degree | 0 (0.0%) | 0.0 |
| Bachelor's Degree | 0 (0.0%) | 0.0 |
| Graduate Degree | 2 (100.0%) | 71.0 |
| Total | 2 (100.0%) | 16.0 |
Fertility by Education by Marriage Status in Village of Clarkston
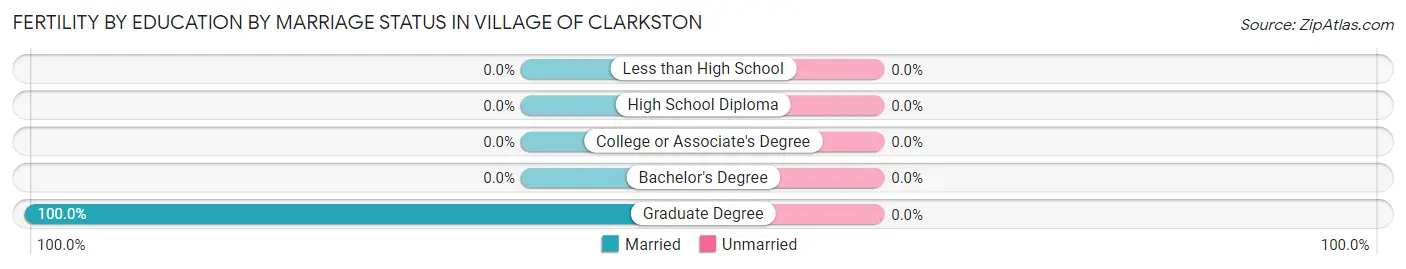
| Educational Attainment | Married | Unmarried |
| Less than High School | 0 (0.0%) | 0 (0.0%) |
| High School Diploma | 0 (0.0%) | 0 (0.0%) |
| College or Associate's Degree | 0 (0.0%) | 0 (0.0%) |
| Bachelor's Degree | 0 (0.0%) | 0 (0.0%) |
| Graduate Degree | 2 (100.0%) | 0 (0.0%) |
| Total | 2 (100.0%) | 0 (0.0%) |
Employment Characteristics in Village of Clarkston
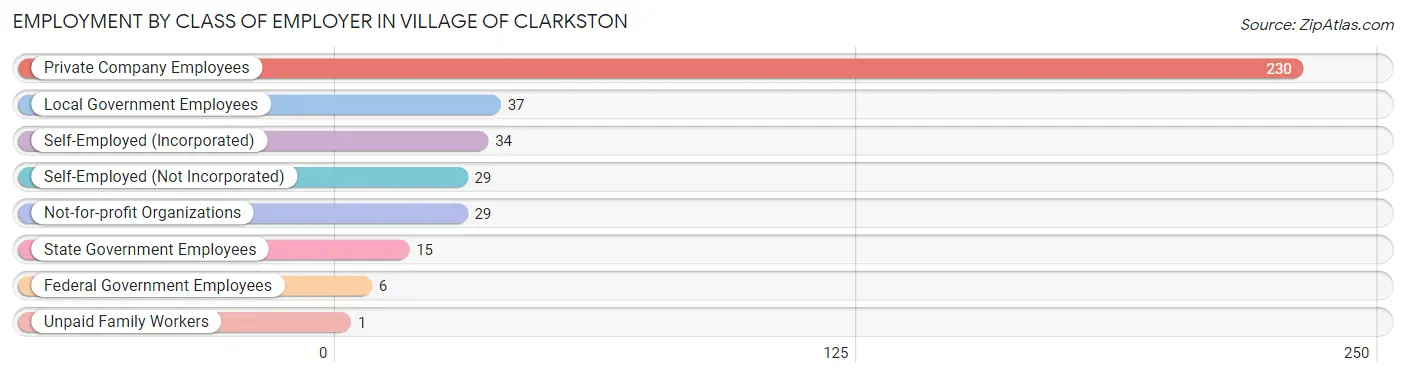
Employment by Class of Employer in Village of Clarkston
Among the 381 employed individuals in Village of Clarkston, private company employees (230 | 60.4%), local government employees (37 | 9.7%), and self-employed (incorporated) (34 | 8.9%) make up the most common classes of employment.
| Employer Class | # Employees | % Employees |
| Private Company Employees | 230 | 60.4% |
| Self-Employed (Incorporated) | 34 | 8.9% |
| Self-Employed (Not Incorporated) | 29 | 7.6% |
| Not-for-profit Organizations | 29 | 7.6% |
| Local Government Employees | 37 | 9.7% |
| State Government Employees | 15 | 3.9% |
| Federal Government Employees | 6 | 1.6% |
| Unpaid Family Workers | 1 | 0.3% |
| Total | 381 | 100.0% |
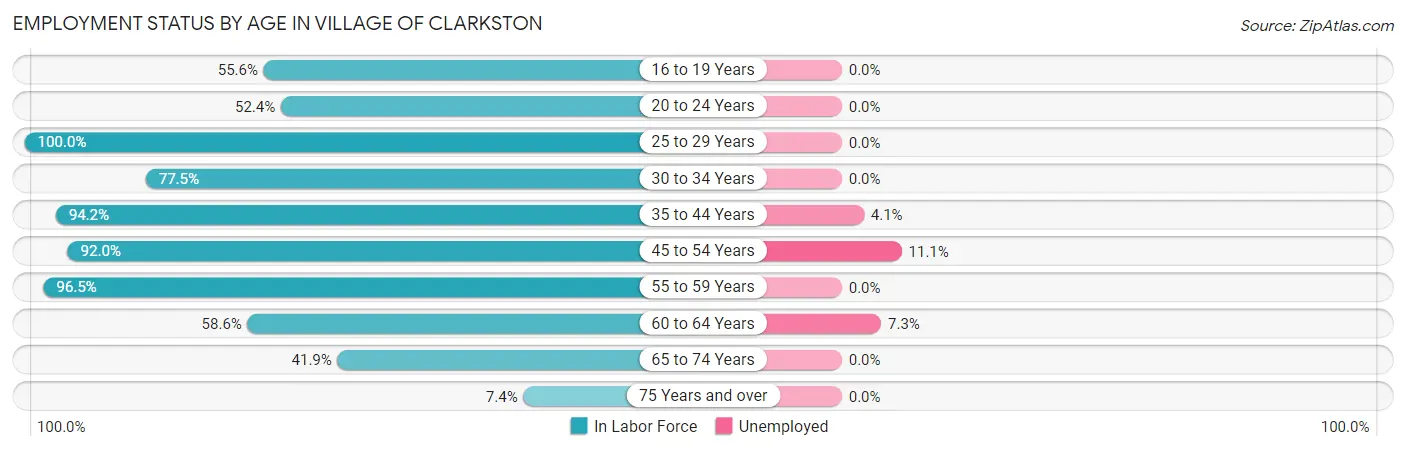
Employment Status by Age in Village of Clarkston
According to the labor force statistics for Village of Clarkston, out of the total population over 16 years of age (653), 61.1% or 399 individuals are in the labor force, with 3.5% or 14 of them unemployed. The age group with the highest labor force participation rate is 25 to 29 years, with 100.0% or 21 individuals in the labor force. Within the labor force, the 45 to 54 years age range has the highest percentage of unemployed individuals, with 11.1% or 9 of them being unemployed.
| Age Bracket | In Labor Force | Unemployed |
| 16 to 19 Years | 25 (55.6%) | 0 (0.0%) |
| 20 to 24 Years | 11 (52.4%) | 0 (0.0%) |
| 25 to 29 Years | 21 (100.0%) | 0 (0.0%) |
| 30 to 34 Years | 31 (77.5%) | 0 (0.0%) |
| 35 to 44 Years | 49 (94.2%) | 2 (4.1%) |
| 45 to 54 Years | 81 (92.0%) | 9 (11.1%) |
| 55 to 59 Years | 55 (96.5%) | 0 (0.0%) |
| 60 to 64 Years | 41 (58.6%) | 3 (7.3%) |
| 65 to 74 Years | 80 (41.9%) | 0 (0.0%) |
| 75 Years and over | 5 (7.4%) | 0 (0.0%) |
| Total | 399 (61.1%) | 14 (3.5%) |
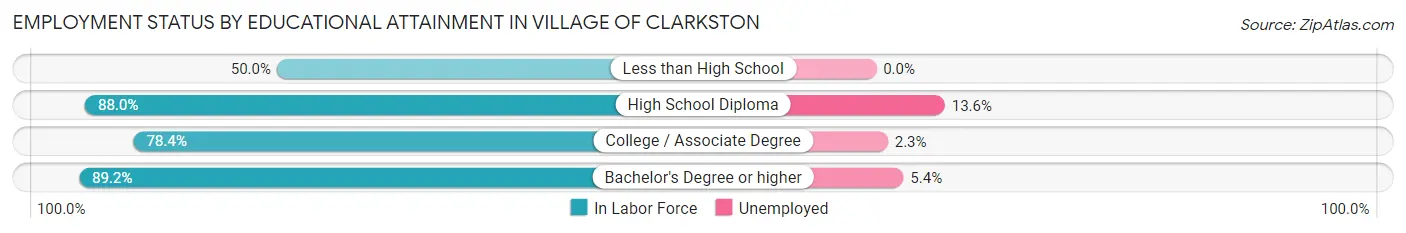
Employment Status by Educational Attainment in Village of Clarkston
According to labor force statistics for Village of Clarkston, 84.8% of individuals (278) out of the total population between 25 and 64 years of age (328) are in the labor force, with 5.0% or 14 of them being unemployed. The group with the highest labor force participation rate are those with the educational attainment of bachelor's degree or higher, with 89.2% or 166 individuals in the labor force. Within the labor force, individuals with high school diploma education have the highest percentage of unemployment, with 13.6% or 3 of them being unemployed.
| Educational Attainment | In Labor Force | Unemployed |
| Less than High School | 3 (50.0%) | 0 (0.0%) |
| High School Diploma | 22 (88.0%) | 3 (13.6%) |
| College / Associate Degree | 87 (78.4%) | 3 (2.3%) |
| Bachelor's Degree or higher | 166 (89.2%) | 10 (5.4%) |
| Total | 278 (84.8%) | 16 (5.0%) |
Employment Occupations by Sex in Village of Clarkston
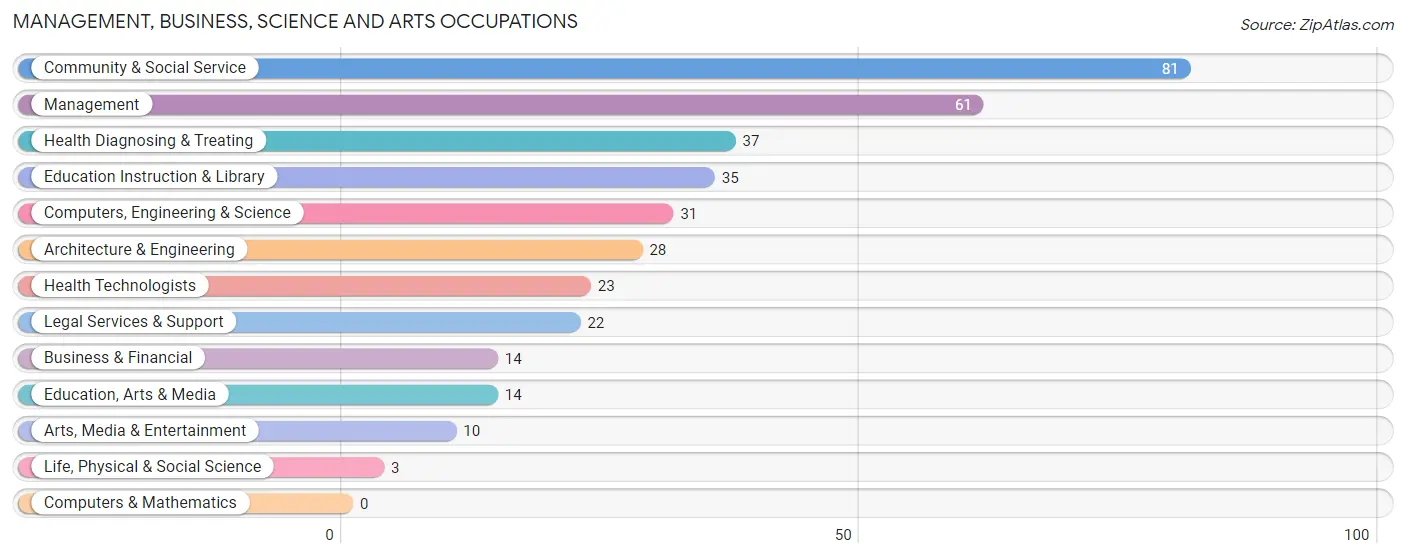
Management, Business, Science and Arts Occupations
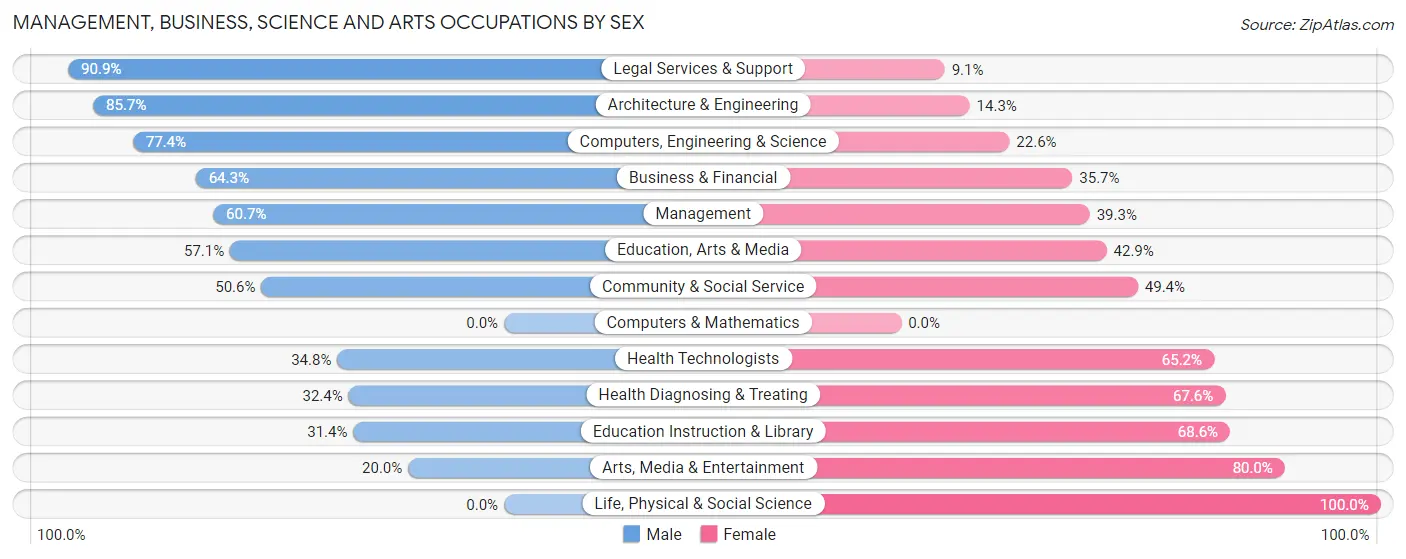
The most common Management, Business, Science and Arts occupations in Village of Clarkston are Community & Social Service (81 | 21.0%), Management (61 | 15.8%), Health Diagnosing & Treating (37 | 9.6%), Education Instruction & Library (35 | 9.1%), and Computers, Engineering & Science (31 | 8.1%).
Management, Business, Science and Arts Occupations by Sex
Within the Management, Business, Science and Arts occupations in Village of Clarkston, the most male-oriented occupations are Legal Services & Support (90.9%), Architecture & Engineering (85.7%), and Computers, Engineering & Science (77.4%), while the most female-oriented occupations are Life, Physical & Social Science (100.0%), Arts, Media & Entertainment (80.0%), and Education Instruction & Library (68.6%).
| Occupation | Male | Female |
| Management | 37 (60.7%) | 24 (39.3%) |
| Business & Financial | 9 (64.3%) | 5 (35.7%) |
| Computers, Engineering & Science | 24 (77.4%) | 7 (22.6%) |
| Computers & Mathematics | 0 (0.0%) | 0 (0.0%) |
| Architecture & Engineering | 24 (85.7%) | 4 (14.3%) |
| Life, Physical & Social Science | 0 (0.0%) | 3 (100.0%) |
| Community & Social Service | 41 (50.6%) | 40 (49.4%) |
| Education, Arts & Media | 8 (57.1%) | 6 (42.9%) |
| Legal Services & Support | 20 (90.9%) | 2 (9.1%) |
| Education Instruction & Library | 11 (31.4%) | 24 (68.6%) |
| Arts, Media & Entertainment | 2 (20.0%) | 8 (80.0%) |
| Health Diagnosing & Treating | 12 (32.4%) | 25 (67.6%) |
| Health Technologists | 8 (34.8%) | 15 (65.2%) |
| Total (Category) | 123 (54.9%) | 101 (45.1%) |
| Total (Overall) | 202 (52.5%) | 183 (47.5%) |
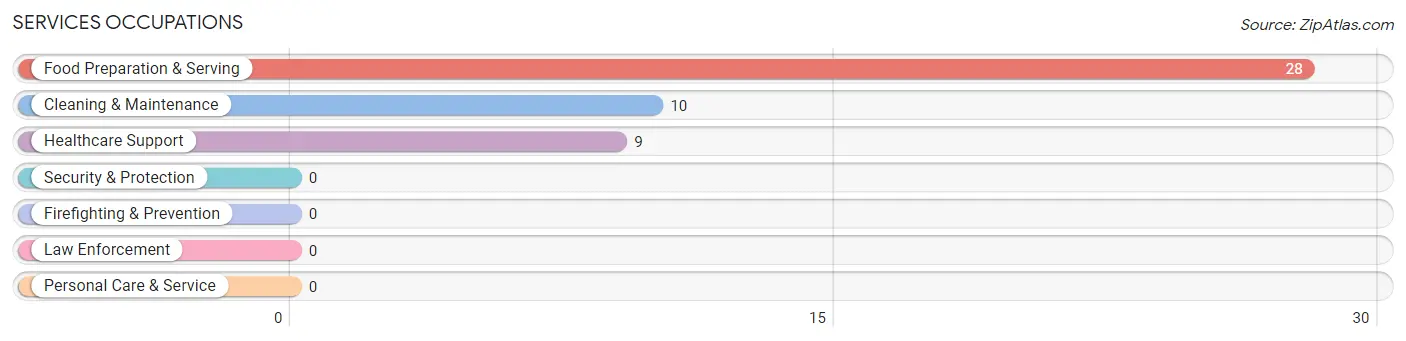
Services Occupations
The most common Services occupations in Village of Clarkston are Food Preparation & Serving (28 | 7.3%), Cleaning & Maintenance (10 | 2.6%), and Healthcare Support (9 | 2.3%).
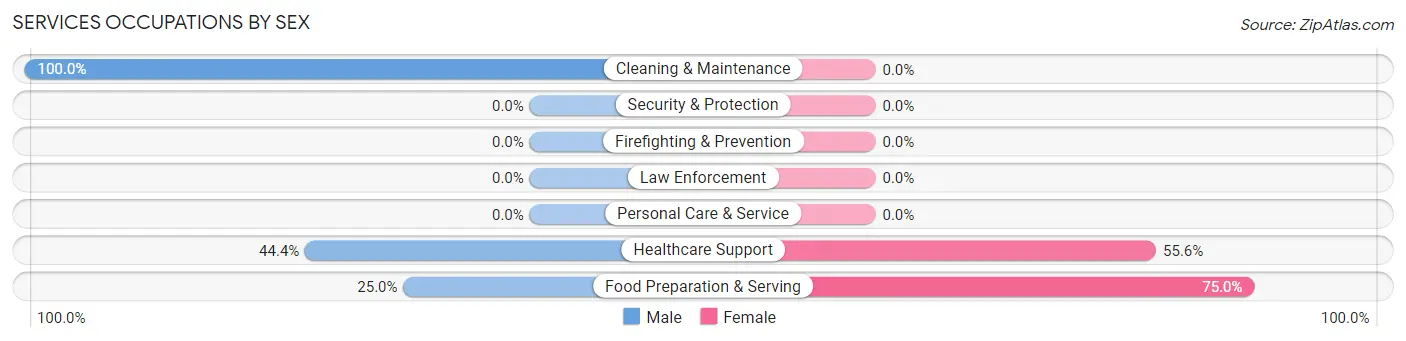
Services Occupations by Sex
Within the Services occupations in Village of Clarkston, the most male-oriented occupations are Cleaning & Maintenance (100.0%), Healthcare Support (44.4%), and Food Preparation & Serving (25.0%), while the most female-oriented occupations are Food Preparation & Serving (75.0%), and Healthcare Support (55.6%).
| Occupation | Male | Female |
| Healthcare Support | 4 (44.4%) | 5 (55.6%) |
| Security & Protection | 0 (0.0%) | 0 (0.0%) |
| Firefighting & Prevention | 0 (0.0%) | 0 (0.0%) |
| Law Enforcement | 0 (0.0%) | 0 (0.0%) |
| Food Preparation & Serving | 7 (25.0%) | 21 (75.0%) |
| Cleaning & Maintenance | 10 (100.0%) | 0 (0.0%) |
| Personal Care & Service | 0 (0.0%) | 0 (0.0%) |
| Total (Category) | 21 (44.7%) | 26 (55.3%) |
| Total (Overall) | 202 (52.5%) | 183 (47.5%) |
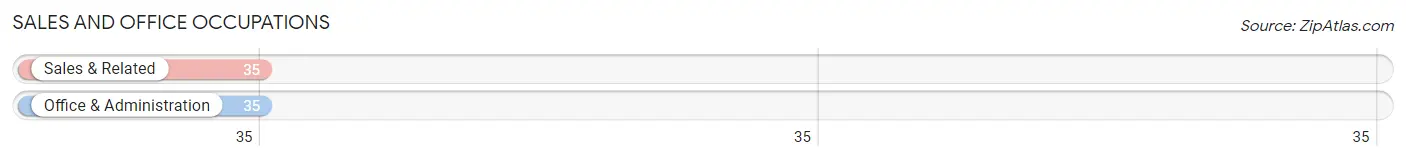
Sales and Office Occupations
The most common Sales and Office occupations in Village of Clarkston are Sales & Related (35 | 9.1%), and Office & Administration (35 | 9.1%).
Sales and Office Occupations by Sex
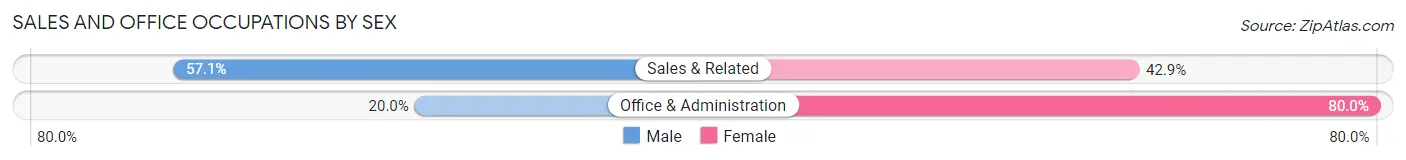
| Occupation | Male | Female |
| Sales & Related | 20 (57.1%) | 15 (42.9%) |
| Office & Administration | 7 (20.0%) | 28 (80.0%) |
| Total (Category) | 27 (38.6%) | 43 (61.4%) |
| Total (Overall) | 202 (52.5%) | 183 (47.5%) |
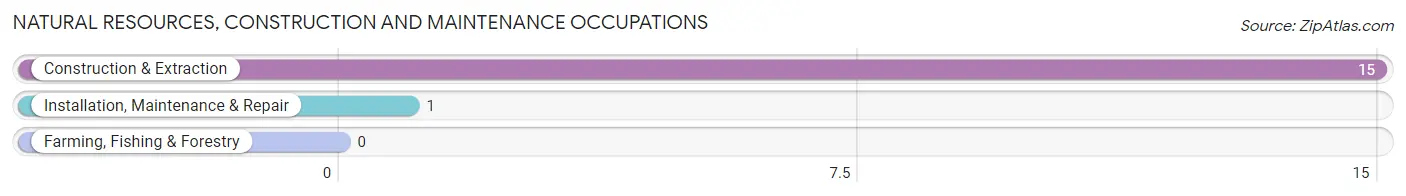
Natural Resources, Construction and Maintenance Occupations
The most common Natural Resources, Construction and Maintenance occupations in Village of Clarkston are Construction & Extraction (15 | 3.9%), and Installation, Maintenance & Repair (1 | 0.3%).
Natural Resources, Construction and Maintenance Occupations by Sex
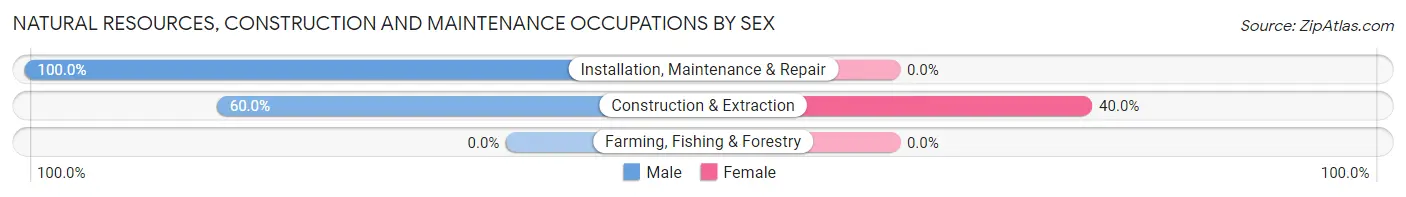
| Occupation | Male | Female |
| Farming, Fishing & Forestry | 0 (0.0%) | 0 (0.0%) |
| Construction & Extraction | 9 (60.0%) | 6 (40.0%) |
| Installation, Maintenance & Repair | 1 (100.0%) | 0 (0.0%) |
| Total (Category) | 10 (62.5%) | 6 (37.5%) |
| Total (Overall) | 202 (52.5%) | 183 (47.5%) |
Production, Transportation and Moving Occupations
The most common Production, Transportation and Moving occupations in Village of Clarkston are Material Moving (13 | 3.4%), Production (11 | 2.9%), and Transportation (4 | 1.0%).
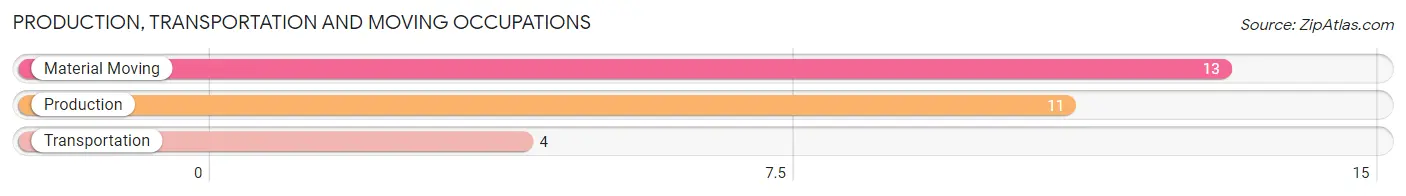
Production, Transportation and Moving Occupations by Sex
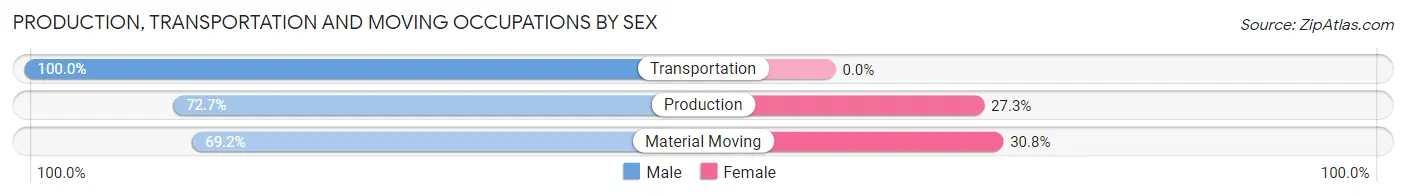
| Occupation | Male | Female |
| Production | 8 (72.7%) | 3 (27.3%) |
| Transportation | 4 (100.0%) | 0 (0.0%) |
| Material Moving | 9 (69.2%) | 4 (30.8%) |
| Total (Category) | 21 (75.0%) | 7 (25.0%) |
| Total (Overall) | 202 (52.5%) | 183 (47.5%) |
Employment Industries by Sex in Village of Clarkston
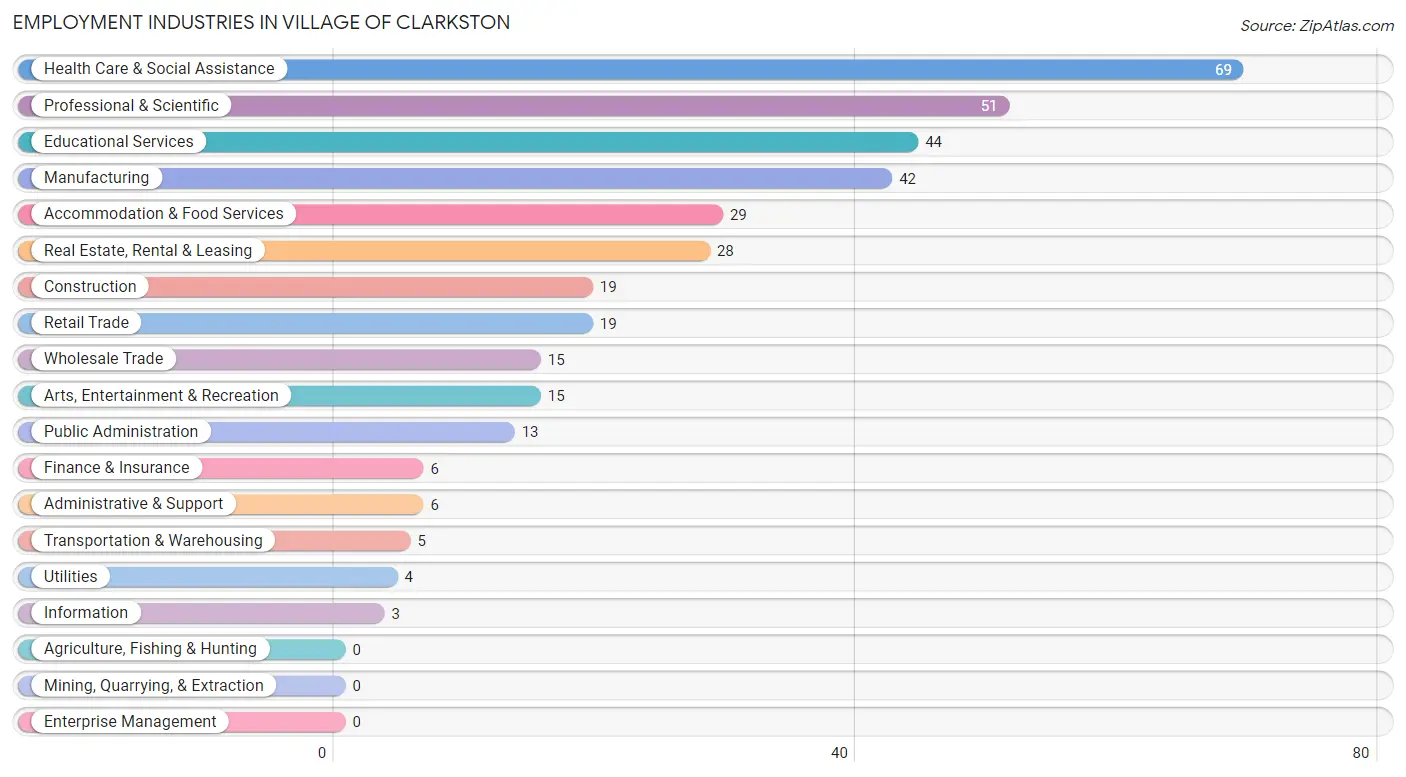
Employment Industries in Village of Clarkston
The major employment industries in Village of Clarkston include Health Care & Social Assistance (69 | 17.9%), Professional & Scientific (51 | 13.3%), Educational Services (44 | 11.4%), Manufacturing (42 | 10.9%), and Accommodation & Food Services (29 | 7.5%).
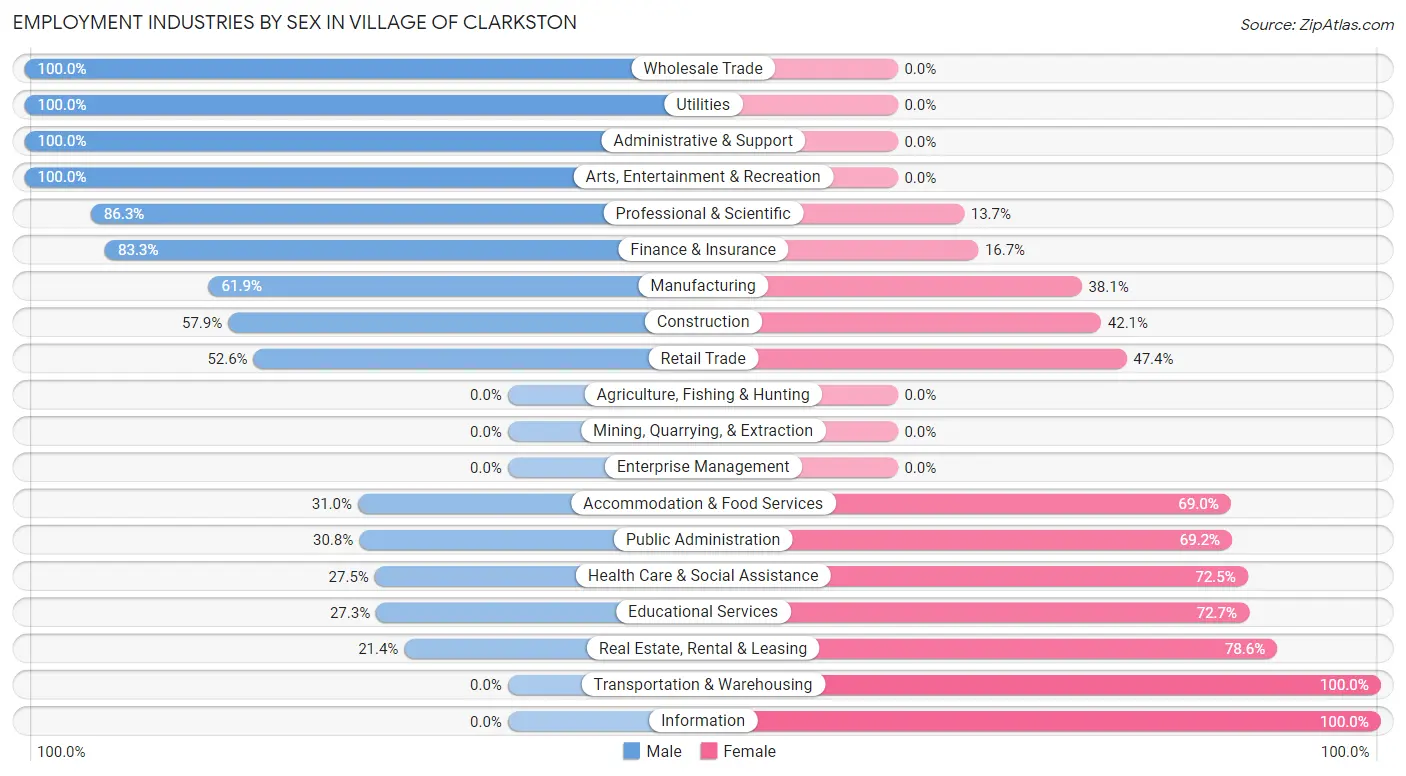
Employment Industries by Sex in Village of Clarkston
The Village of Clarkston industries that see more men than women are Wholesale Trade (100.0%), Utilities (100.0%), and Administrative & Support (100.0%), whereas the industries that tend to have a higher number of women are Transportation & Warehousing (100.0%), Information (100.0%), and Real Estate, Rental & Leasing (78.6%).
| Industry | Male | Female |
| Agriculture, Fishing & Hunting | 0 (0.0%) | 0 (0.0%) |
| Mining, Quarrying, & Extraction | 0 (0.0%) | 0 (0.0%) |
| Construction | 11 (57.9%) | 8 (42.1%) |
| Manufacturing | 26 (61.9%) | 16 (38.1%) |
| Wholesale Trade | 15 (100.0%) | 0 (0.0%) |
| Retail Trade | 10 (52.6%) | 9 (47.4%) |
| Transportation & Warehousing | 0 (0.0%) | 5 (100.0%) |
| Utilities | 4 (100.0%) | 0 (0.0%) |
| Information | 0 (0.0%) | 3 (100.0%) |
| Finance & Insurance | 5 (83.3%) | 1 (16.7%) |
| Real Estate, Rental & Leasing | 6 (21.4%) | 22 (78.6%) |
| Professional & Scientific | 44 (86.3%) | 7 (13.7%) |
| Enterprise Management | 0 (0.0%) | 0 (0.0%) |
| Administrative & Support | 6 (100.0%) | 0 (0.0%) |
| Educational Services | 12 (27.3%) | 32 (72.7%) |
| Health Care & Social Assistance | 19 (27.5%) | 50 (72.5%) |
| Arts, Entertainment & Recreation | 15 (100.0%) | 0 (0.0%) |
| Accommodation & Food Services | 9 (31.0%) | 20 (69.0%) |
| Public Administration | 4 (30.8%) | 9 (69.2%) |
| Total | 202 (52.5%) | 183 (47.5%) |
Education in Village of Clarkston
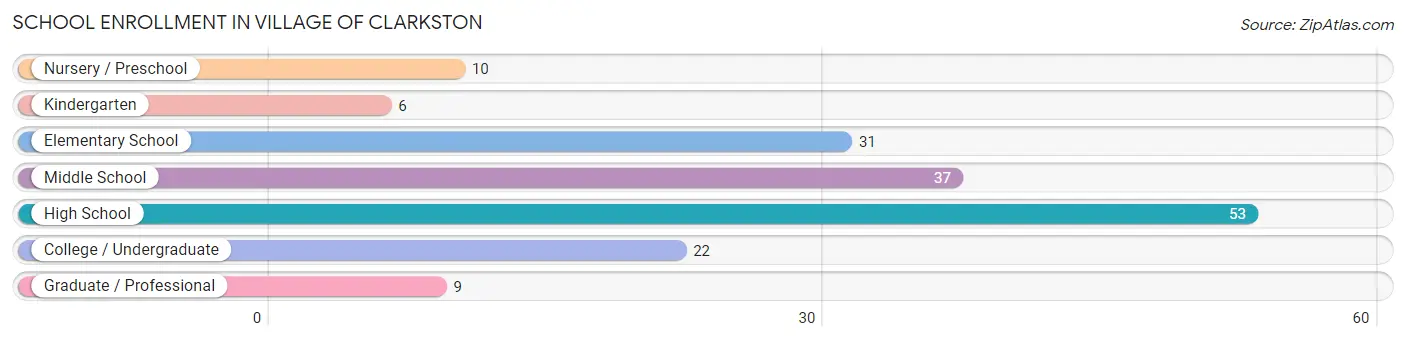
School Enrollment in Village of Clarkston
The most common levels of schooling among the 168 students in Village of Clarkston are high school (53 | 31.6%), middle school (37 | 22.0%), and elementary school (31 | 18.4%).
| School Level | # Students | % Students |
| Nursery / Preschool | 10 | 5.9% |
| Kindergarten | 6 | 3.6% |
| Elementary School | 31 | 18.4% |
| Middle School | 37 | 22.0% |
| High School | 53 | 31.6% |
| College / Undergraduate | 22 | 13.1% |
| Graduate / Professional | 9 | 5.4% |
| Total | 168 | 100.0% |
School Enrollment by Age by Funding Source in Village of Clarkston
Out of a total of 168 students who are enrolled in schools in Village of Clarkston, 28 (16.7%) attend a private institution, while the remaining 140 (83.3%) are enrolled in public schools. The age group of 35 years and over has the highest likelihood of being enrolled in private schools, with 8 (72.7% in the age bracket) enrolled. Conversely, the age group of 10 to 14 year olds has the lowest likelihood of being enrolled in a private school, with 42 (100.0% in the age bracket) attending a public institution.
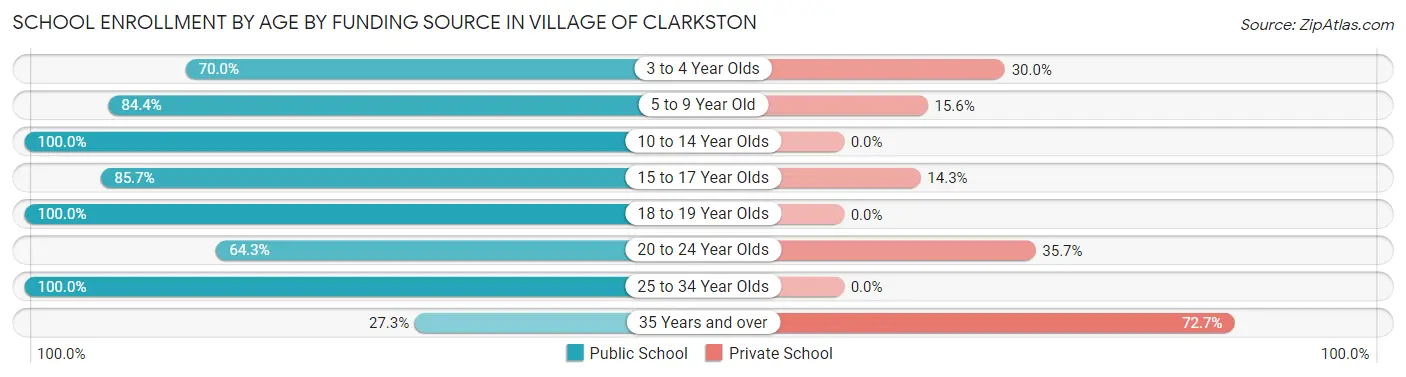
| Age Bracket | Public School | Private School |
| 3 to 4 Year Olds | 7 (70.0%) | 3 (30.0%) |
| 5 to 9 Year Old | 27 (84.4%) | 5 (15.6%) |
| 10 to 14 Year Olds | 42 (100.0%) | 0 (0.0%) |
| 15 to 17 Year Olds | 42 (85.7%) | 7 (14.3%) |
| 18 to 19 Year Olds | 8 (100.0%) | 0 (0.0%) |
| 20 to 24 Year Olds | 9 (64.3%) | 5 (35.7%) |
| 25 to 34 Year Olds | 2 (100.0%) | 0 (0.0%) |
| 35 Years and over | 3 (27.3%) | 8 (72.7%) |
| Total | 140 (83.3%) | 28 (16.7%) |
Educational Attainment by Field of Study in Village of Clarkston
Education (55 | 16.7%), business (40 | 12.2%), arts & humanities (35 | 10.6%), engineering (33 | 10.0%), and science & technology (31 | 9.4%) are the most common fields of study among 329 individuals in Village of Clarkston who have obtained a bachelor's degree or higher.
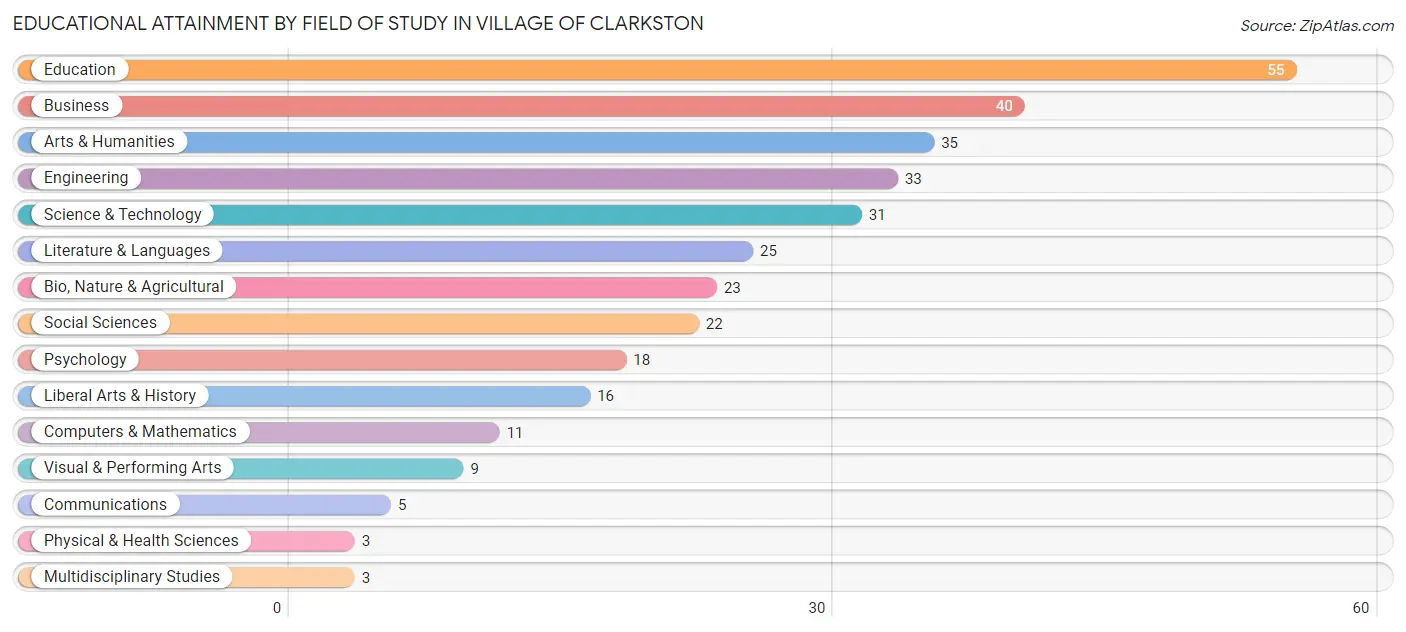
| Field of Study | # Graduates | % Graduates |
| Computers & Mathematics | 11 | 3.3% |
| Bio, Nature & Agricultural | 23 | 7.0% |
| Physical & Health Sciences | 3 | 0.9% |
| Psychology | 18 | 5.5% |
| Social Sciences | 22 | 6.7% |
| Engineering | 33 | 10.0% |
| Multidisciplinary Studies | 3 | 0.9% |
| Science & Technology | 31 | 9.4% |
| Business | 40 | 12.2% |
| Education | 55 | 16.7% |
| Literature & Languages | 25 | 7.6% |
| Liberal Arts & History | 16 | 4.9% |
| Visual & Performing Arts | 9 | 2.7% |
| Communications | 5 | 1.5% |
| Arts & Humanities | 35 | 10.6% |
| Total | 329 | 100.0% |
Transportation & Commute in Village of Clarkston
Vehicle Availability by Sex in Village of Clarkston
The most prevalent vehicle ownership categories in Village of Clarkston are males with 2 vehicles (109, accounting for 55.0%) and females with 2 vehicles (96, making up 59.6%).
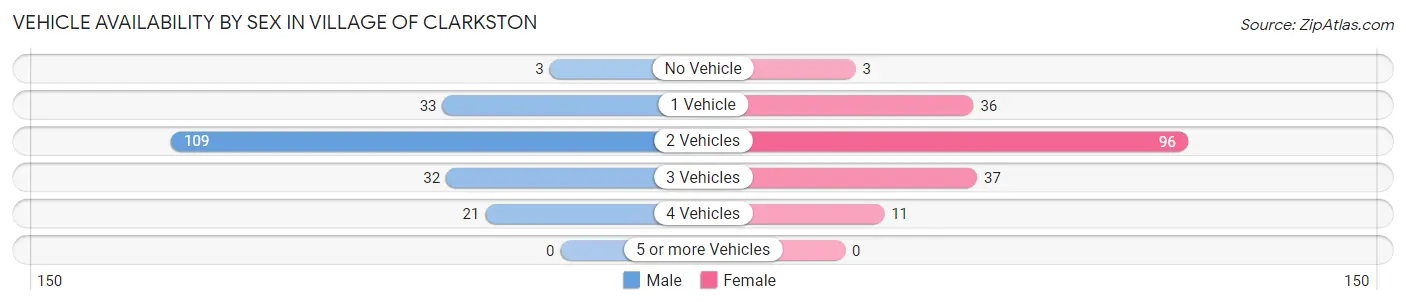
| Vehicles Available | Male | Female |
| No Vehicle | 3 (1.5%) | 3 (1.6%) |
| 1 Vehicle | 33 (16.7%) | 36 (19.7%) |
| 2 Vehicles | 109 (55.0%) | 96 (52.5%) |
| 3 Vehicles | 32 (16.2%) | 37 (20.2%) |
| 4 Vehicles | 21 (10.6%) | 11 (6.0%) |
| 5 or more Vehicles | 0 (0.0%) | 0 (0.0%) |
| Total | 198 (100.0%) | 183 (100.0%) |
Commute Time in Village of Clarkston
The most frequently occuring commute durations in Village of Clarkston are 5 to 9 minutes (54 commuters, 17.9%), 10 to 14 minutes (51 commuters, 16.9%), and 20 to 24 minutes (35 commuters, 11.6%).
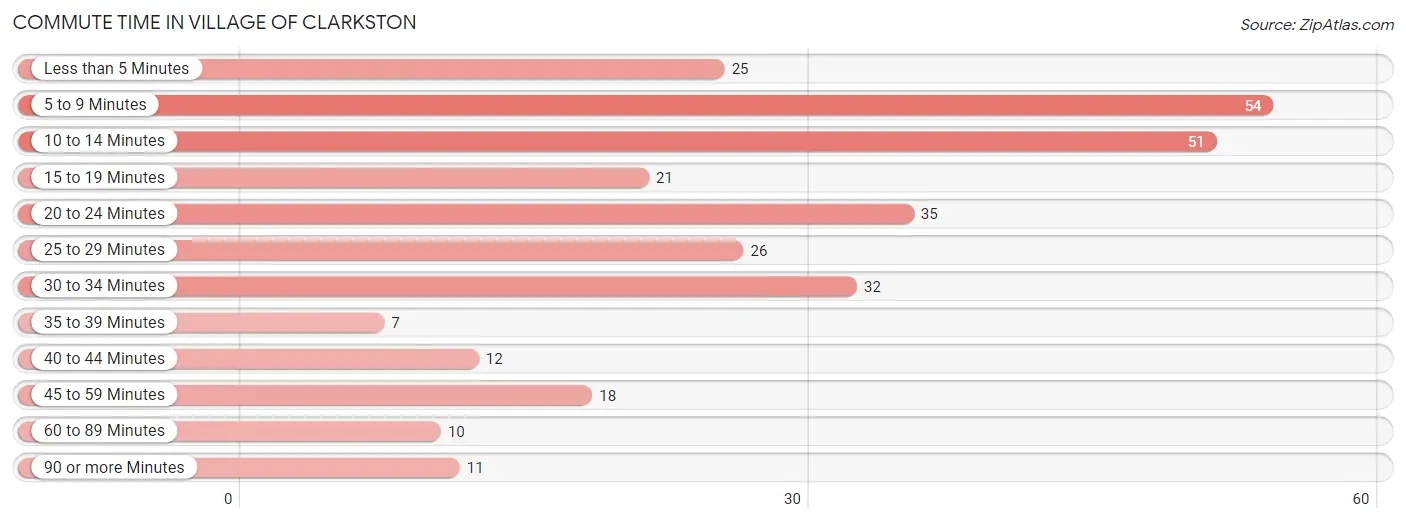
| Commute Time | # Commuters | % Commuters |
| Less than 5 Minutes | 25 | 8.3% |
| 5 to 9 Minutes | 54 | 17.9% |
| 10 to 14 Minutes | 51 | 16.9% |
| 15 to 19 Minutes | 21 | 7.0% |
| 20 to 24 Minutes | 35 | 11.6% |
| 25 to 29 Minutes | 26 | 8.6% |
| 30 to 34 Minutes | 32 | 10.6% |
| 35 to 39 Minutes | 7 | 2.3% |
| 40 to 44 Minutes | 12 | 4.0% |
| 45 to 59 Minutes | 18 | 6.0% |
| 60 to 89 Minutes | 10 | 3.3% |
| 90 or more Minutes | 11 | 3.6% |
Commute Time by Sex in Village of Clarkston
The most common commute times in Village of Clarkston are 10 to 14 minutes (34 commuters, 20.6%) for males and 5 to 9 minutes (37 commuters, 27.0%) for females.
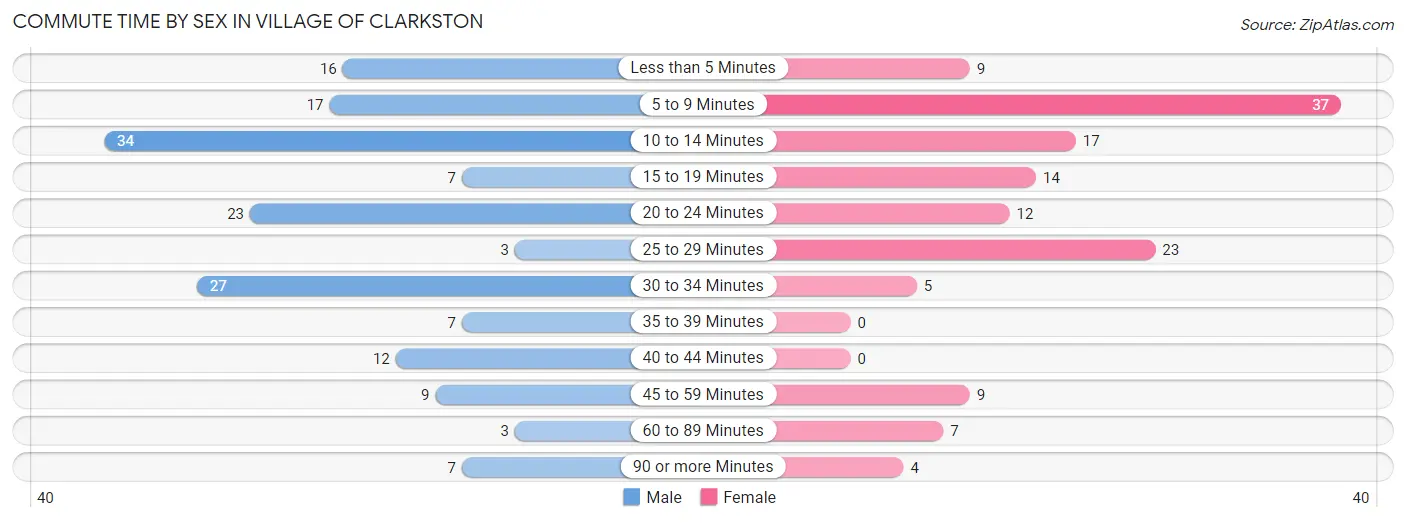
| Commute Time | Male | Female |
| Less than 5 Minutes | 16 (9.7%) | 9 (6.6%) |
| 5 to 9 Minutes | 17 (10.3%) | 37 (27.0%) |
| 10 to 14 Minutes | 34 (20.6%) | 17 (12.4%) |
| 15 to 19 Minutes | 7 (4.2%) | 14 (10.2%) |
| 20 to 24 Minutes | 23 (13.9%) | 12 (8.8%) |
| 25 to 29 Minutes | 3 (1.8%) | 23 (16.8%) |
| 30 to 34 Minutes | 27 (16.4%) | 5 (3.6%) |
| 35 to 39 Minutes | 7 (4.2%) | 0 (0.0%) |
| 40 to 44 Minutes | 12 (7.3%) | 0 (0.0%) |
| 45 to 59 Minutes | 9 (5.4%) | 9 (6.6%) |
| 60 to 89 Minutes | 3 (1.8%) | 7 (5.1%) |
| 90 or more Minutes | 7 (4.2%) | 4 (2.9%) |
Time of Departure to Work by Sex in Village of Clarkston
The most frequent times of departure to work in Village of Clarkston are 7:00 AM to 7:29 AM (48, 29.1%) for males and 12:00 PM to 3:59 PM (25, 18.2%) for females.
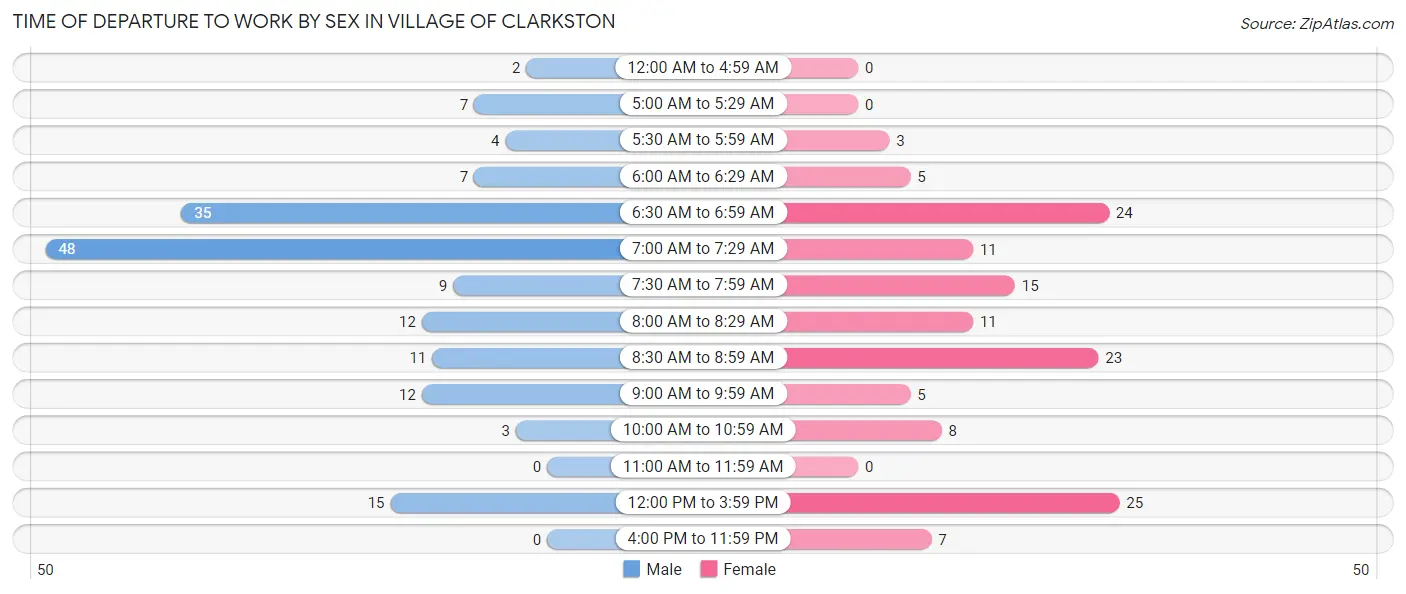
| Time of Departure | Male | Female |
| 12:00 AM to 4:59 AM | 2 (1.2%) | 0 (0.0%) |
| 5:00 AM to 5:29 AM | 7 (4.2%) | 0 (0.0%) |
| 5:30 AM to 5:59 AM | 4 (2.4%) | 3 (2.2%) |
| 6:00 AM to 6:29 AM | 7 (4.2%) | 5 (3.6%) |
| 6:30 AM to 6:59 AM | 35 (21.2%) | 24 (17.5%) |
| 7:00 AM to 7:29 AM | 48 (29.1%) | 11 (8.0%) |
| 7:30 AM to 7:59 AM | 9 (5.4%) | 15 (11.0%) |
| 8:00 AM to 8:29 AM | 12 (7.3%) | 11 (8.0%) |
| 8:30 AM to 8:59 AM | 11 (6.7%) | 23 (16.8%) |
| 9:00 AM to 9:59 AM | 12 (7.3%) | 5 (3.6%) |
| 10:00 AM to 10:59 AM | 3 (1.8%) | 8 (5.8%) |
| 11:00 AM to 11:59 AM | 0 (0.0%) | 0 (0.0%) |
| 12:00 PM to 3:59 PM | 15 (9.1%) | 25 (18.2%) |
| 4:00 PM to 11:59 PM | 0 (0.0%) | 7 (5.1%) |
| Total | 165 (100.0%) | 137 (100.0%) |
Housing Occupancy in Village of Clarkston
Occupancy by Ownership in Village of Clarkston
Of the total 351 dwellings in Village of Clarkston, owner-occupied units account for 236 (67.2%), while renter-occupied units make up 115 (32.8%).
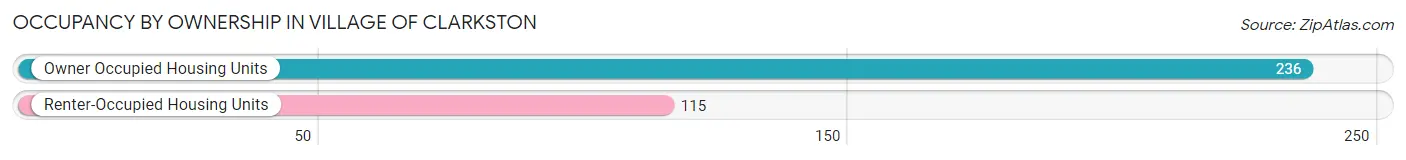
| Occupancy | # Housing Units | % Housing Units |
| Owner Occupied Housing Units | 236 | 67.2% |
| Renter-Occupied Housing Units | 115 | 32.8% |
| Total Occupied Housing Units | 351 | 100.0% |
Occupancy by Household Size in Village of Clarkston
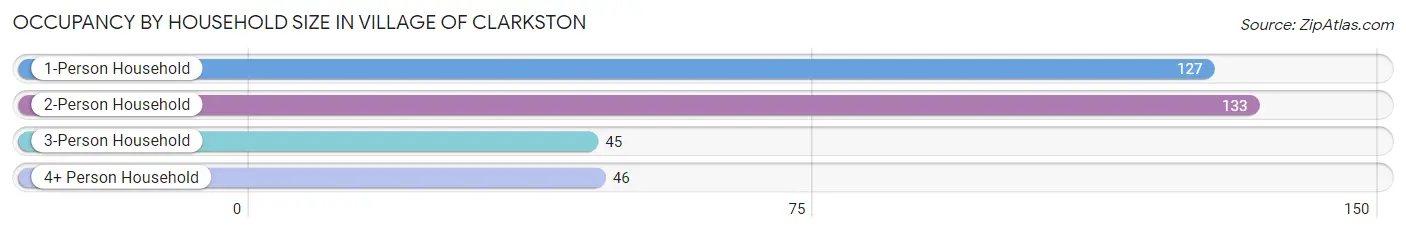
| Household Size | # Housing Units | % Housing Units |
| 1-Person Household | 127 | 36.2% |
| 2-Person Household | 133 | 37.9% |
| 3-Person Household | 45 | 12.8% |
| 4+ Person Household | 46 | 13.1% |
| Total Housing Units | 351 | 100.0% |
Occupancy by Ownership by Household Size in Village of Clarkston
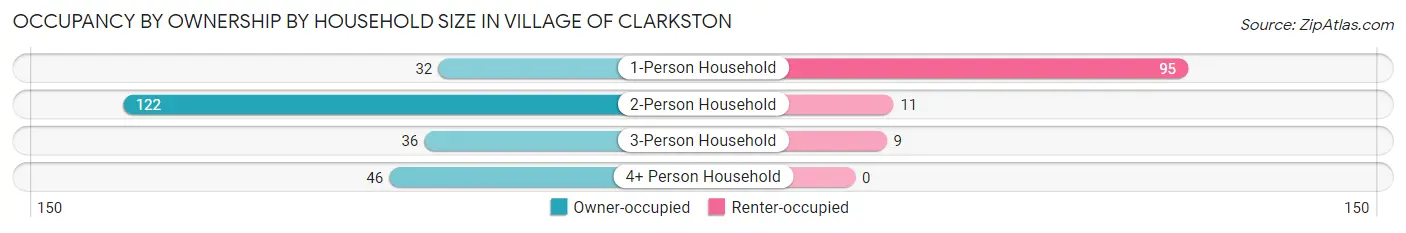
| Household Size | Owner-occupied | Renter-occupied |
| 1-Person Household | 32 (25.2%) | 95 (74.8%) |
| 2-Person Household | 122 (91.7%) | 11 (8.3%) |
| 3-Person Household | 36 (80.0%) | 9 (20.0%) |
| 4+ Person Household | 46 (100.0%) | 0 (0.0%) |
| Total Housing Units | 236 (67.2%) | 115 (32.8%) |
Occupancy by Educational Attainment in Village of Clarkston
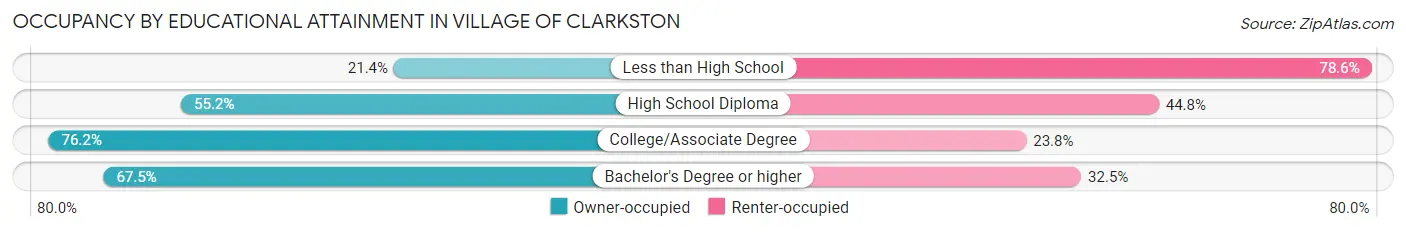
| Household Size | Owner-occupied | Renter-occupied |
| Less than High School | 3 (21.4%) | 11 (78.6%) |
| High School Diploma | 16 (55.2%) | 13 (44.8%) |
| College/Associate Degree | 80 (76.2%) | 25 (23.8%) |
| Bachelor's Degree or higher | 137 (67.5%) | 66 (32.5%) |
Occupancy by Age of Householder in Village of Clarkston
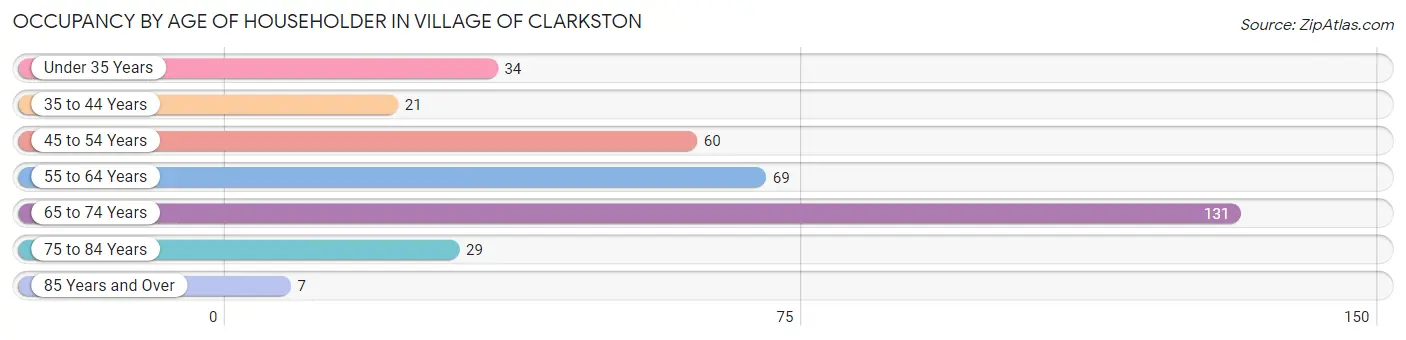
| Age Bracket | # Households | % Households |
| Under 35 Years | 34 | 9.7% |
| 35 to 44 Years | 21 | 6.0% |
| 45 to 54 Years | 60 | 17.1% |
| 55 to 64 Years | 69 | 19.7% |
| 65 to 74 Years | 131 | 37.3% |
| 75 to 84 Years | 29 | 8.3% |
| 85 Years and Over | 7 | 2.0% |
| Total | 351 | 100.0% |
Housing Finances in Village of Clarkston
Median Income by Occupancy in Village of Clarkston
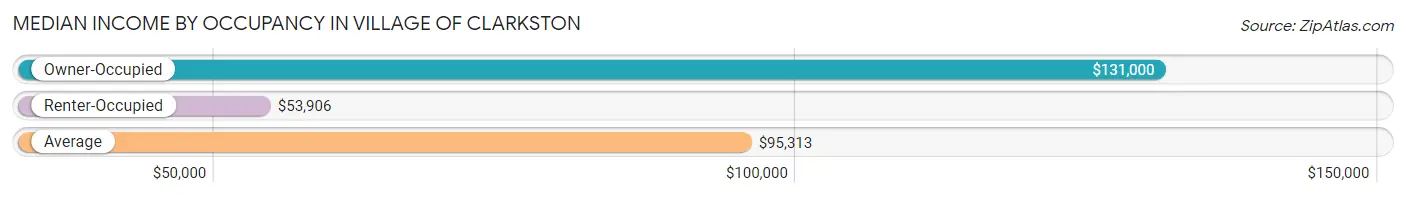
| Occupancy Type | # Households | Median Income |
| Owner-Occupied | 236 (67.2%) | $131,000 |
| Renter-Occupied | 115 (32.8%) | $53,906 |
| Average | 351 (100.0%) | $95,313 |
Occupancy by Householder Income Bracket in Village of Clarkston
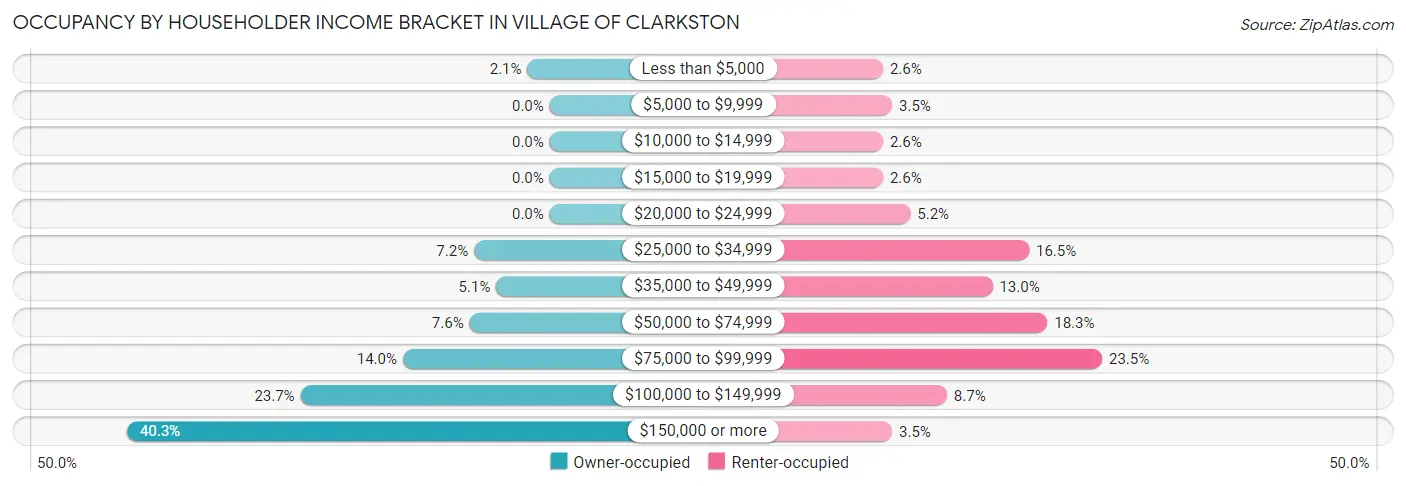
| Income Bracket | Owner-occupied | Renter-occupied |
| Less than $5,000 | 5 (2.1%) | 3 (2.6%) |
| $5,000 to $9,999 | 0 (0.0%) | 4 (3.5%) |
| $10,000 to $14,999 | 0 (0.0%) | 3 (2.6%) |
| $15,000 to $19,999 | 0 (0.0%) | 3 (2.6%) |
| $20,000 to $24,999 | 0 (0.0%) | 6 (5.2%) |
| $25,000 to $34,999 | 17 (7.2%) | 19 (16.5%) |
| $35,000 to $49,999 | 12 (5.1%) | 15 (13.0%) |
| $50,000 to $74,999 | 18 (7.6%) | 21 (18.3%) |
| $75,000 to $99,999 | 33 (14.0%) | 27 (23.5%) |
| $100,000 to $149,999 | 56 (23.7%) | 10 (8.7%) |
| $150,000 or more | 95 (40.3%) | 4 (3.5%) |
| Total | 236 (100.0%) | 115 (100.0%) |
Monthly Housing Cost Tiers in Village of Clarkston
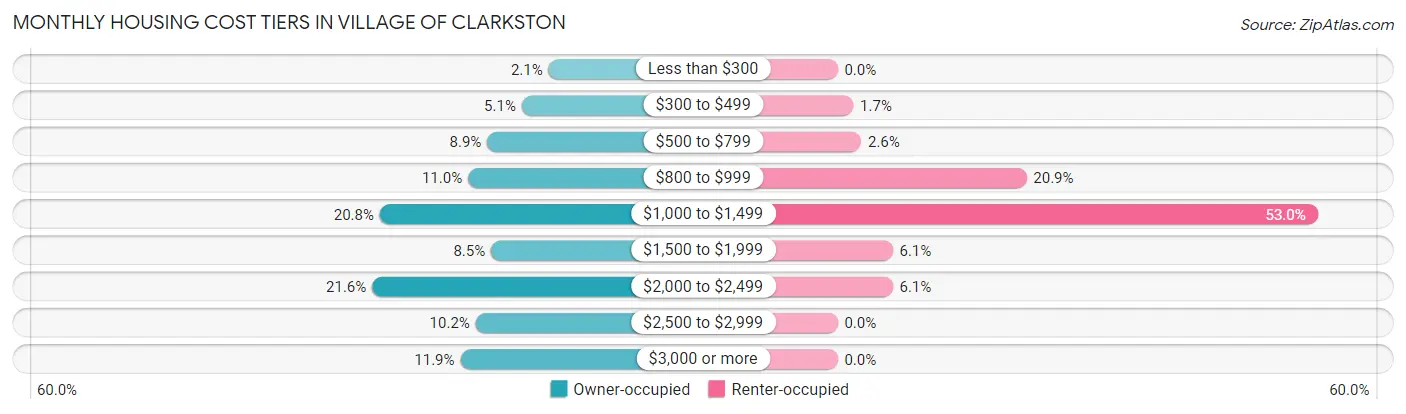
| Monthly Cost | Owner-occupied | Renter-occupied |
| Less than $300 | 5 (2.1%) | 0 (0.0%) |
| $300 to $499 | 12 (5.1%) | 2 (1.7%) |
| $500 to $799 | 21 (8.9%) | 3 (2.6%) |
| $800 to $999 | 26 (11.0%) | 24 (20.9%) |
| $1,000 to $1,499 | 49 (20.8%) | 61 (53.0%) |
| $1,500 to $1,999 | 20 (8.5%) | 7 (6.1%) |
| $2,000 to $2,499 | 51 (21.6%) | 7 (6.1%) |
| $2,500 to $2,999 | 24 (10.2%) | 0 (0.0%) |
| $3,000 or more | 28 (11.9%) | 0 (0.0%) |
| Total | 236 (100.0%) | 115 (100.0%) |
Physical Housing Characteristics in Village of Clarkston
Housing Structures in Village of Clarkston
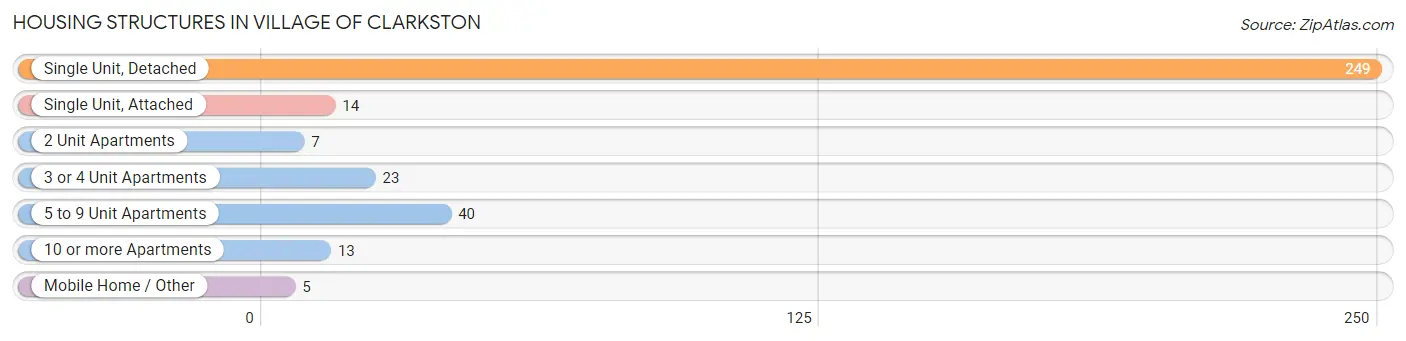
| Structure Type | # Housing Units | % Housing Units |
| Single Unit, Detached | 249 | 70.9% |
| Single Unit, Attached | 14 | 4.0% |
| 2 Unit Apartments | 7 | 2.0% |
| 3 or 4 Unit Apartments | 23 | 6.6% |
| 5 to 9 Unit Apartments | 40 | 11.4% |
| 10 or more Apartments | 13 | 3.7% |
| Mobile Home / Other | 5 | 1.4% |
| Total | 351 | 100.0% |
Housing Structures by Occupancy in Village of Clarkston
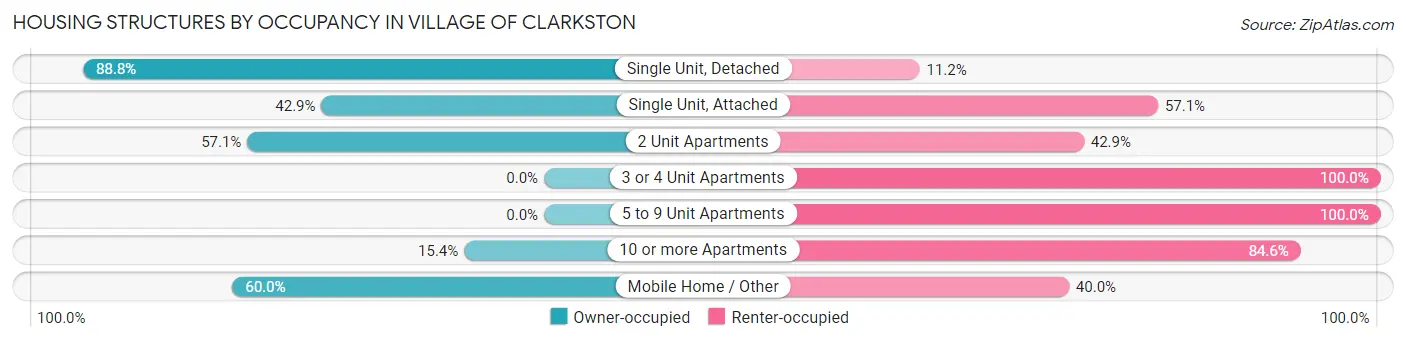
| Structure Type | Owner-occupied | Renter-occupied |
| Single Unit, Detached | 221 (88.8%) | 28 (11.2%) |
| Single Unit, Attached | 6 (42.9%) | 8 (57.1%) |
| 2 Unit Apartments | 4 (57.1%) | 3 (42.9%) |
| 3 or 4 Unit Apartments | 0 (0.0%) | 23 (100.0%) |
| 5 to 9 Unit Apartments | 0 (0.0%) | 40 (100.0%) |
| 10 or more Apartments | 2 (15.4%) | 11 (84.6%) |
| Mobile Home / Other | 3 (60.0%) | 2 (40.0%) |
| Total | 236 (67.2%) | 115 (32.8%) |
Housing Structures by Number of Rooms in Village of Clarkston
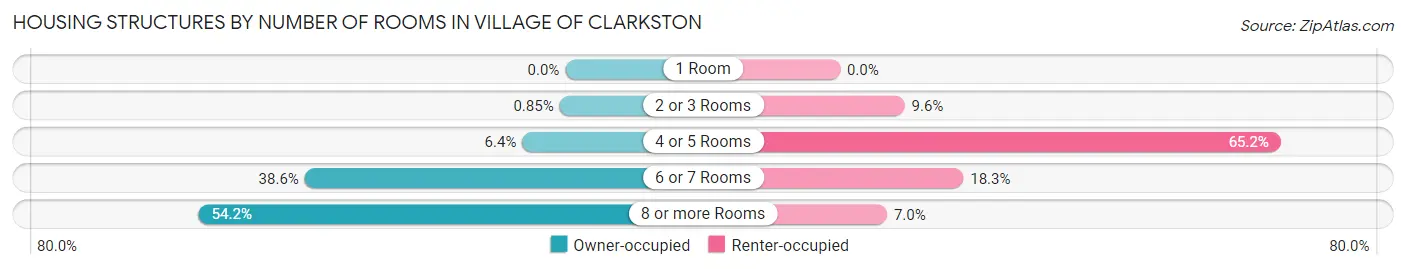
| Number of Rooms | Owner-occupied | Renter-occupied |
| 1 Room | 0 (0.0%) | 0 (0.0%) |
| 2 or 3 Rooms | 2 (0.9%) | 11 (9.6%) |
| 4 or 5 Rooms | 15 (6.4%) | 75 (65.2%) |
| 6 or 7 Rooms | 91 (38.6%) | 21 (18.3%) |
| 8 or more Rooms | 128 (54.2%) | 8 (7.0%) |
| Total | 236 (100.0%) | 115 (100.0%) |
Housing Structure by Heating Type in Village of Clarkston
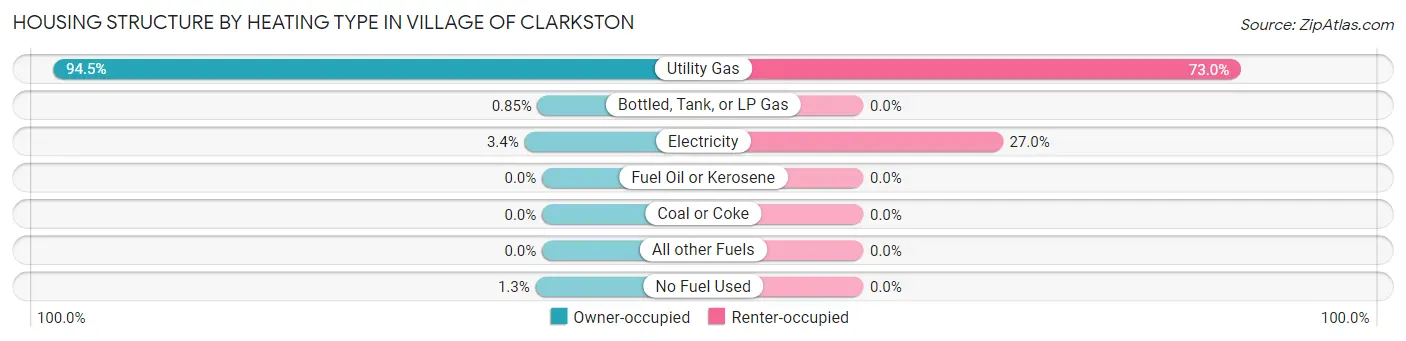
| Heating Type | Owner-occupied | Renter-occupied |
| Utility Gas | 223 (94.5%) | 84 (73.0%) |
| Bottled, Tank, or LP Gas | 2 (0.9%) | 0 (0.0%) |
| Electricity | 8 (3.4%) | 31 (27.0%) |
| Fuel Oil or Kerosene | 0 (0.0%) | 0 (0.0%) |
| Coal or Coke | 0 (0.0%) | 0 (0.0%) |
| All other Fuels | 0 (0.0%) | 0 (0.0%) |
| No Fuel Used | 3 (1.3%) | 0 (0.0%) |
| Total | 236 (100.0%) | 115 (100.0%) |
Household Vehicle Usage in Village of Clarkston
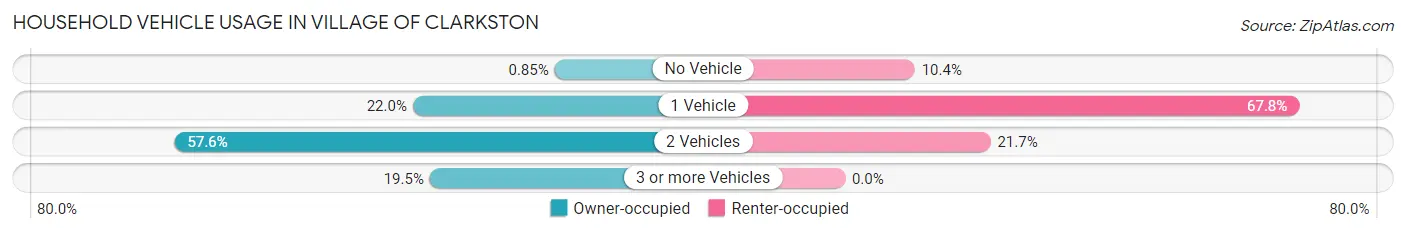
| Vehicles per Household | Owner-occupied | Renter-occupied |
| No Vehicle | 2 (0.9%) | 12 (10.4%) |
| 1 Vehicle | 52 (22.0%) | 78 (67.8%) |
| 2 Vehicles | 136 (57.6%) | 25 (21.7%) |
| 3 or more Vehicles | 46 (19.5%) | 0 (0.0%) |
| Total | 236 (100.0%) | 115 (100.0%) |
Real Estate & Mortgages in Village of Clarkston
Real Estate and Mortgage Overview in Village of Clarkston
| Characteristic | Without Mortgage | With Mortgage |
| Housing Units | 82 | 154 |
| Median Property Value | $429,600 | $440,000 |
| Median Household Income | $108,750 | $67 |
| Monthly Housing Costs | $821 | $28 |
| Real Estate Taxes | $4,833 | $4 |
Property Value by Mortgage Status in Village of Clarkston
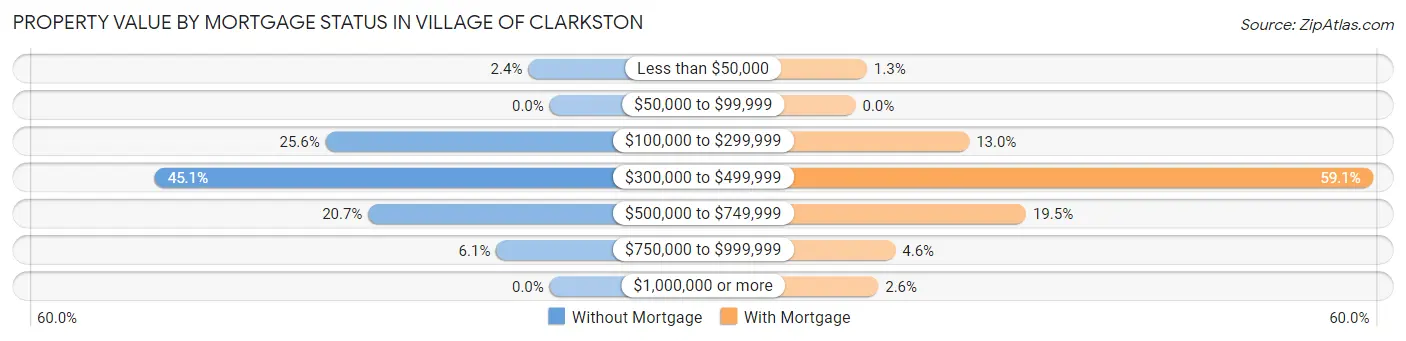
| Property Value | Without Mortgage | With Mortgage |
| Less than $50,000 | 2 (2.4%) | 2 (1.3%) |
| $50,000 to $99,999 | 0 (0.0%) | 0 (0.0%) |
| $100,000 to $299,999 | 21 (25.6%) | 20 (13.0%) |
| $300,000 to $499,999 | 37 (45.1%) | 91 (59.1%) |
| $500,000 to $749,999 | 17 (20.7%) | 30 (19.5%) |
| $750,000 to $999,999 | 5 (6.1%) | 7 (4.5%) |
| $1,000,000 or more | 0 (0.0%) | 4 (2.6%) |
| Total | 82 (100.0%) | 154 (100.0%) |
Household Income by Mortgage Status in Village of Clarkston
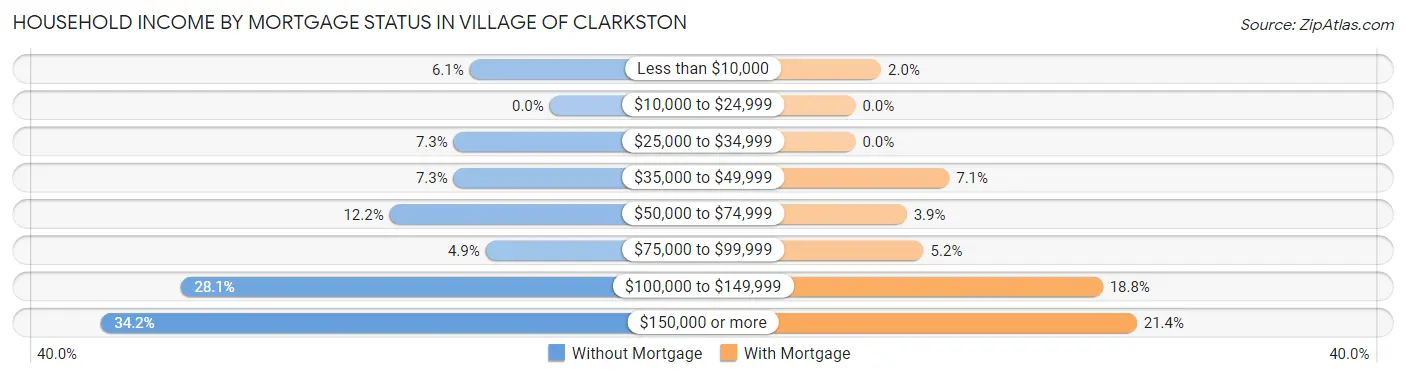
| Household Income | Without Mortgage | With Mortgage |
| Less than $10,000 | 5 (6.1%) | 3 (1.9%) |
| $10,000 to $24,999 | 0 (0.0%) | 0 (0.0%) |
| $25,000 to $34,999 | 6 (7.3%) | 0 (0.0%) |
| $35,000 to $49,999 | 6 (7.3%) | 11 (7.1%) |
| $50,000 to $74,999 | 10 (12.2%) | 6 (3.9%) |
| $75,000 to $99,999 | 4 (4.9%) | 8 (5.2%) |
| $100,000 to $149,999 | 23 (28.1%) | 29 (18.8%) |
| $150,000 or more | 28 (34.2%) | 33 (21.4%) |
| Total | 82 (100.0%) | 154 (100.0%) |
Property Value to Household Income Ratio in Village of Clarkston
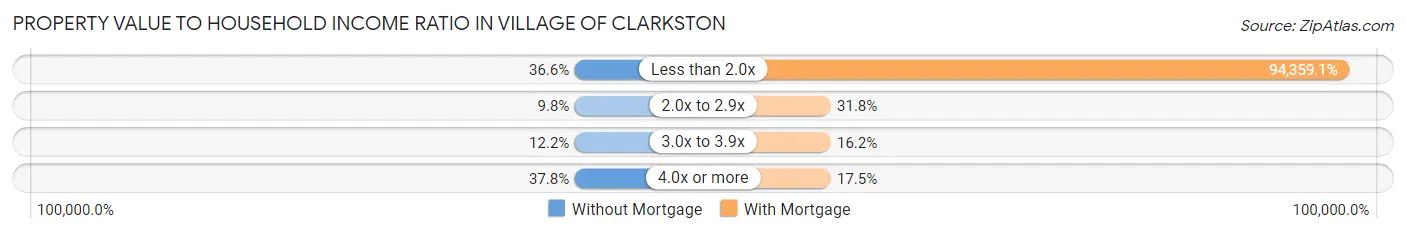
| Value-to-Income Ratio | Without Mortgage | With Mortgage |
| Less than 2.0x | 30 (36.6%) | 145,313 (94,359.1%) |
| 2.0x to 2.9x | 8 (9.8%) | 49 (31.8%) |
| 3.0x to 3.9x | 10 (12.2%) | 25 (16.2%) |
| 4.0x or more | 31 (37.8%) | 27 (17.5%) |
| Total | 82 (100.0%) | 154 (100.0%) |
Real Estate Taxes by Mortgage Status in Village of Clarkston
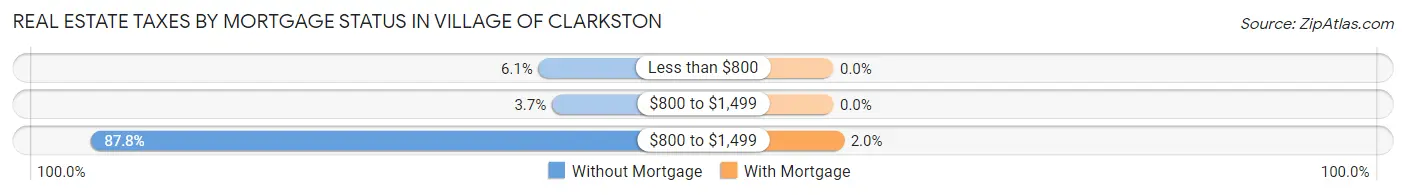
| Property Taxes | Without Mortgage | With Mortgage |
| Less than $800 | 5 (6.1%) | 0 (0.0%) |
| $800 to $1,499 | 3 (3.7%) | 0 (0.0%) |
| $800 to $1,499 | 72 (87.8%) | 3 (1.9%) |
| Total | 82 (100.0%) | 154 (100.0%) |
Health & Disability in Village of Clarkston
Health Insurance Coverage by Age in Village of Clarkston
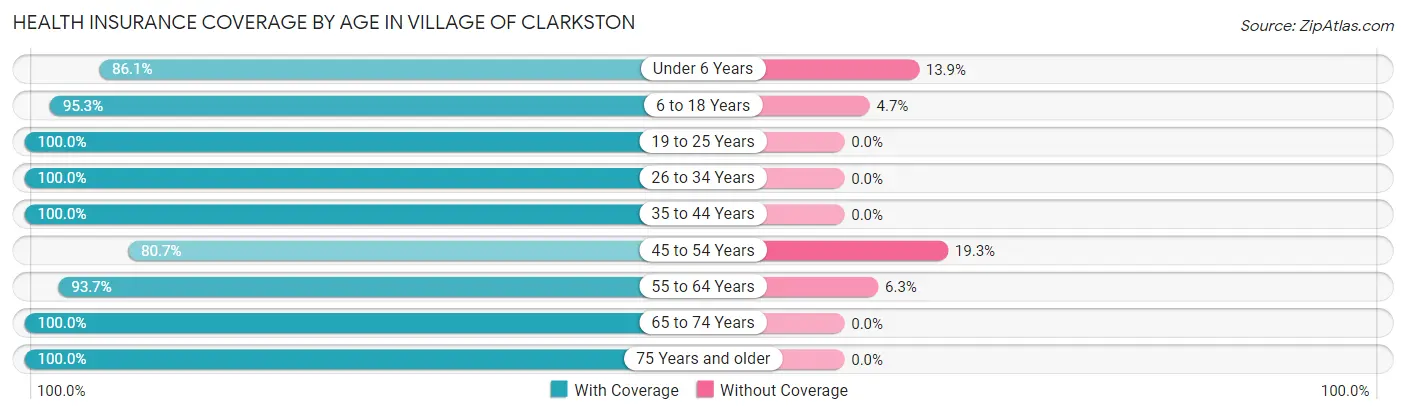
| Age Bracket | With Coverage | Without Coverage |
| Under 6 Years | 31 (86.1%) | 5 (13.9%) |
| 6 to 18 Years | 121 (95.3%) | 6 (4.7%) |
| 19 to 25 Years | 25 (100.0%) | 0 (0.0%) |
| 26 to 34 Years | 61 (100.0%) | 0 (0.0%) |
| 35 to 44 Years | 52 (100.0%) | 0 (0.0%) |
| 45 to 54 Years | 71 (80.7%) | 17 (19.3%) |
| 55 to 64 Years | 119 (93.7%) | 8 (6.3%) |
| 65 to 74 Years | 191 (100.0%) | 0 (0.0%) |
| 75 Years and older | 68 (100.0%) | 0 (0.0%) |
| Total | 739 (95.4%) | 36 (4.6%) |
Health Insurance Coverage by Citizenship Status in Village of Clarkston
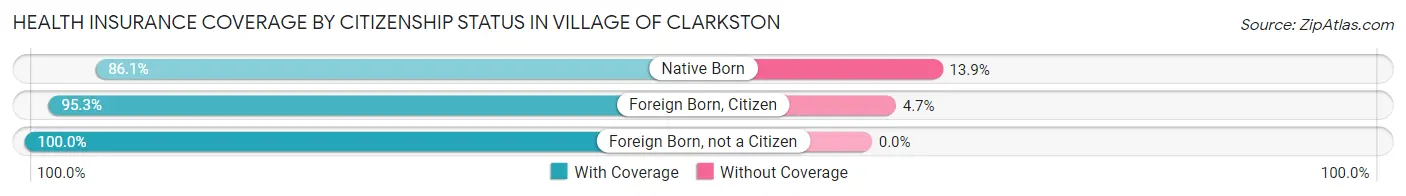
| Citizenship Status | With Coverage | Without Coverage |
| Native Born | 31 (86.1%) | 5 (13.9%) |
| Foreign Born, Citizen | 121 (95.3%) | 6 (4.7%) |
| Foreign Born, not a Citizen | 25 (100.0%) | 0 (0.0%) |
Health Insurance Coverage by Household Income in Village of Clarkston
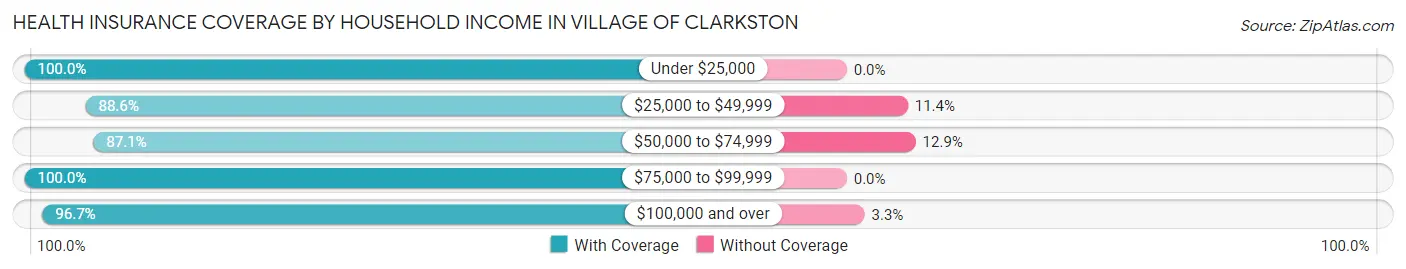
| Household Income | With Coverage | Without Coverage |
| Under $25,000 | 24 (100.0%) | 0 (0.0%) |
| $25,000 to $49,999 | 93 (88.6%) | 12 (11.4%) |
| $50,000 to $74,999 | 54 (87.1%) | 8 (12.9%) |
| $75,000 to $99,999 | 105 (100.0%) | 0 (0.0%) |
| $100,000 and over | 463 (96.7%) | 16 (3.3%) |
Public vs Private Health Insurance Coverage by Age in Village of Clarkston
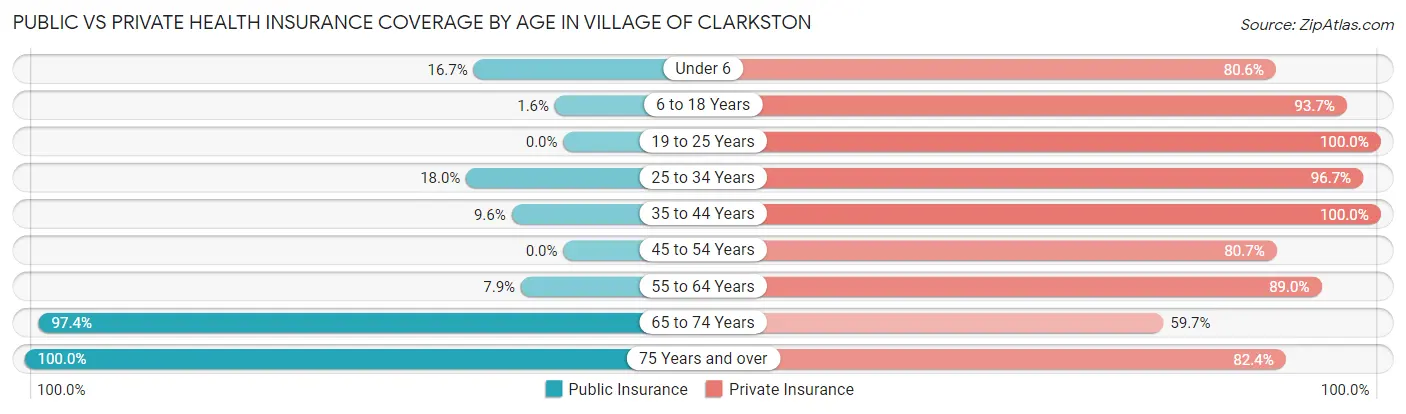
| Age Bracket | Public Insurance | Private Insurance |
| Under 6 | 6 (16.7%) | 29 (80.6%) |
| 6 to 18 Years | 2 (1.6%) | 119 (93.7%) |
| 19 to 25 Years | 0 (0.0%) | 25 (100.0%) |
| 25 to 34 Years | 11 (18.0%) | 59 (96.7%) |
| 35 to 44 Years | 5 (9.6%) | 52 (100.0%) |
| 45 to 54 Years | 0 (0.0%) | 71 (80.7%) |
| 55 to 64 Years | 10 (7.9%) | 113 (89.0%) |
| 65 to 74 Years | 186 (97.4%) | 114 (59.7%) |
| 75 Years and over | 68 (100.0%) | 56 (82.4%) |
| Total | 288 (37.2%) | 638 (82.3%) |
Disability Status by Sex by Age in Village of Clarkston
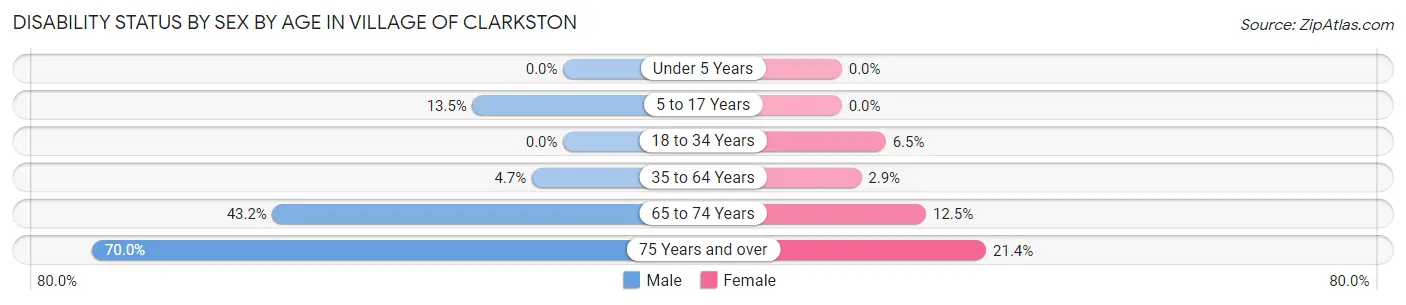
| Age Bracket | Male | Female |
| Under 5 Years | 0 (0.0%) | 0 (0.0%) |
| 5 to 17 Years | 7 (13.5%) | 0 (0.0%) |
| 18 to 34 Years | 0 (0.0%) | 3 (6.5%) |
| 35 to 64 Years | 6 (4.6%) | 4 (2.9%) |
| 65 to 74 Years | 41 (43.2%) | 12 (12.5%) |
| 75 Years and over | 28 (70.0%) | 6 (21.4%) |
Disability Class by Sex by Age in Village of Clarkston
Disability Class: Hearing Difficulty
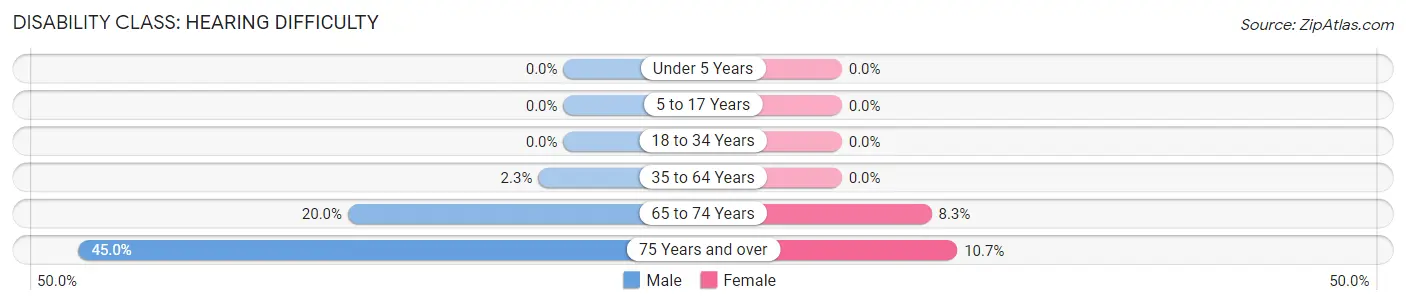
| Age Bracket | Male | Female |
| Under 5 Years | 0 (0.0%) | 0 (0.0%) |
| 5 to 17 Years | 0 (0.0%) | 0 (0.0%) |
| 18 to 34 Years | 0 (0.0%) | 0 (0.0%) |
| 35 to 64 Years | 3 (2.3%) | 0 (0.0%) |
| 65 to 74 Years | 19 (20.0%) | 8 (8.3%) |
| 75 Years and over | 18 (45.0%) | 3 (10.7%) |
Disability Class: Vision Difficulty
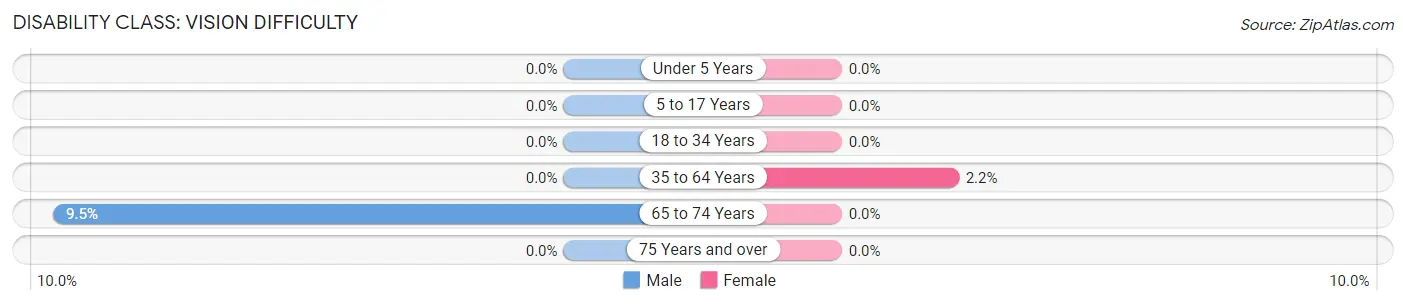
| Age Bracket | Male | Female |
| Under 5 Years | 0 (0.0%) | 0 (0.0%) |
| 5 to 17 Years | 0 (0.0%) | 0 (0.0%) |
| 18 to 34 Years | 0 (0.0%) | 0 (0.0%) |
| 35 to 64 Years | 0 (0.0%) | 3 (2.2%) |
| 65 to 74 Years | 9 (9.5%) | 0 (0.0%) |
| 75 Years and over | 0 (0.0%) | 0 (0.0%) |
Disability Class: Cognitive Difficulty
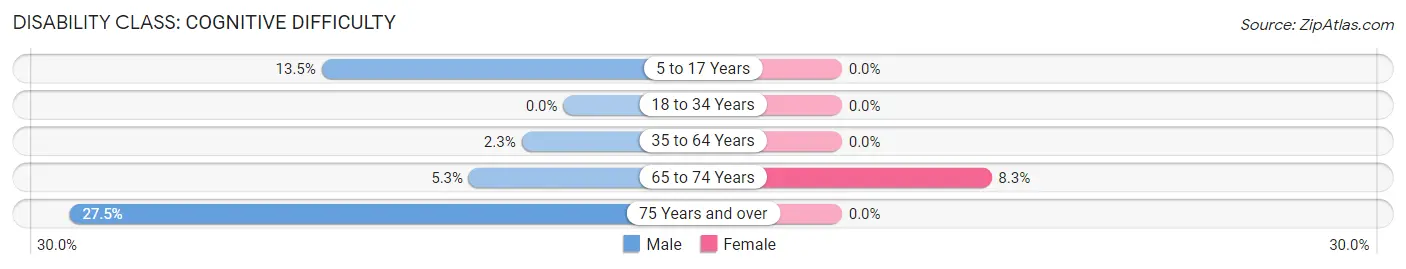
| Age Bracket | Male | Female |
| 5 to 17 Years | 7 (13.5%) | 0 (0.0%) |
| 18 to 34 Years | 0 (0.0%) | 0 (0.0%) |
| 35 to 64 Years | 3 (2.3%) | 0 (0.0%) |
| 65 to 74 Years | 5 (5.3%) | 8 (8.3%) |
| 75 Years and over | 11 (27.5%) | 0 (0.0%) |
Disability Class: Ambulatory Difficulty
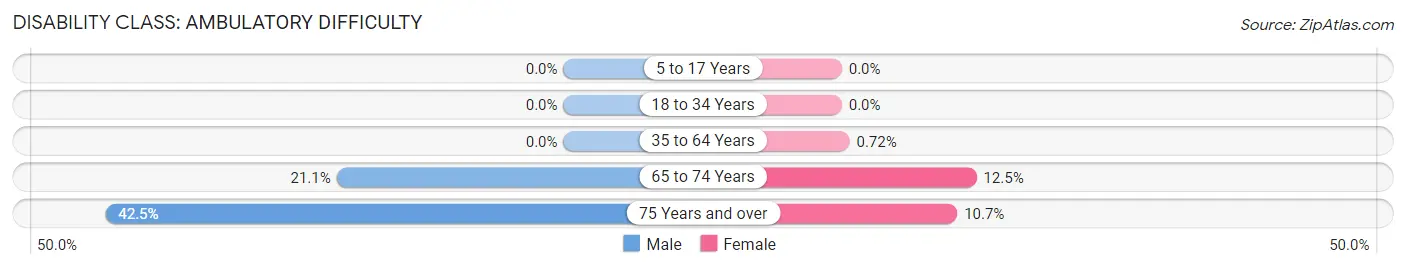
| Age Bracket | Male | Female |
| 5 to 17 Years | 0 (0.0%) | 0 (0.0%) |
| 18 to 34 Years | 0 (0.0%) | 0 (0.0%) |
| 35 to 64 Years | 0 (0.0%) | 1 (0.7%) |
| 65 to 74 Years | 20 (21.0%) | 12 (12.5%) |
| 75 Years and over | 17 (42.5%) | 3 (10.7%) |
Disability Class: Self-Care Difficulty
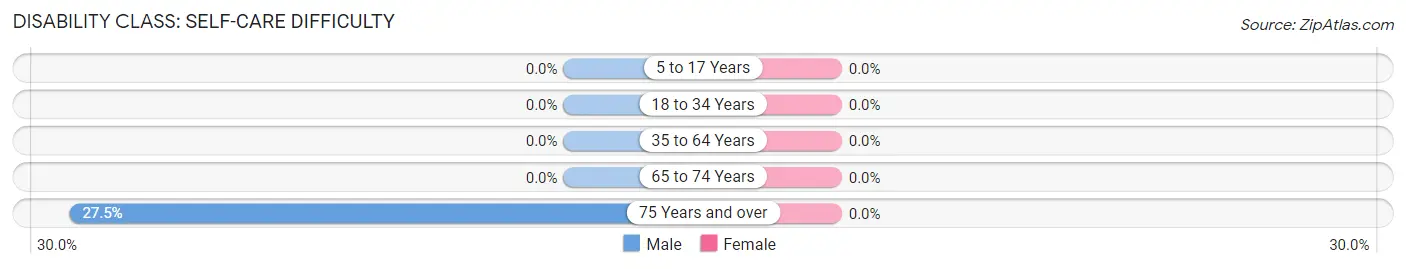
| Age Bracket | Male | Female |
| 5 to 17 Years | 0 (0.0%) | 0 (0.0%) |
| 18 to 34 Years | 0 (0.0%) | 0 (0.0%) |
| 35 to 64 Years | 0 (0.0%) | 0 (0.0%) |
| 65 to 74 Years | 0 (0.0%) | 0 (0.0%) |
| 75 Years and over | 11 (27.5%) | 0 (0.0%) |
Technology Access in Village of Clarkston
Computing Device Access in Village of Clarkston
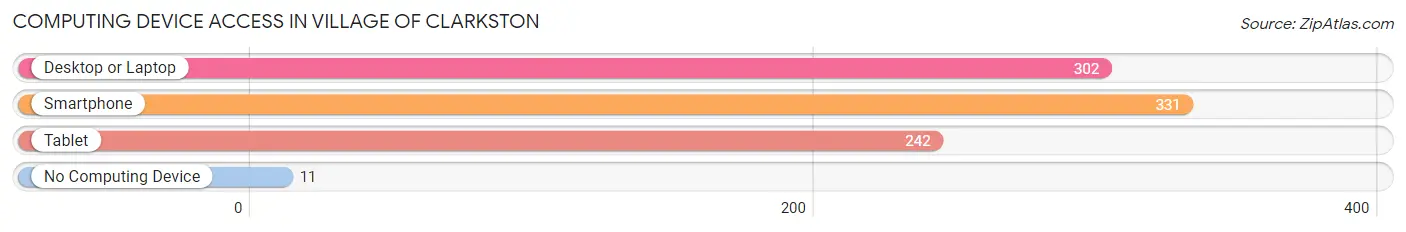
| Device Type | # Households | % Households |
| Desktop or Laptop | 302 | 86.0% |
| Smartphone | 331 | 94.3% |
| Tablet | 242 | 69.0% |
| No Computing Device | 11 | 3.1% |
| Total | 351 | 100.0% |
Internet Access in Village of Clarkston
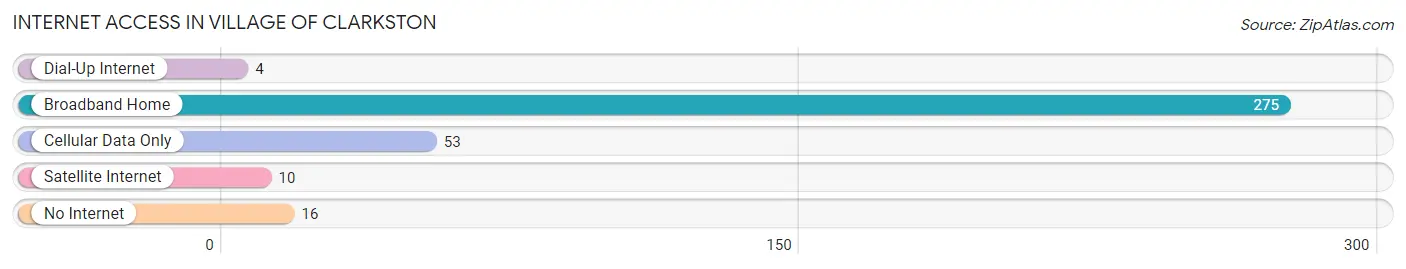
| Internet Type | # Households | % Households |
| Dial-Up Internet | 4 | 1.1% |
| Broadband Home | 275 | 78.3% |
| Cellular Data Only | 53 | 15.1% |
| Satellite Internet | 10 | 2.9% |
| No Internet | 16 | 4.6% |
| Total | 351 | 100.0% |
Village of Clarkston Summary
Village of Clarkston Michigan
History
The Village of Clarkston, Michigan is located in Oakland County, approximately 40 miles north of Detroit. The village was founded in 1842 by Elijah Willets, who purchased the land from the United States government. Willets named the village after his father, George Rogers Clark, who was a Revolutionary War hero. The village was incorporated in 1884 and has since grown to a population of over 8,000 people.
The village was originally a farming community, but in the late 19th century, it began to develop into a small industrial center. The village was home to several factories, including a paper mill, a sawmill, and a grist mill. The village also had a railroad station, which allowed for the transportation of goods and people.
In the early 20th century, the village began to experience a population boom. This was due to the influx of immigrants from Europe, as well as the growth of the automobile industry in Detroit. The village was also home to several resorts, which attracted tourists from all over the country.
Geography
The Village of Clarkston is located in Oakland County, Michigan. It is situated on the banks of the Clinton River, which flows through the village. The village is bordered by the cities of Auburn Hills, Waterford, and Independence Township. The village is approximately 40 miles north of Detroit and is part of the Detroit metropolitan area.
The village has a total area of 4.2 square miles, of which 4.1 square miles is land and 0.1 square miles is water. The village is located in a hilly area, with the highest point being the summit of Clarkston Hill, which is located at an elevation of 890 feet.
Economy
The Village of Clarkston has a diverse economy, with a variety of businesses and industries. The village is home to several retail stores, restaurants, and other businesses. The village is also home to several manufacturing companies, including a paper mill, a sawmill, and a grist mill.
The village is also home to several medical facilities, including a hospital, a nursing home, and several medical offices. The village is also home to several educational institutions, including a public school district, a community college, and a private university.
Demographics
As of the 2010 census, the Village of Clarkston had a population of 8,247 people. The population was spread out, with 24.3% under the age of 18, 8.2% from 18 to 24, 28.2% from 25 to 44, 25.2% from 45 to 64, and 14.1% who were 65 years of age or older. The median age was 38.7 years.
The median income for a household in the village was $63,917, and the median income for a family was $76,917. The per capita income for the village was $30,917. About 4.3% of families and 6.2% of the population were below the poverty line, including 8.2% of those under age 18 and 4.3% of those age 65 or over.
The village is predominantly white, with 91.2% of the population identifying as such. The remaining 8.8% of the population is made up of African Americans, Asians, and other races. The village is also home to a large number of immigrants, with 11.2% of the population being foreign-born.
Common Questions
What is Per Capita Income in Village of Clarkston?
Per Capita income in Village of Clarkston is $60,006.
What is the Median Family Income in Village of Clarkston?
Median Family Income in Village of Clarkston is $145,455.
What is the Median Household income in Village of Clarkston?
Median Household Income in Village of Clarkston is $95,313.
What is Income or Wage Gap in Village of Clarkston?
Income or Wage Gap in Village of Clarkston is 48.9%.
Women in Village of Clarkston earn 51.1 cents for every dollar earned by a man.
What is Inequality or Gini Index in Village of Clarkston?
Inequality or Gini Index in Village of Clarkston is 0.45.
What is the Total Population of Village of Clarkston?
Total Population of Village of Clarkston is 775.
What is the Total Male Population of Village of Clarkston?
Total Male Population of Village of Clarkston is 388.
What is the Total Female Population of Village of Clarkston?
Total Female Population of Village of Clarkston is 387.
What is the Ratio of Males per 100 Females in Village of Clarkston?
There are 100.26 Males per 100 Females in Village of Clarkston.
What is the Ratio of Females per 100 Males in Village of Clarkston?
There are 99.74 Females per 100 Males in Village of Clarkston.
What is the Median Population Age in Village of Clarkston?
Median Population Age in Village of Clarkston is 54.9 Years.
What is the Average Family Size in Village of Clarkston
Average Family Size in Village of Clarkston is 2.9 People.
What is the Average Household Size in Village of Clarkston
Average Household Size in Village of Clarkston is 2.2 People.
How Large is the Labor Force in Village of Clarkston?
There are 399 People in the Labor Forcein in Village of Clarkston.
What is the Percentage of People in the Labor Force in Village of Clarkston?
61.1% of People are in the Labor Force in Village of Clarkston.
What is the Unemployment Rate in Village of Clarkston?
Unemployment Rate in Village of Clarkston is 3.5%.