Dexter, MI Map & Demographics
Dexter Map
Dexter Overview
$50,131
PER CAPITA INCOME
$111,419
AVG FAMILY INCOME
$89,671
AVG HOUSEHOLD INCOME
11.2%
WAGE / INCOME GAP [ % ]
88.8¢/ $1
WAGE / INCOME GAP [ $ ]
0.44
INEQUALITY / GINI INDEX
4,505
TOTAL POPULATION
2,174
MALE POPULATION
2,331
FEMALE POPULATION
93.26
MALES / 100 FEMALES
107.22
FEMALES / 100 MALES
39.2
MEDIAN AGE
3.1
AVG FAMILY SIZE
2.6
AVG HOUSEHOLD SIZE
2,330
LABOR FORCE [ PEOPLE ]
68.7%
PERCENT IN LABOR FORCE
2.7%
UNEMPLOYMENT RATE
Dexter Zip Codes
Dexter Area Codes
Income in Dexter
Income Overview in Dexter
Per Capita Income in Dexter is $50,131, while median incomes of families and households are $111,419 and $89,671 respectively.
| Characteristic | Number | Measure |
| Per Capita Income | 4,505 | $50,131 |
| Median Family Income | 1,243 | $111,419 |
| Mean Family Income | 1,243 | $154,487 |
| Median Household Income | 1,758 | $89,671 |
| Mean Household Income | 1,758 | $128,470 |
| Income Deficit | 1,243 | $0 |
| Wage / Income Gap (%) | 4,505 | 11.19% |
| Wage / Income Gap ($) | 4,505 | 88.81¢ per $1 |
| Gini / Inequality Index | 4,505 | 0.44 |
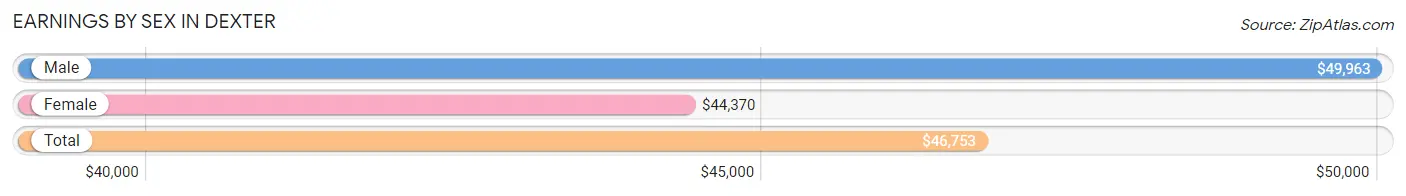
Earnings by Sex in Dexter
Average Earnings in Dexter are $46,753, $49,963 for men and $44,370 for women, a difference of 11.2%.
| Sex | Number | Average Earnings |
| Male | 1,271 (52.9%) | $49,963 |
| Female | 1,130 (47.1%) | $44,370 |
| Total | 2,401 (100.0%) | $46,753 |
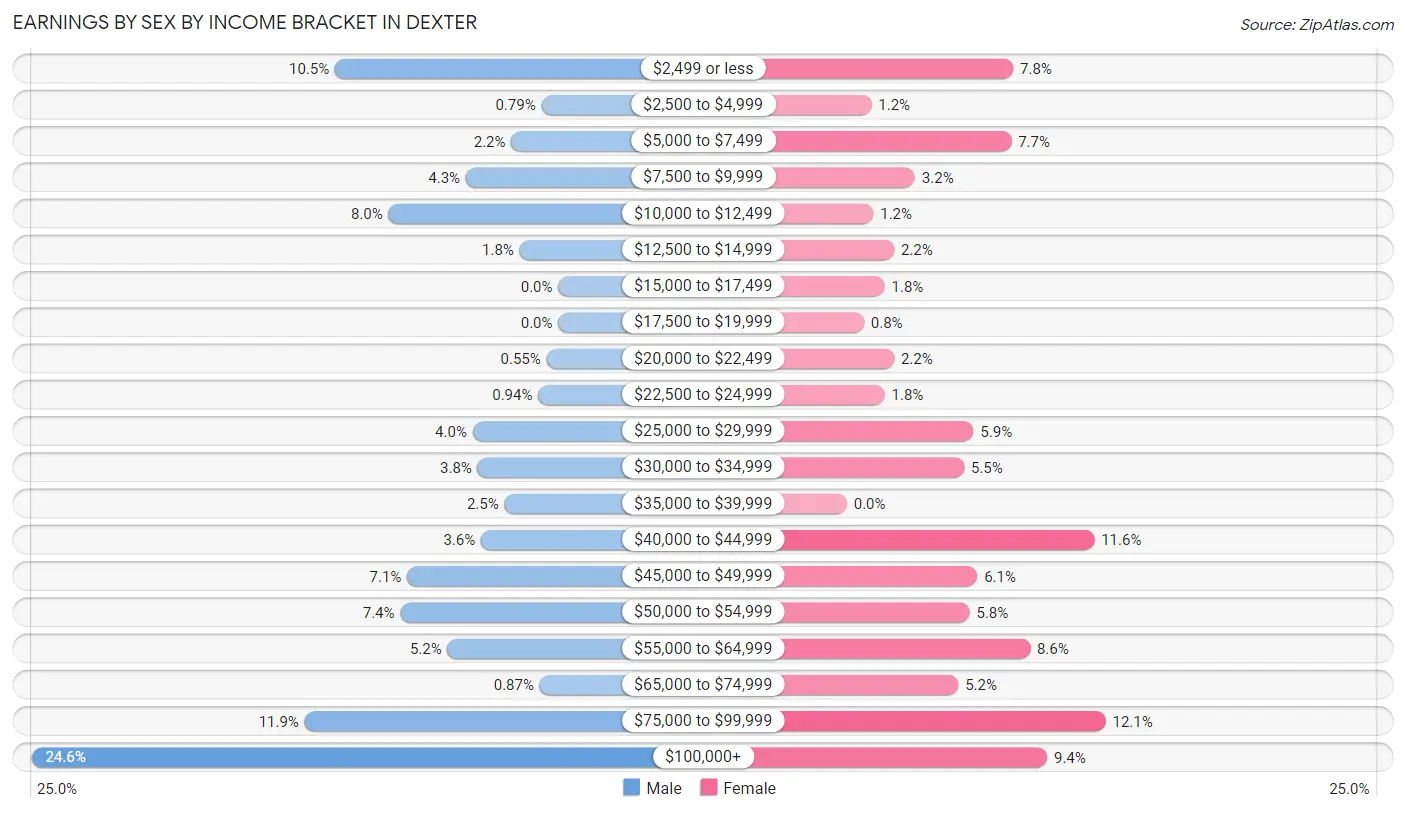
Earnings by Sex by Income Bracket in Dexter
The most common earnings brackets in Dexter are $100,000+ for men (313 | 24.6%) and $75,000 to $99,999 for women (137 | 12.1%).
| Income | Male | Female |
| $2,499 or less | 133 (10.5%) | 88 (7.8%) |
| $2,500 to $4,999 | 10 (0.8%) | 13 (1.1%) |
| $5,000 to $7,499 | 28 (2.2%) | 87 (7.7%) |
| $7,500 to $9,999 | 55 (4.3%) | 36 (3.2%) |
| $10,000 to $12,499 | 101 (8.0%) | 14 (1.2%) |
| $12,500 to $14,999 | 23 (1.8%) | 25 (2.2%) |
| $15,000 to $17,499 | 0 (0.0%) | 20 (1.8%) |
| $17,500 to $19,999 | 0 (0.0%) | 9 (0.8%) |
| $20,000 to $22,499 | 7 (0.5%) | 25 (2.2%) |
| $22,500 to $24,999 | 12 (0.9%) | 20 (1.8%) |
| $25,000 to $29,999 | 51 (4.0%) | 67 (5.9%) |
| $30,000 to $34,999 | 48 (3.8%) | 62 (5.5%) |
| $35,000 to $39,999 | 32 (2.5%) | 0 (0.0%) |
| $40,000 to $44,999 | 46 (3.6%) | 131 (11.6%) |
| $45,000 to $49,999 | 90 (7.1%) | 69 (6.1%) |
| $50,000 to $54,999 | 94 (7.4%) | 65 (5.8%) |
| $55,000 to $64,999 | 66 (5.2%) | 97 (8.6%) |
| $65,000 to $74,999 | 11 (0.9%) | 59 (5.2%) |
| $75,000 to $99,999 | 151 (11.9%) | 137 (12.1%) |
| $100,000+ | 313 (24.6%) | 106 (9.4%) |
| Total | 1,271 (100.0%) | 1,130 (100.0%) |
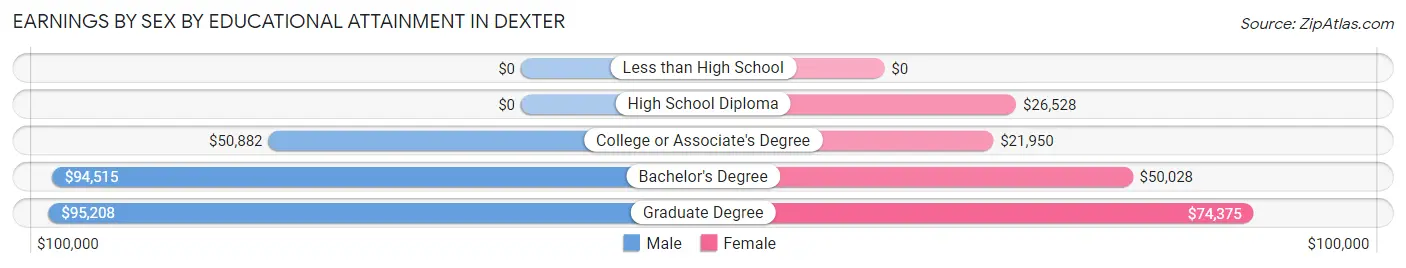
Earnings by Sex by Educational Attainment in Dexter
Average earnings in Dexter are $75,500 for men and $49,390 for women, a difference of 34.6%. Men with an educational attainment of graduate degree enjoy the highest average annual earnings of $95,208, while those with college or associate's degree education earn the least with $50,882. Women with an educational attainment of graduate degree earn the most with the average annual earnings of $74,375, while those with college or associate's degree education have the smallest earnings of $21,950.
| Educational Attainment | Male Income | Female Income |
| Less than High School | - | - |
| High School Diploma | - | - |
| College or Associate's Degree | $50,882 | $21,950 |
| Bachelor's Degree | $94,515 | $50,028 |
| Graduate Degree | $95,208 | $74,375 |
| Total | $75,500 | $49,390 |
Family Income in Dexter
Family Income Brackets in Dexter
According to the Dexter family income data, there are 252 families falling into the $100,000 to $149,999 income range, which is the most common income bracket and makes up 20.3% of all families.
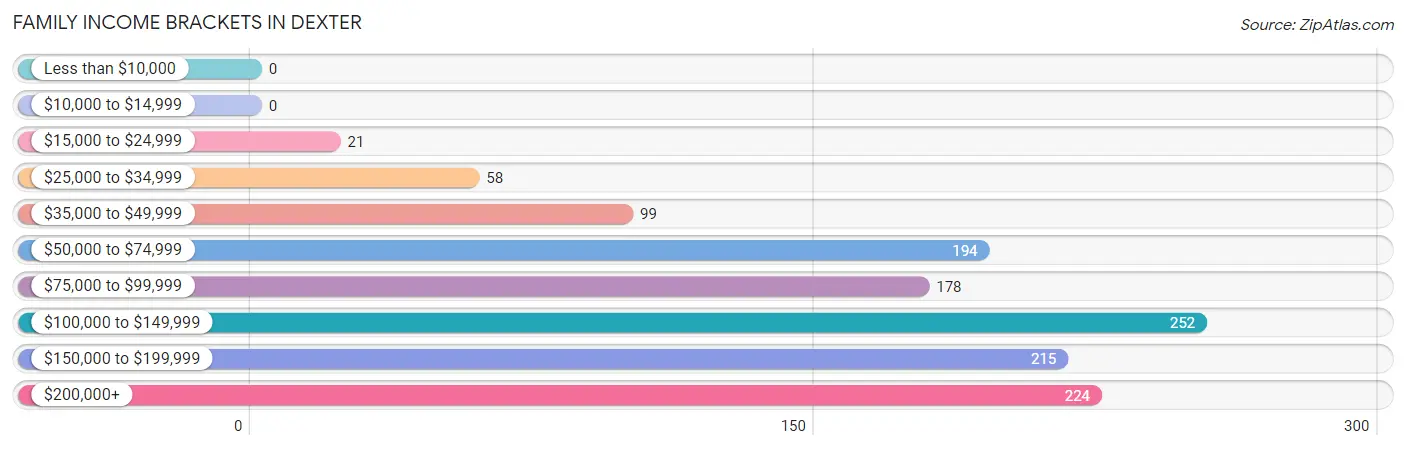
| Income Bracket | # Families | % Families |
| Less than $10,000 | 0 | 0.0% |
| $10,000 to $14,999 | 0 | 0.0% |
| $15,000 to $24,999 | 21 | 1.7% |
| $25,000 to $34,999 | 58 | 4.7% |
| $35,000 to $49,999 | 99 | 8.0% |
| $50,000 to $74,999 | 194 | 15.6% |
| $75,000 to $99,999 | 178 | 14.3% |
| $100,000 to $149,999 | 252 | 20.3% |
| $150,000 to $199,999 | 215 | 17.3% |
| $200,000+ | 224 | 18.0% |
Family Income by Famaliy Size in Dexter
5-person families (131 | 10.5%) account for the highest median family income in Dexter with $168,472 per family, while 2-person families (568 | 45.7%) have the highest median income of $53,203 per family member.
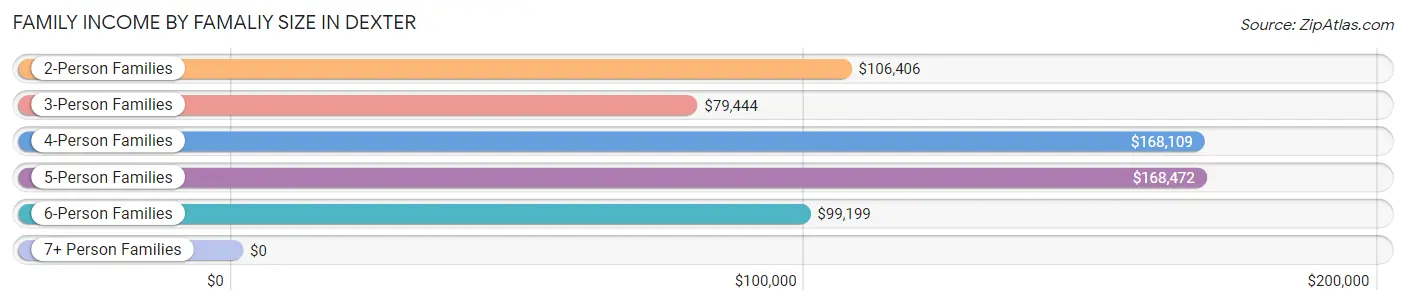
| Income Bracket | # Families | Median Income |
| 2-Person Families | 568 (45.7%) | $106,406 |
| 3-Person Families | 264 (21.2%) | $79,444 |
| 4-Person Families | 223 (17.9%) | $168,109 |
| 5-Person Families | 131 (10.5%) | $168,472 |
| 6-Person Families | 57 (4.6%) | $99,199 |
| 7+ Person Families | 0 (0.0%) | $0 |
| Total | 1,243 (100.0%) | $111,419 |
Family Income by Number of Earners in Dexter
The median family income in Dexter is $111,419, with families comprising 2 earners (461) having the highest median family income of $151,528, while families with 1 earner (455) have the lowest median family income of $65,536, accounting for 37.1% and 36.6% of families, respectively.
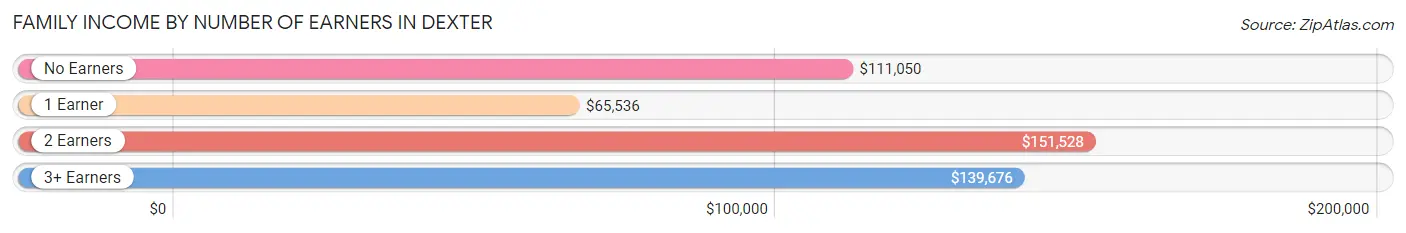
| Number of Earners | # Families | Median Income |
| No Earners | 190 (15.3%) | $111,050 |
| 1 Earner | 455 (36.6%) | $65,536 |
| 2 Earners | 461 (37.1%) | $151,528 |
| 3+ Earners | 137 (11.0%) | $139,676 |
| Total | 1,243 (100.0%) | $111,419 |
Household Income in Dexter
Household Income Brackets in Dexter
With 345 households falling in the category, the $75,000 to $99,999 income range is the most frequent in Dexter, accounting for 19.6% of all households.
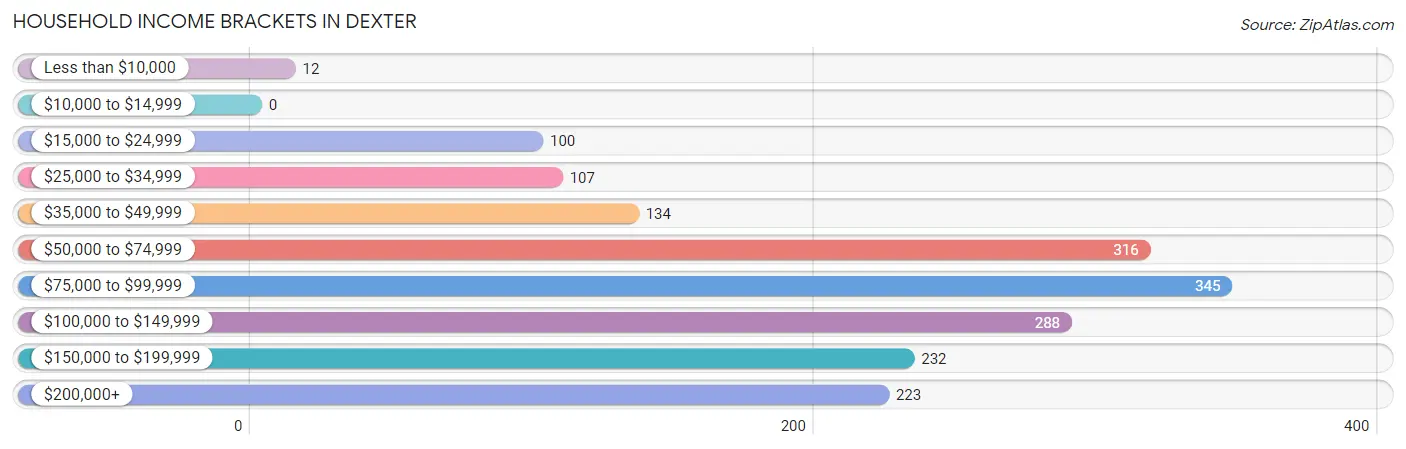
| Income Bracket | # Households | % Households |
| Less than $10,000 | 12 | 0.7% |
| $10,000 to $14,999 | 0 | 0.0% |
| $15,000 to $24,999 | 100 | 5.7% |
| $25,000 to $34,999 | 107 | 6.1% |
| $35,000 to $49,999 | 134 | 7.6% |
| $50,000 to $74,999 | 316 | 18.0% |
| $75,000 to $99,999 | 345 | 19.6% |
| $100,000 to $149,999 | 288 | 16.4% |
| $150,000 to $199,999 | 232 | 13.2% |
| $200,000+ | 223 | 12.7% |
Household Income by Householder Age in Dexter
The median household income in Dexter is $89,671, with the highest median household income of $99,399 found in the 45 to 64 years age bracket for the primary householder. A total of 731 households (41.6%) fall into this category. Meanwhile, the 25 to 44 years age bracket for the primary householder has the lowest median household income of $85,703, with 409 households (23.3%) in this group.
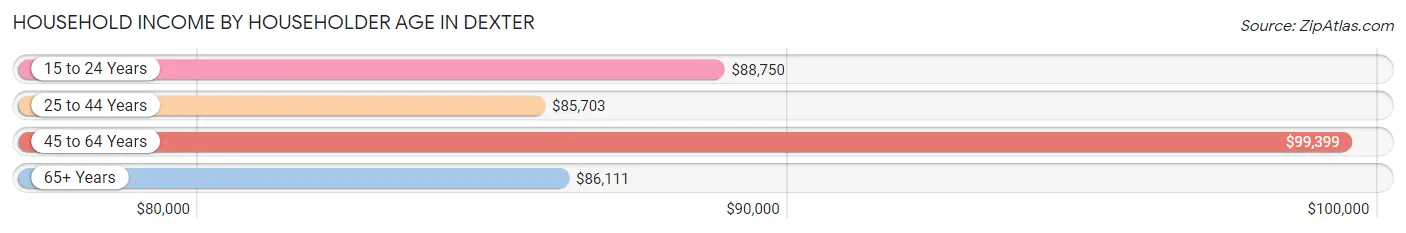
| Income Bracket | # Households | Median Income |
| 15 to 24 Years | 82 (4.7%) | $88,750 |
| 25 to 44 Years | 409 (23.3%) | $85,703 |
| 45 to 64 Years | 731 (41.6%) | $99,399 |
| 65+ Years | 536 (30.5%) | $86,111 |
| Total | 1,758 (100.0%) | $89,671 |
Poverty in Dexter
Income Below Poverty by Sex and Age in Dexter
With 2.4% poverty level for males and 1.6% for females among the residents of Dexter, 35 to 44 year old males and 18 to 24 year old females are the most vulnerable to poverty, with 27 males (9.5%) and 19 females (13.0%) in their respective age groups living below the poverty level.
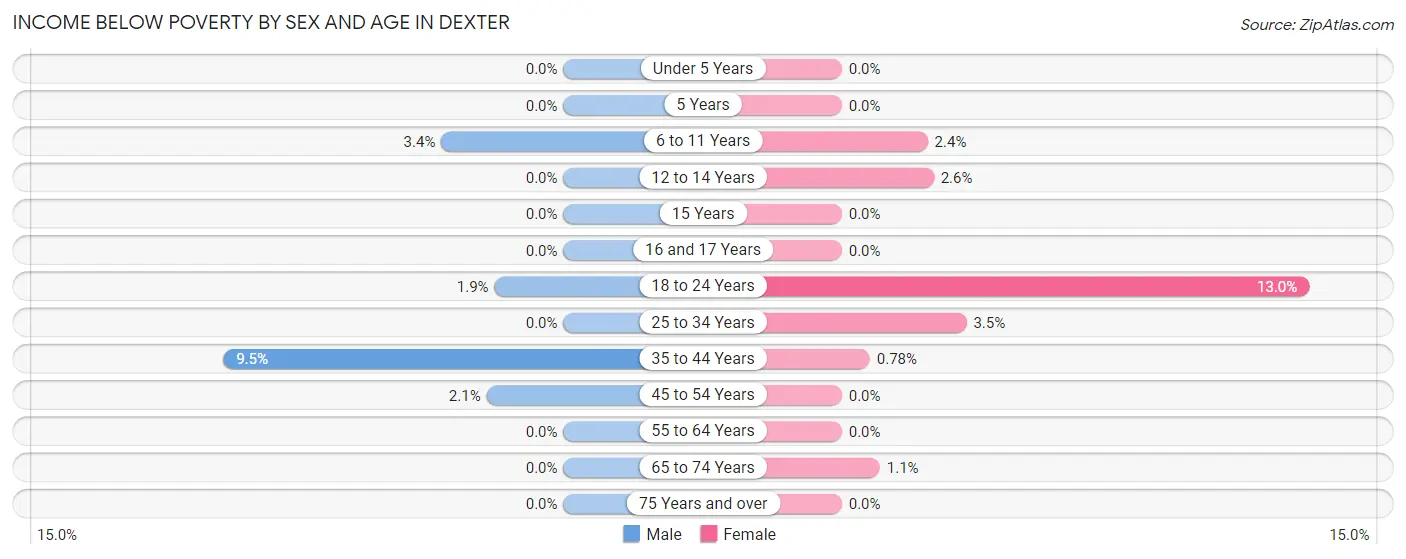
| Age Bracket | Male | Female |
| Under 5 Years | 0 (0.0%) | 0 (0.0%) |
| 5 Years | 0 (0.0%) | 0 (0.0%) |
| 6 to 11 Years | 9 (3.4%) | 7 (2.4%) |
| 12 to 14 Years | 0 (0.0%) | 2 (2.6%) |
| 15 Years | 0 (0.0%) | 0 (0.0%) |
| 16 and 17 Years | 0 (0.0%) | 0 (0.0%) |
| 18 to 24 Years | 6 (1.9%) | 19 (13.0%) |
| 25 to 34 Years | 0 (0.0%) | 5 (3.5%) |
| 35 to 44 Years | 27 (9.5%) | 2 (0.8%) |
| 45 to 54 Years | 10 (2.1%) | 0 (0.0%) |
| 55 to 64 Years | 0 (0.0%) | 0 (0.0%) |
| 65 to 74 Years | 0 (0.0%) | 3 (1.1%) |
| 75 Years and over | 0 (0.0%) | 0 (0.0%) |
| Total | 52 (2.4%) | 38 (1.6%) |
Income Above Poverty by Sex and Age in Dexter
According to the poverty statistics in Dexter, males aged under 5 years and females aged under 5 years are the age groups that are most secure financially, with 100.0% of males and 100.0% of females in these age groups living above the poverty line.
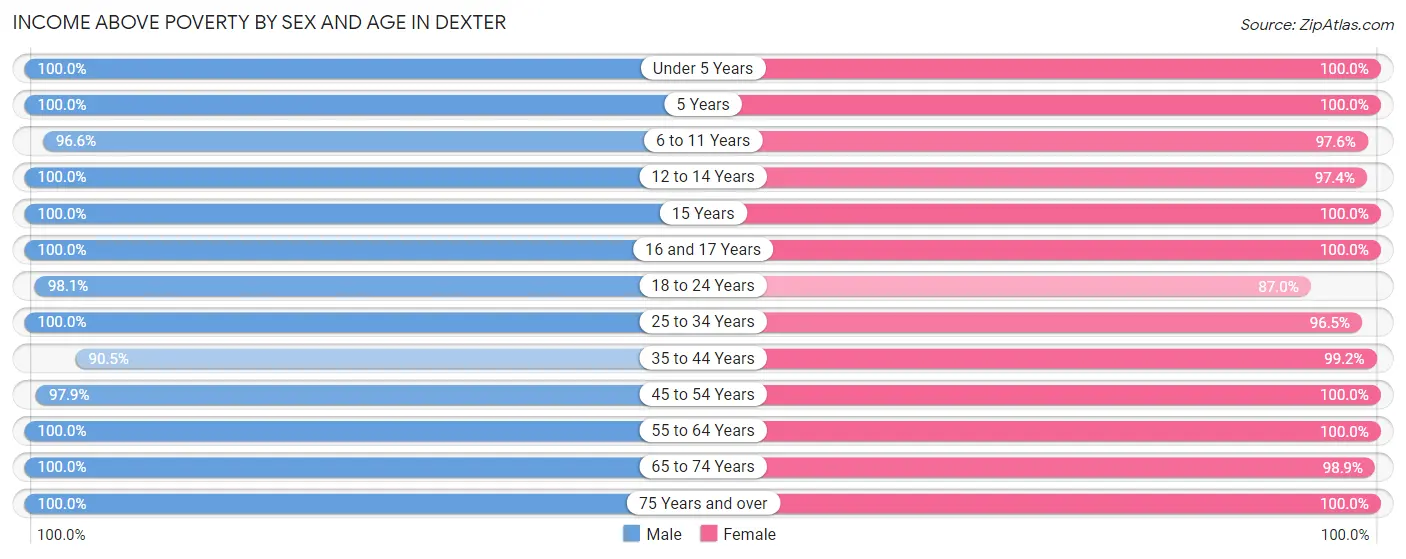
| Age Bracket | Male | Female |
| Under 5 Years | 171 (100.0%) | 93 (100.0%) |
| 5 Years | 56 (100.0%) | 24 (100.0%) |
| 6 to 11 Years | 256 (96.6%) | 286 (97.6%) |
| 12 to 14 Years | 78 (100.0%) | 76 (97.4%) |
| 15 Years | 15 (100.0%) | 24 (100.0%) |
| 16 and 17 Years | 110 (100.0%) | 126 (100.0%) |
| 18 to 24 Years | 307 (98.1%) | 127 (87.0%) |
| 25 to 34 Years | 42 (100.0%) | 139 (96.5%) |
| 35 to 44 Years | 258 (90.5%) | 254 (99.2%) |
| 45 to 54 Years | 458 (97.9%) | 406 (100.0%) |
| 55 to 64 Years | 114 (100.0%) | 196 (100.0%) |
| 65 to 74 Years | 142 (100.0%) | 280 (98.9%) |
| 75 Years and over | 115 (100.0%) | 245 (100.0%) |
| Total | 2,122 (97.6%) | 2,276 (98.4%) |
Income Below Poverty Among Married-Couple Families in Dexter
The poverty statistics for married-couple families in Dexter show that 0.8% or 7 of the total 908 families live below the poverty line. Families with 3 or 4 children have the highest poverty rate of 1.5%, comprising of 2 families. On the other hand, families with no children have the lowest poverty rate of 0.0%, which includes 0 families.
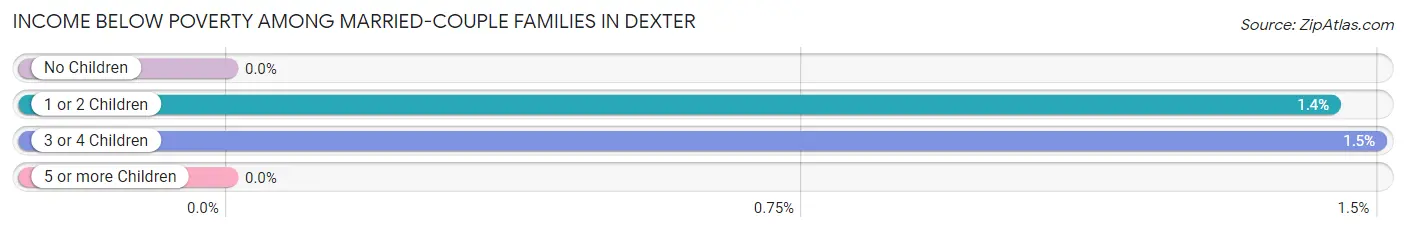
| Children | Above Poverty | Below Poverty |
| No Children | 428 (100.0%) | 0 (0.0%) |
| 1 or 2 Children | 342 (98.6%) | 5 (1.4%) |
| 3 or 4 Children | 131 (98.5%) | 2 (1.5%) |
| 5 or more Children | 0 (0.0%) | 0 (0.0%) |
| Total | 901 (99.2%) | 7 (0.8%) |
Income Below Poverty Among Single-Parent Households in Dexter
| Children | Single Father | Single Mother |
| No Children | 0 (0.0%) | 0 (0.0%) |
| 1 or 2 Children | 0 (0.0%) | 0 (0.0%) |
| 3 or 4 Children | 0 (0.0%) | 0 (0.0%) |
| 5 or more Children | 0 (0.0%) | 0 (0.0%) |
| Total | 0 (0.0%) | 0 (0.0%) |
Income Below Poverty Among Married-Couple vs Single-Parent Households in Dexter
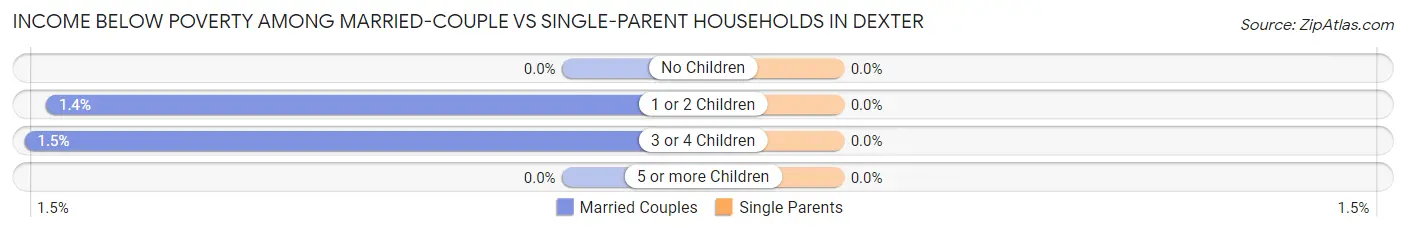
| Children | Married-Couple Families | Single-Parent Households |
| No Children | 0 (0.0%) | 0 (0.0%) |
| 1 or 2 Children | 5 (1.4%) | 0 (0.0%) |
| 3 or 4 Children | 2 (1.5%) | 0 (0.0%) |
| 5 or more Children | 0 (0.0%) | 0 (0.0%) |
| Total | 7 (0.8%) | 0 (0.0%) |
Race in Dexter
The most populous races in Dexter are White / Caucasian (4,283 | 95.1%), Hispanic or Latino (276 | 6.1%), and Two or more Races (138 | 3.1%).
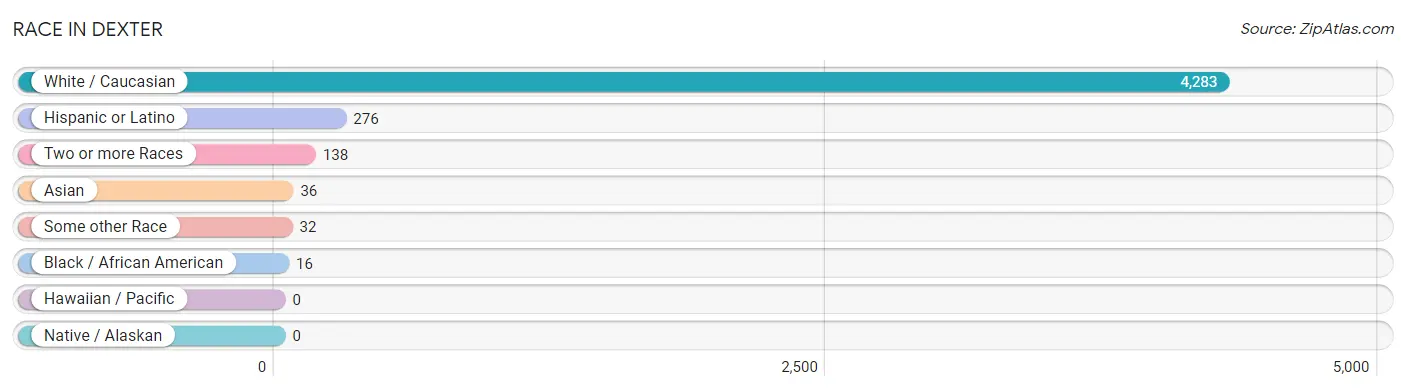
| Race | # Population | % Population |
| Asian | 36 | 0.8% |
| Black / African American | 16 | 0.4% |
| Hawaiian / Pacific | 0 | 0.0% |
| Hispanic or Latino | 276 | 6.1% |
| Native / Alaskan | 0 | 0.0% |
| White / Caucasian | 4,283 | 95.1% |
| Two or more Races | 138 | 3.1% |
| Some other Race | 32 | 0.7% |
| Total | 4,505 | 100.0% |
Ancestry in Dexter
The most populous ancestries reported in Dexter are German (1,231 | 27.3%), Irish (847 | 18.8%), English (659 | 14.6%), American (523 | 11.6%), and Italian (400 | 8.9%), together accounting for 81.2% of all Dexter residents.
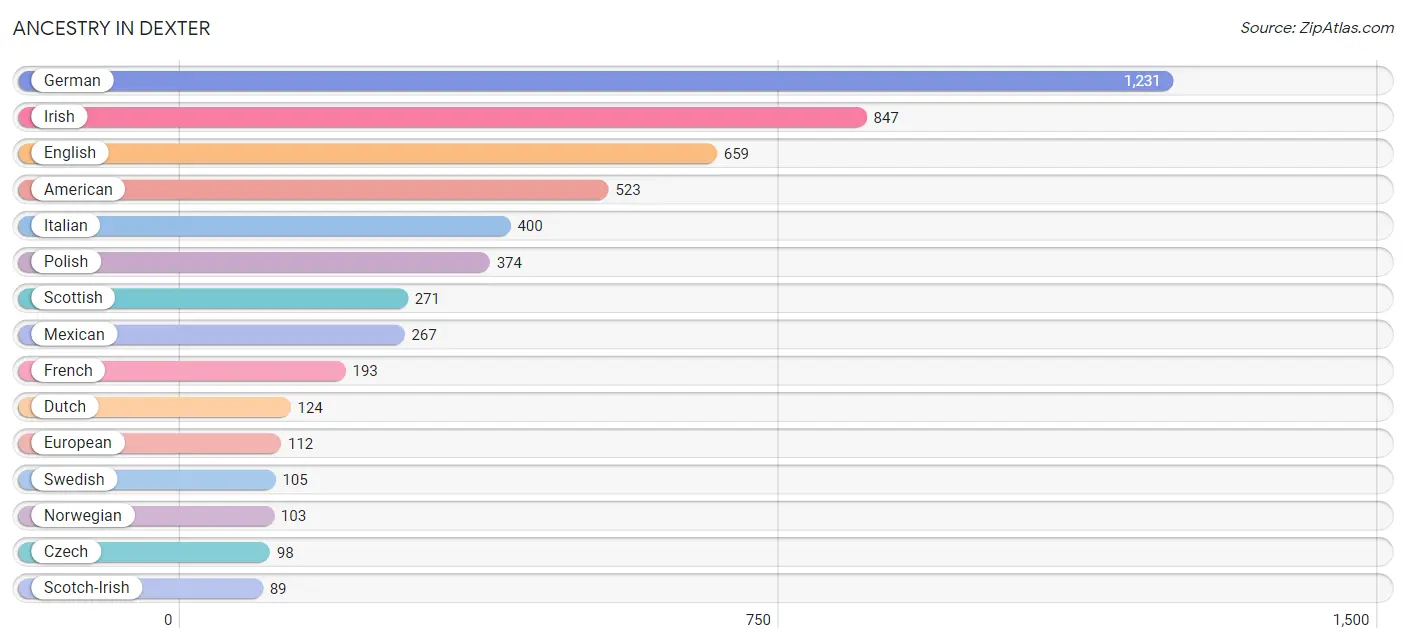
| Ancestry | # Population | % Population |
| American | 523 | 11.6% |
| Austrian | 12 | 0.3% |
| Belgian | 23 | 0.5% |
| Blackfeet | 39 | 0.9% |
| British | 32 | 0.7% |
| Burmese | 17 | 0.4% |
| Canadian | 36 | 0.8% |
| Celtic | 9 | 0.2% |
| Central American | 8 | 0.2% |
| Cherokee | 39 | 0.9% |
| Croatian | 8 | 0.2% |
| Czech | 98 | 2.2% |
| Czechoslovakian | 14 | 0.3% |
| Danish | 35 | 0.8% |
| Dutch | 124 | 2.8% |
| Eastern European | 13 | 0.3% |
| English | 659 | 14.6% |
| European | 112 | 2.5% |
| Finnish | 49 | 1.1% |
| French | 193 | 4.3% |
| French Canadian | 7 | 0.2% |
| German | 1,231 | 27.3% |
| Greek | 26 | 0.6% |
| Honduran | 8 | 0.2% |
| Hungarian | 16 | 0.4% |
| Indian (Asian) | 26 | 0.6% |
| Irish | 847 | 18.8% |
| Italian | 400 | 8.9% |
| Korean | 1 | 0.0% |
| Lithuanian | 7 | 0.2% |
| Mexican | 267 | 5.9% |
| Navajo | 2 | 0.0% |
| Norwegian | 103 | 2.3% |
| Polish | 374 | 8.3% |
| Romanian | 10 | 0.2% |
| Russian | 35 | 0.8% |
| Scandinavian | 35 | 0.8% |
| Scotch-Irish | 89 | 2.0% |
| Scottish | 271 | 6.0% |
| Slovak | 85 | 1.9% |
| Slovene | 16 | 0.4% |
| Spaniard | 1 | 0.0% |
| Swedish | 105 | 2.3% |
| Thai | 16 | 0.4% |
| Turkish | 7 | 0.2% |
| Welsh | 40 | 0.9% | View All 46 Rows |
Immigrants in Dexter
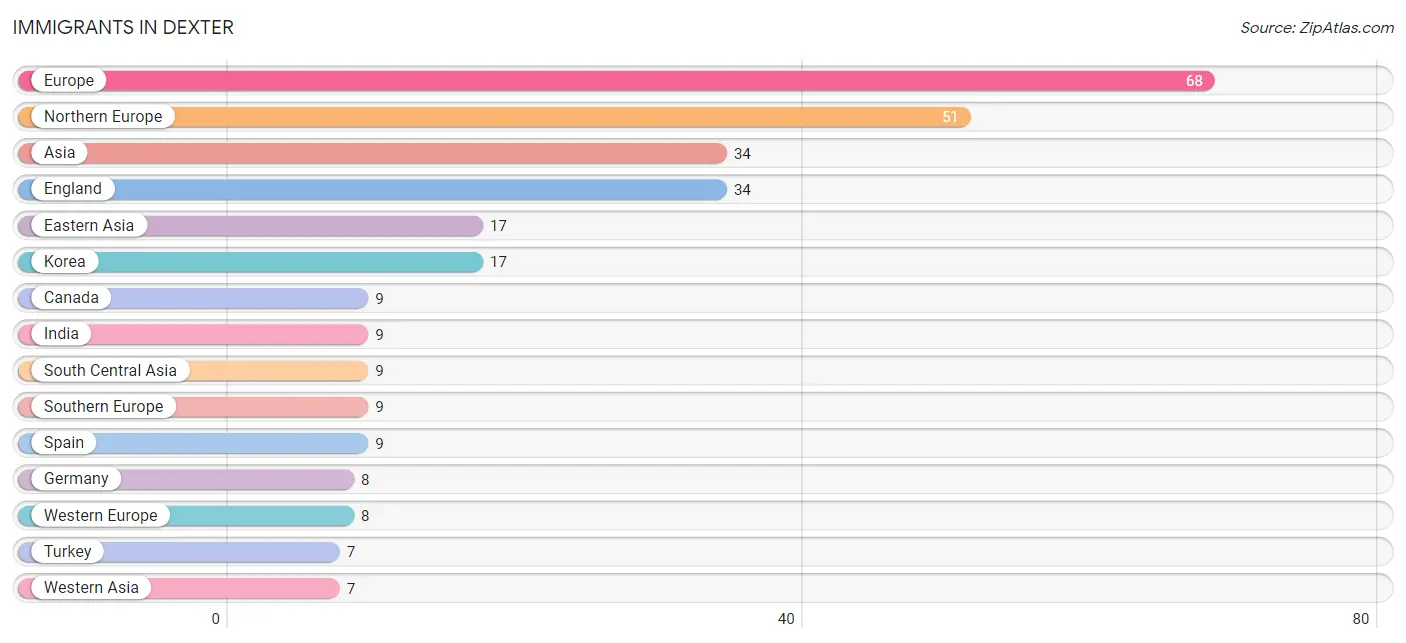
The most numerous immigrant groups reported in Dexter came from Europe (68 | 1.5%), Northern Europe (51 | 1.1%), Asia (34 | 0.7%), England (34 | 0.7%), and Eastern Asia (17 | 0.4%), together accounting for 4.5% of all Dexter residents.
| Immigration Origin | # Population | % Population |
| Asia | 34 | 0.7% |
| Canada | 9 | 0.2% |
| Eastern Asia | 17 | 0.4% |
| England | 34 | 0.7% |
| Europe | 68 | 1.5% |
| Germany | 8 | 0.2% |
| India | 9 | 0.2% |
| Korea | 17 | 0.4% |
| Northern Europe | 51 | 1.1% |
| Philippines | 1 | 0.0% |
| South Central Asia | 9 | 0.2% |
| South Eastern Asia | 1 | 0.0% |
| Southern Europe | 9 | 0.2% |
| Spain | 9 | 0.2% |
| Turkey | 7 | 0.2% |
| Western Asia | 7 | 0.2% |
| Western Europe | 8 | 0.2% | View All 17 Rows |
Sex and Age in Dexter
Sex and Age in Dexter
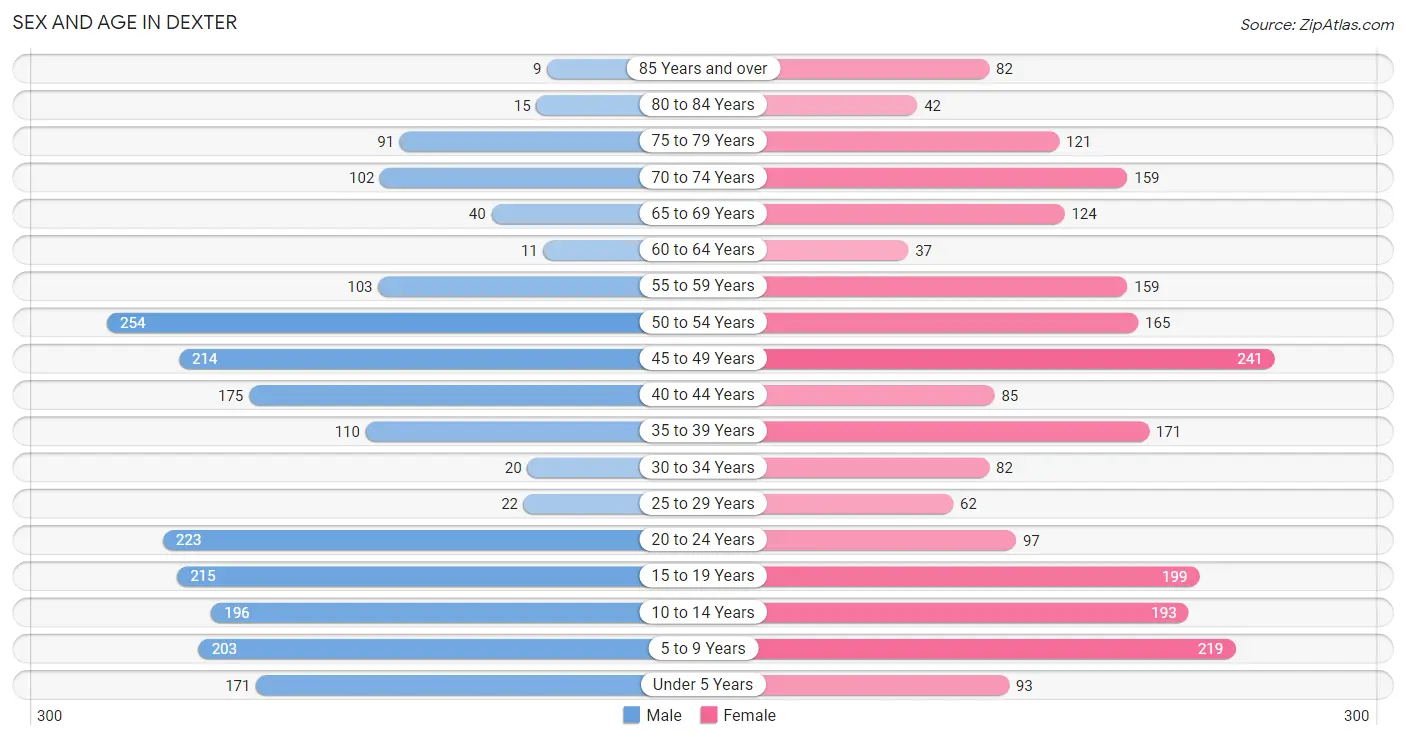
The most populous age groups in Dexter are 50 to 54 Years (254 | 11.7%) for men and 45 to 49 Years (241 | 10.3%) for women.
| Age Bracket | Male | Female |
| Under 5 Years | 171 (7.9%) | 93 (4.0%) |
| 5 to 9 Years | 203 (9.3%) | 219 (9.4%) |
| 10 to 14 Years | 196 (9.0%) | 193 (8.3%) |
| 15 to 19 Years | 215 (9.9%) | 199 (8.5%) |
| 20 to 24 Years | 223 (10.3%) | 97 (4.2%) |
| 25 to 29 Years | 22 (1.0%) | 62 (2.7%) |
| 30 to 34 Years | 20 (0.9%) | 82 (3.5%) |
| 35 to 39 Years | 110 (5.1%) | 171 (7.3%) |
| 40 to 44 Years | 175 (8.1%) | 85 (3.6%) |
| 45 to 49 Years | 214 (9.8%) | 241 (10.3%) |
| 50 to 54 Years | 254 (11.7%) | 165 (7.1%) |
| 55 to 59 Years | 103 (4.7%) | 159 (6.8%) |
| 60 to 64 Years | 11 (0.5%) | 37 (1.6%) |
| 65 to 69 Years | 40 (1.8%) | 124 (5.3%) |
| 70 to 74 Years | 102 (4.7%) | 159 (6.8%) |
| 75 to 79 Years | 91 (4.2%) | 121 (5.2%) |
| 80 to 84 Years | 15 (0.7%) | 42 (1.8%) |
| 85 Years and over | 9 (0.4%) | 82 (3.5%) |
| Total | 2,174 (100.0%) | 2,331 (100.0%) |
Families and Households in Dexter
Median Family Size in Dexter
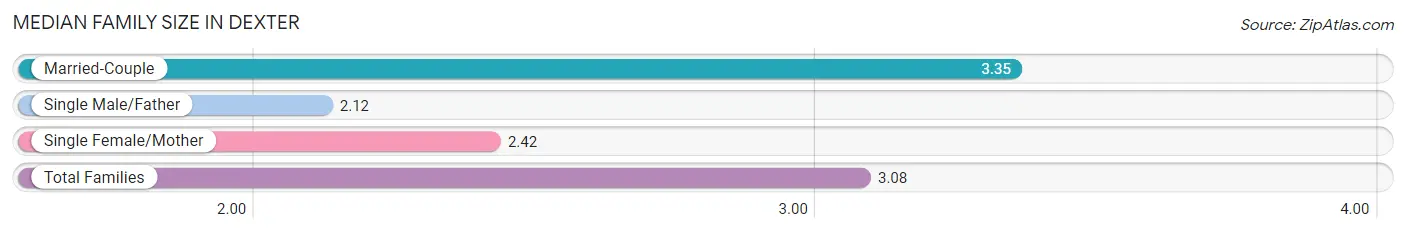
The median family size in Dexter is 3.08 persons per family, with married-couple families (908 | 73.1%) accounting for the largest median family size of 3.35 persons per family. On the other hand, single male/father families (81 | 6.5%) represent the smallest median family size with 2.12 persons per family.
| Family Type | # Families | Family Size |
| Married-Couple | 908 (73.1%) | 3.35 |
| Single Male/Father | 81 (6.5%) | 2.12 |
| Single Female/Mother | 254 (20.4%) | 2.42 |
| Total Families | 1,243 (100.0%) | 3.08 |
Median Household Size in Dexter
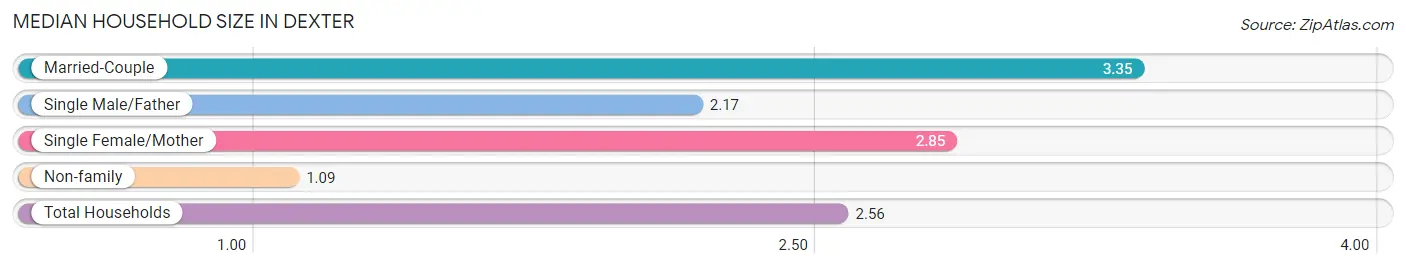
The median household size in Dexter is 2.56 persons per household, with married-couple households (908 | 51.6%) accounting for the largest median household size of 3.35 persons per household. non-family households (515 | 29.3%) represent the smallest median household size with 1.09 persons per household.
| Household Type | # Households | Household Size |
| Married-Couple | 908 (51.6%) | 3.35 |
| Single Male/Father | 81 (4.6%) | 2.17 |
| Single Female/Mother | 254 (14.4%) | 2.85 |
| Non-family | 515 (29.3%) | 1.09 |
| Total Households | 1,758 (100.0%) | 2.56 |
Household Size by Marriage Status in Dexter
Out of a total of 1,758 households in Dexter, 1,243 (70.7%) are family households, while 515 (29.3%) are nonfamily households. The most numerous type of family households are 2-person households, comprising 485, and the most common type of nonfamily households are 1-person households, comprising 471.
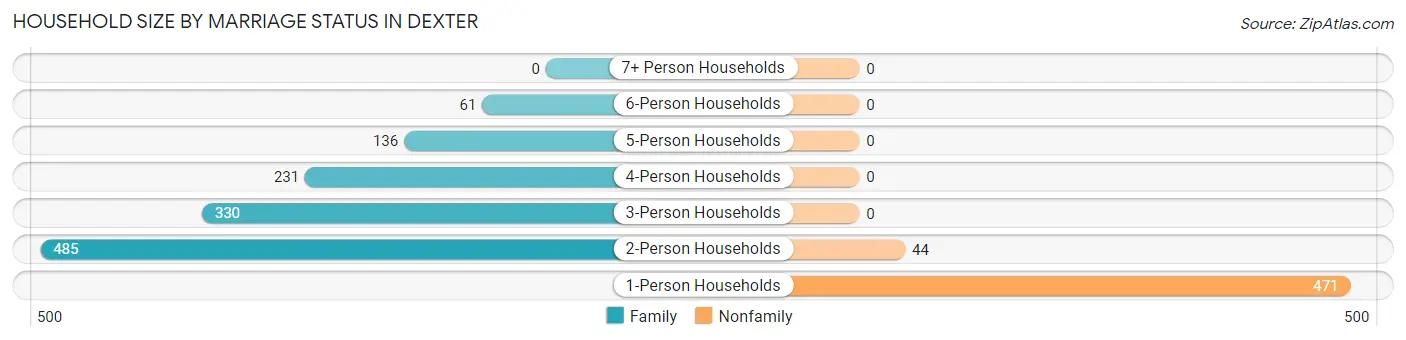
| Household Size | Family Households | Nonfamily Households |
| 1-Person Households | - | 471 (26.8%) |
| 2-Person Households | 485 (27.6%) | 44 (2.5%) |
| 3-Person Households | 330 (18.8%) | 0 (0.0%) |
| 4-Person Households | 231 (13.1%) | 0 (0.0%) |
| 5-Person Households | 136 (7.7%) | 0 (0.0%) |
| 6-Person Households | 61 (3.5%) | 0 (0.0%) |
| 7+ Person Households | 0 (0.0%) | 0 (0.0%) |
| Total | 1,243 (70.7%) | 515 (29.3%) |
Female Fertility in Dexter
Fertility by Age in Dexter
Average fertility rate in Dexter is 66.0 births per 1,000 women. Women in the age bracket of 20 to 34 years have the highest fertility rate with 270.0 births per 1,000 women. Women in the age bracket of 20 to 34 years acount for 100.0% of all women with births.
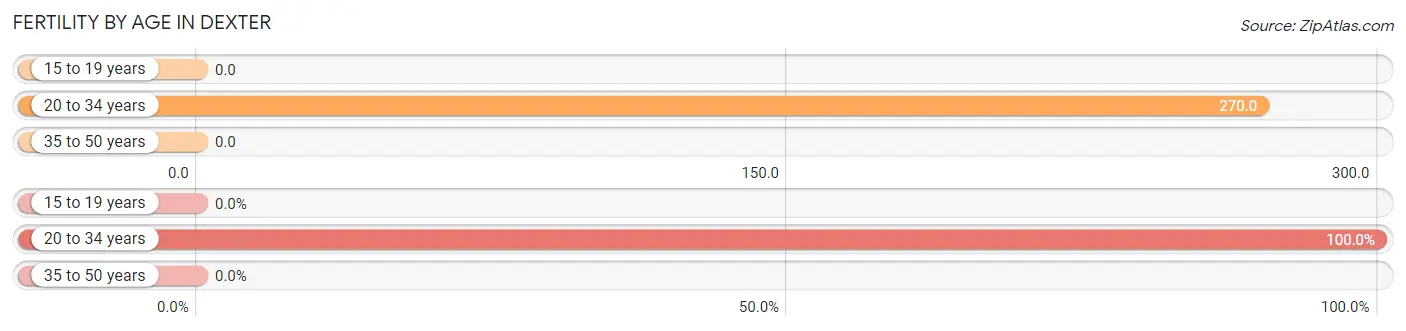
| Age Bracket | Women with Births | Births / 1,000 Women |
| 15 to 19 years | 0 (0.0%) | 0.0 |
| 20 to 34 years | 65 (100.0%) | 270.0 |
| 35 to 50 years | 0 (0.0%) | 0.0 |
| Total | 65 (100.0%) | 66.0 |
Fertility by Age by Marriage Status in Dexter
10.8% of women with births (65) in Dexter are married. The highest percentage of unmarried women with births falls into 20 to 34 years age bracket with 89.2% of them unmarried at the time of birth, while the lowest percentage of unmarried women with births belong to 20 to 34 years age bracket with 89.2% of them unmarried.
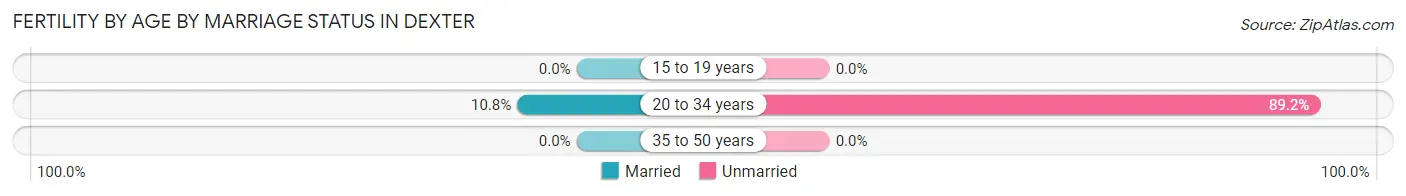
| Age Bracket | Married | Unmarried |
| 15 to 19 years | 0 (0.0%) | 0 (0.0%) |
| 20 to 34 years | 7 (10.8%) | 58 (89.2%) |
| 35 to 50 years | 0 (0.0%) | 0 (0.0%) |
| Total | 7 (10.8%) | 58 (89.2%) |
Fertility by Education in Dexter
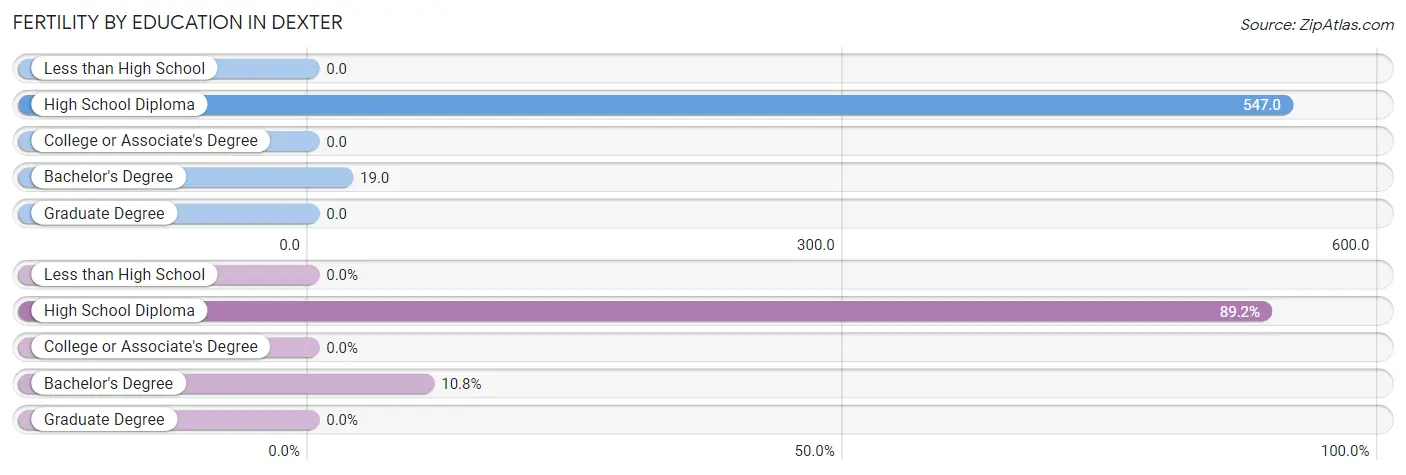
| Educational Attainment | Women with Births | Births / 1,000 Women |
| Less than High School | 0 (0.0%) | 0.0 |
| High School Diploma | 58 (89.2%) | 547.0 |
| College or Associate's Degree | 0 (0.0%) | 0.0 |
| Bachelor's Degree | 7 (10.8%) | 19.0 |
| Graduate Degree | 0 (0.0%) | 0.0 |
| Total | 65 (100.0%) | 66.0 |
Fertility by Education by Marriage Status in Dexter
89.2% of women with births in Dexter are unmarried. Women with the educational attainment of bachelor's degree are most likely to be married with 100.0% of them married at childbirth, while women with the educational attainment of high school diploma are least likely to be married with 100.0% of them unmarried at childbirth.
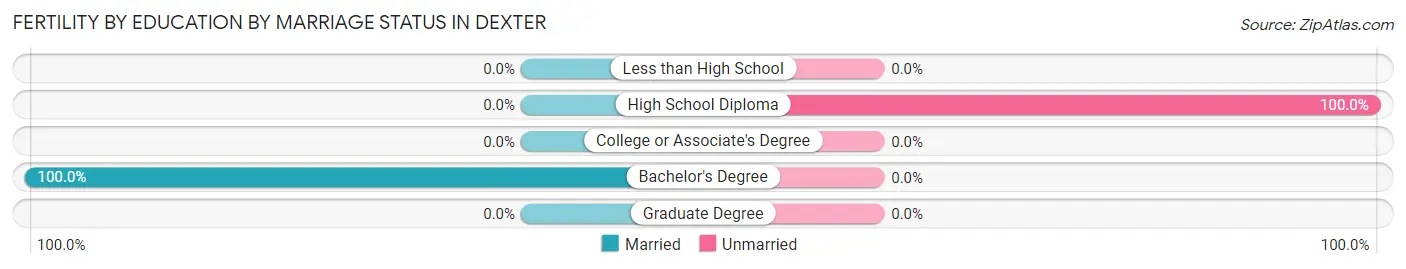
| Educational Attainment | Married | Unmarried |
| Less than High School | 0 (0.0%) | 0 (0.0%) |
| High School Diploma | 0 (0.0%) | 58 (100.0%) |
| College or Associate's Degree | 0 (0.0%) | 0 (0.0%) |
| Bachelor's Degree | 7 (100.0%) | 0 (0.0%) |
| Graduate Degree | 0 (0.0%) | 0 (0.0%) |
| Total | 7 (10.8%) | 58 (89.2%) |
Employment Characteristics in Dexter
Employment by Class of Employer in Dexter
Among the 2,192 employed individuals in Dexter, private company employees (1,335 | 60.9%), not-for-profit organizations (200 | 9.1%), and state government employees (197 | 9.0%) make up the most common classes of employment.
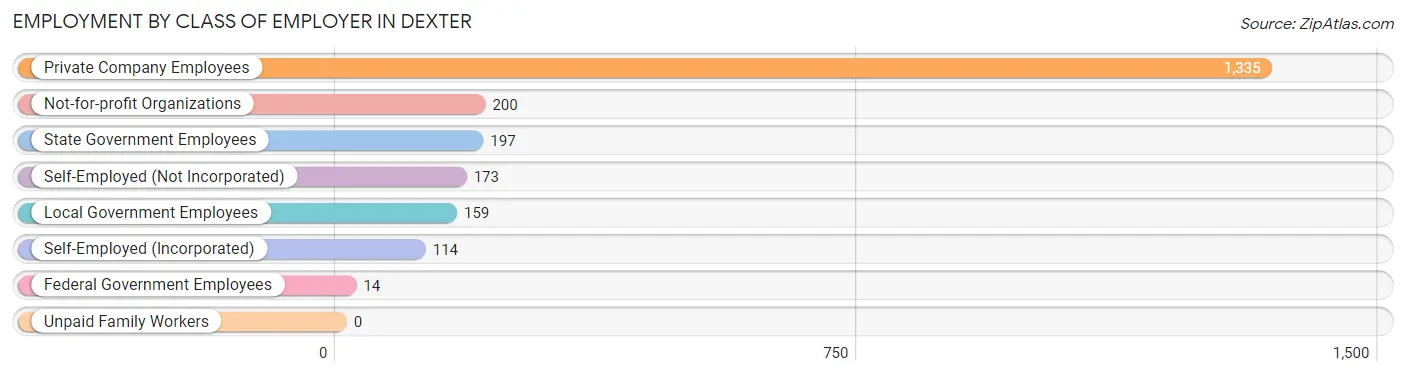
| Employer Class | # Employees | % Employees |
| Private Company Employees | 1,335 | 60.9% |
| Self-Employed (Incorporated) | 114 | 5.2% |
| Self-Employed (Not Incorporated) | 173 | 7.9% |
| Not-for-profit Organizations | 200 | 9.1% |
| Local Government Employees | 159 | 7.2% |
| State Government Employees | 197 | 9.0% |
| Federal Government Employees | 14 | 0.6% |
| Unpaid Family Workers | 0 | 0.0% |
| Total | 2,192 | 100.0% |
Employment Status by Age in Dexter
According to the labor force statistics for Dexter, out of the total population over 16 years of age (3,391), 68.7% or 2,330 individuals are in the labor force, with 2.7% or 63 of them unemployed. The age group with the highest labor force participation rate is 25 to 29 years, with 100.0% or 84 individuals in the labor force. Within the labor force, the 16 to 19 years age range has the highest percentage of unemployed individuals, with 16.3% or 31 of them being unemployed.
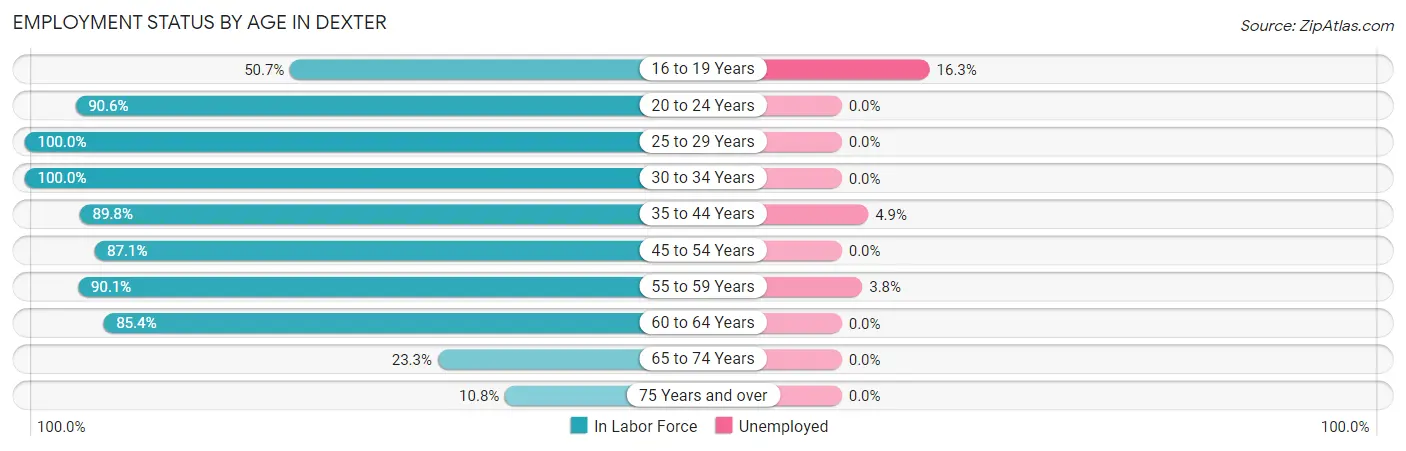
| Age Bracket | In Labor Force | Unemployed |
| 16 to 19 Years | 190 (50.7%) | 31 (16.3%) |
| 20 to 24 Years | 290 (90.6%) | 0 (0.0%) |
| 25 to 29 Years | 84 (100.0%) | 0 (0.0%) |
| 30 to 34 Years | 102 (100.0%) | 0 (0.0%) |
| 35 to 44 Years | 486 (89.8%) | 24 (4.9%) |
| 45 to 54 Years | 761 (87.1%) | 0 (0.0%) |
| 55 to 59 Years | 236 (90.1%) | 9 (3.8%) |
| 60 to 64 Years | 41 (85.4%) | 0 (0.0%) |
| 65 to 74 Years | 99 (23.3%) | 0 (0.0%) |
| 75 Years and over | 39 (10.8%) | 0 (0.0%) |
| Total | 2,330 (68.7%) | 63 (2.7%) |
Employment Status by Educational Attainment in Dexter
According to labor force statistics for Dexter, 89.5% of individuals (1,710) out of the total population between 25 and 64 years of age (1,911) are in the labor force, with 1.9% or 32 of them being unemployed. The group with the highest labor force participation rate are those with the educational attainment of college / associate degree, with 96.2% or 434 individuals in the labor force. Within the labor force, individuals with college / associate degree education have the highest percentage of unemployment, with 4.1% or 18 of them being unemployed.
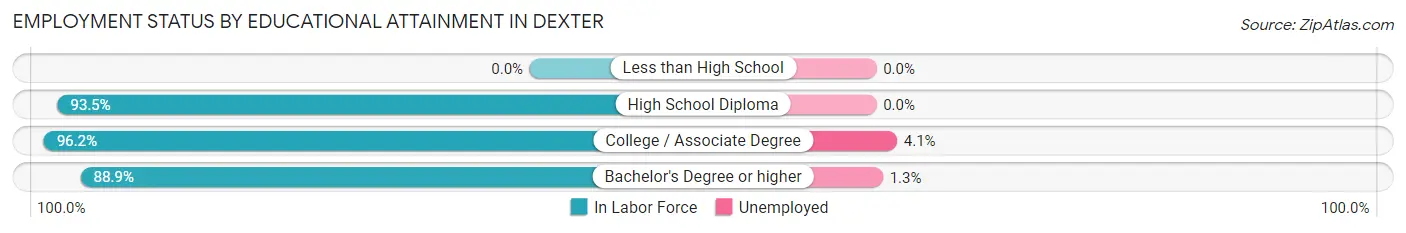
| Educational Attainment | In Labor Force | Unemployed |
| Less than High School | 0 (0.0%) | 0 (0.0%) |
| High School Diploma | 100 (93.5%) | 0 (0.0%) |
| College / Associate Degree | 434 (96.2%) | 18 (4.1%) |
| Bachelor's Degree or higher | 1,176 (88.9%) | 17 (1.3%) |
| Total | 1,710 (89.5%) | 36 (1.9%) |
Employment Occupations by Sex in Dexter
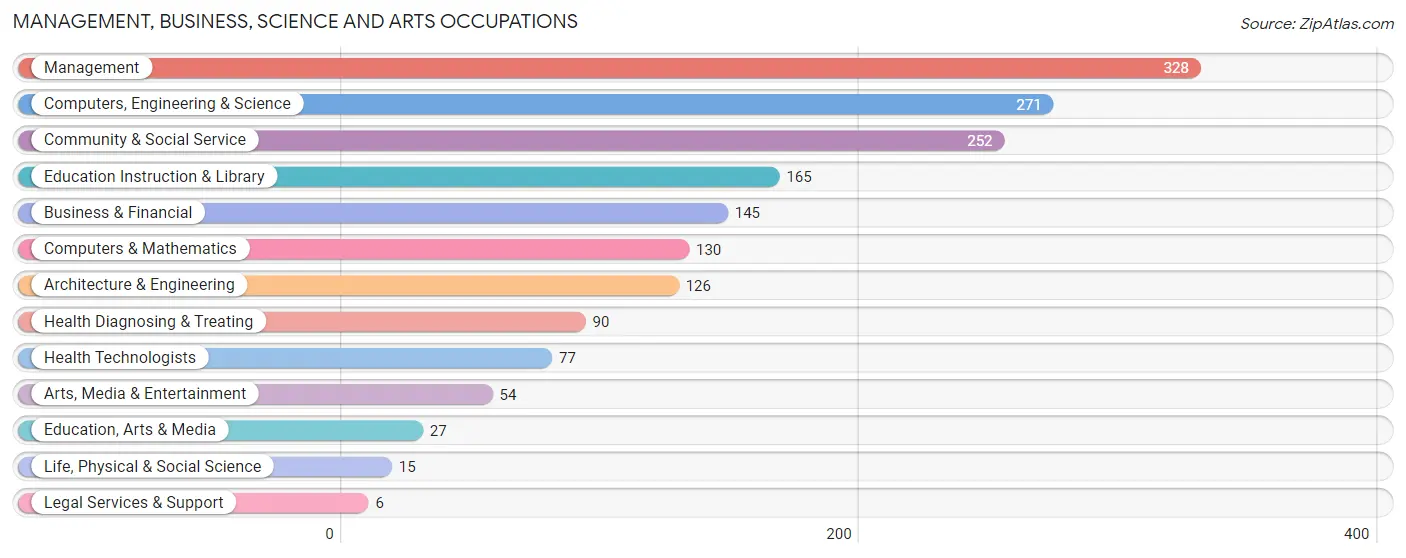
Management, Business, Science and Arts Occupations
The most common Management, Business, Science and Arts occupations in Dexter are Management (328 | 14.5%), Computers, Engineering & Science (271 | 12.0%), Community & Social Service (252 | 11.1%), Education Instruction & Library (165 | 7.3%), and Business & Financial (145 | 6.4%).
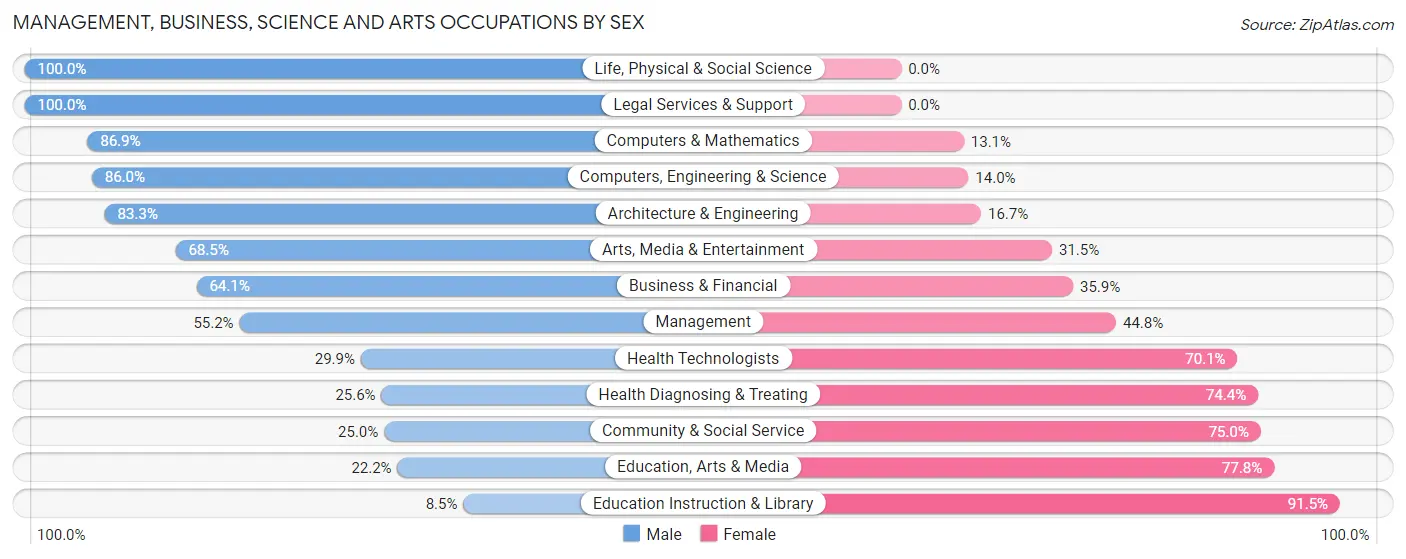
Management, Business, Science and Arts Occupations by Sex
Within the Management, Business, Science and Arts occupations in Dexter, the most male-oriented occupations are Life, Physical & Social Science (100.0%), Legal Services & Support (100.0%), and Computers & Mathematics (86.9%), while the most female-oriented occupations are Education Instruction & Library (91.5%), Education, Arts & Media (77.8%), and Community & Social Service (75.0%).
| Occupation | Male | Female |
| Management | 181 (55.2%) | 147 (44.8%) |
| Business & Financial | 93 (64.1%) | 52 (35.9%) |
| Computers, Engineering & Science | 233 (86.0%) | 38 (14.0%) |
| Computers & Mathematics | 113 (86.9%) | 17 (13.1%) |
| Architecture & Engineering | 105 (83.3%) | 21 (16.7%) |
| Life, Physical & Social Science | 15 (100.0%) | 0 (0.0%) |
| Community & Social Service | 63 (25.0%) | 189 (75.0%) |
| Education, Arts & Media | 6 (22.2%) | 21 (77.8%) |
| Legal Services & Support | 6 (100.0%) | 0 (0.0%) |
| Education Instruction & Library | 14 (8.5%) | 151 (91.5%) |
| Arts, Media & Entertainment | 37 (68.5%) | 17 (31.5%) |
| Health Diagnosing & Treating | 23 (25.6%) | 67 (74.4%) |
| Health Technologists | 23 (29.9%) | 54 (70.1%) |
| Total (Category) | 593 (54.6%) | 493 (45.4%) |
| Total (Overall) | 1,167 (51.5%) | 1,097 (48.4%) |
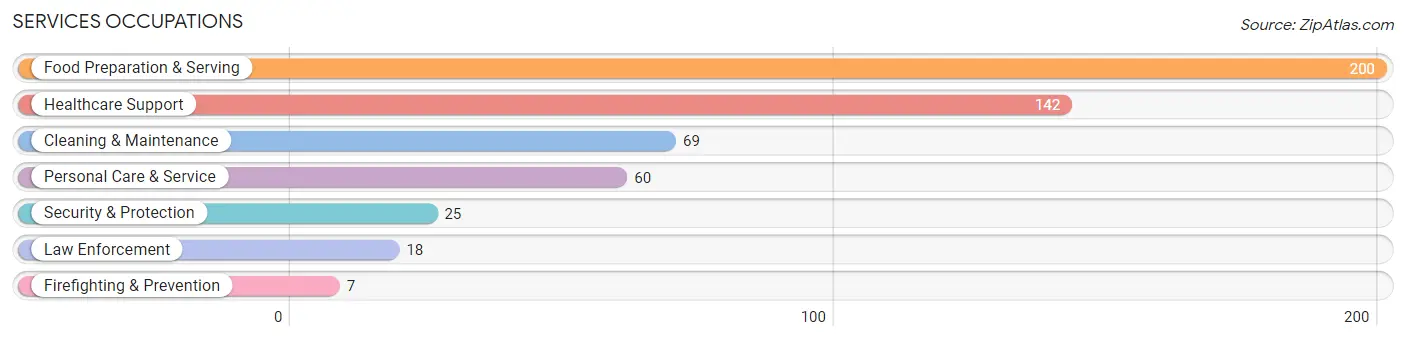
Services Occupations
The most common Services occupations in Dexter are Food Preparation & Serving (200 | 8.8%), Healthcare Support (142 | 6.3%), Cleaning & Maintenance (69 | 3.0%), Personal Care & Service (60 | 2.6%), and Security & Protection (25 | 1.1%).
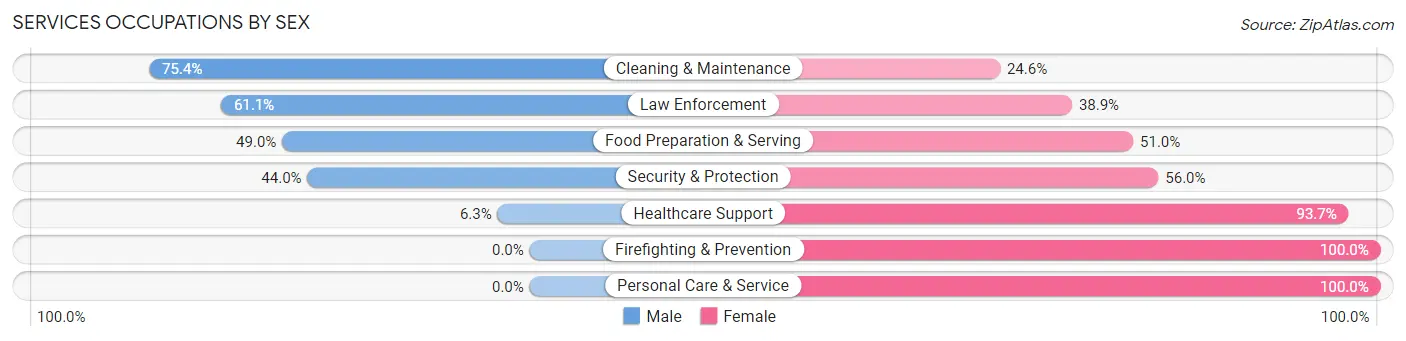
Services Occupations by Sex
Within the Services occupations in Dexter, the most male-oriented occupations are Cleaning & Maintenance (75.4%), Law Enforcement (61.1%), and Food Preparation & Serving (49.0%), while the most female-oriented occupations are Firefighting & Prevention (100.0%), Personal Care & Service (100.0%), and Healthcare Support (93.7%).
| Occupation | Male | Female |
| Healthcare Support | 9 (6.3%) | 133 (93.7%) |
| Security & Protection | 11 (44.0%) | 14 (56.0%) |
| Firefighting & Prevention | 0 (0.0%) | 7 (100.0%) |
| Law Enforcement | 11 (61.1%) | 7 (38.9%) |
| Food Preparation & Serving | 98 (49.0%) | 102 (51.0%) |
| Cleaning & Maintenance | 52 (75.4%) | 17 (24.6%) |
| Personal Care & Service | 0 (0.0%) | 60 (100.0%) |
| Total (Category) | 170 (34.3%) | 326 (65.7%) |
| Total (Overall) | 1,167 (51.5%) | 1,097 (48.4%) |
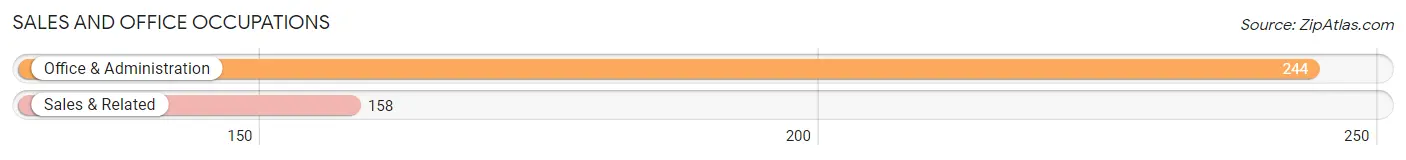
Sales and Office Occupations
The most common Sales and Office occupations in Dexter are Office & Administration (244 | 10.8%), and Sales & Related (158 | 7.0%).
Sales and Office Occupations by Sex
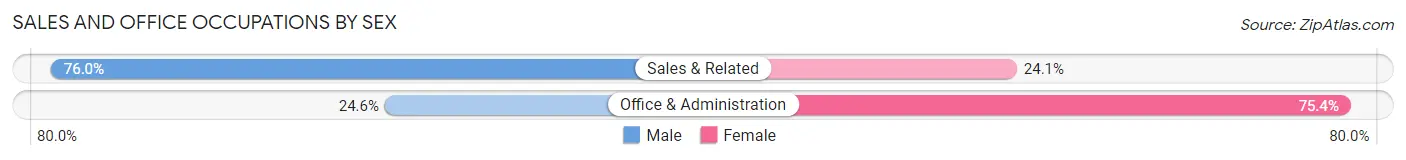
| Occupation | Male | Female |
| Sales & Related | 120 (75.9%) | 38 (24.0%) |
| Office & Administration | 60 (24.6%) | 184 (75.4%) |
| Total (Category) | 180 (44.8%) | 222 (55.2%) |
| Total (Overall) | 1,167 (51.5%) | 1,097 (48.4%) |
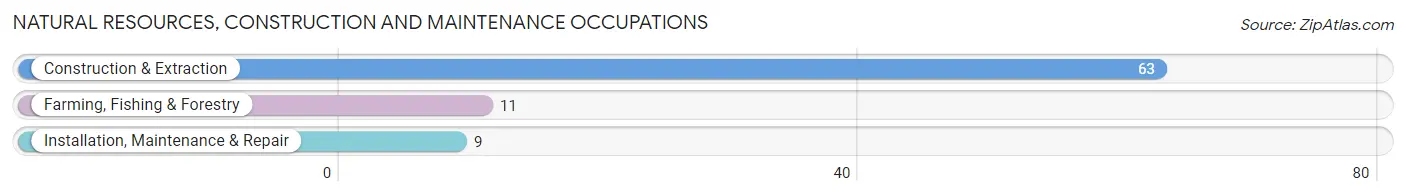
Natural Resources, Construction and Maintenance Occupations
The most common Natural Resources, Construction and Maintenance occupations in Dexter are Construction & Extraction (63 | 2.8%), Farming, Fishing & Forestry (11 | 0.5%), and Installation, Maintenance & Repair (9 | 0.4%).
Natural Resources, Construction and Maintenance Occupations by Sex
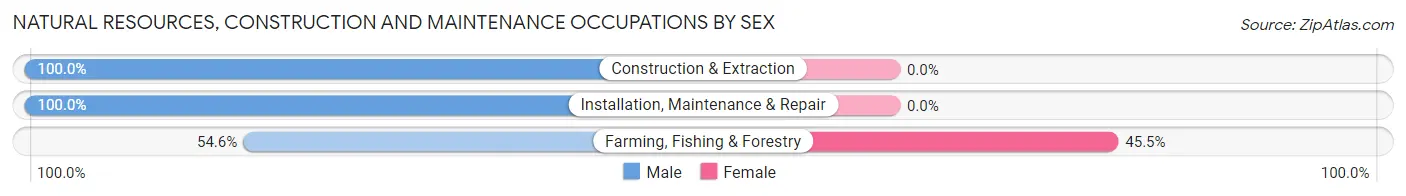
| Occupation | Male | Female |
| Farming, Fishing & Forestry | 6 (54.5%) | 5 (45.5%) |
| Construction & Extraction | 63 (100.0%) | 0 (0.0%) |
| Installation, Maintenance & Repair | 9 (100.0%) | 0 (0.0%) |
| Total (Category) | 78 (94.0%) | 5 (6.0%) |
| Total (Overall) | 1,167 (51.5%) | 1,097 (48.4%) |
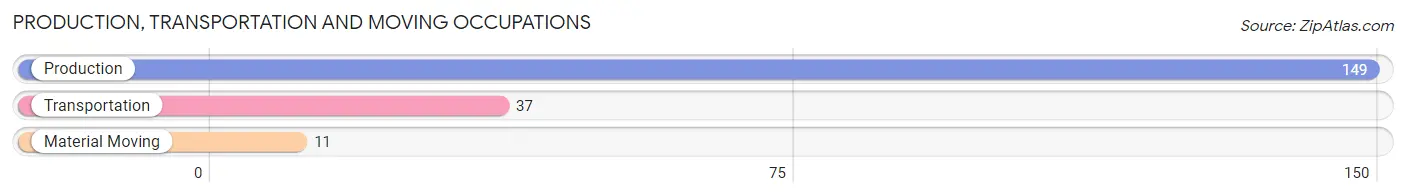
Production, Transportation and Moving Occupations
The most common Production, Transportation and Moving occupations in Dexter are Production (149 | 6.6%), Transportation (37 | 1.6%), and Material Moving (11 | 0.5%).
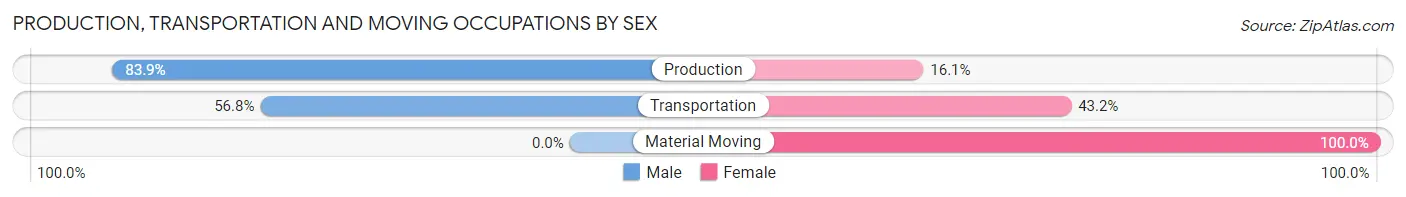
Production, Transportation and Moving Occupations by Sex
| Occupation | Male | Female |
| Production | 125 (83.9%) | 24 (16.1%) |
| Transportation | 21 (56.8%) | 16 (43.2%) |
| Material Moving | 0 (0.0%) | 11 (100.0%) |
| Total (Category) | 146 (74.1%) | 51 (25.9%) |
| Total (Overall) | 1,167 (51.5%) | 1,097 (48.4%) |
Employment Industries by Sex in Dexter
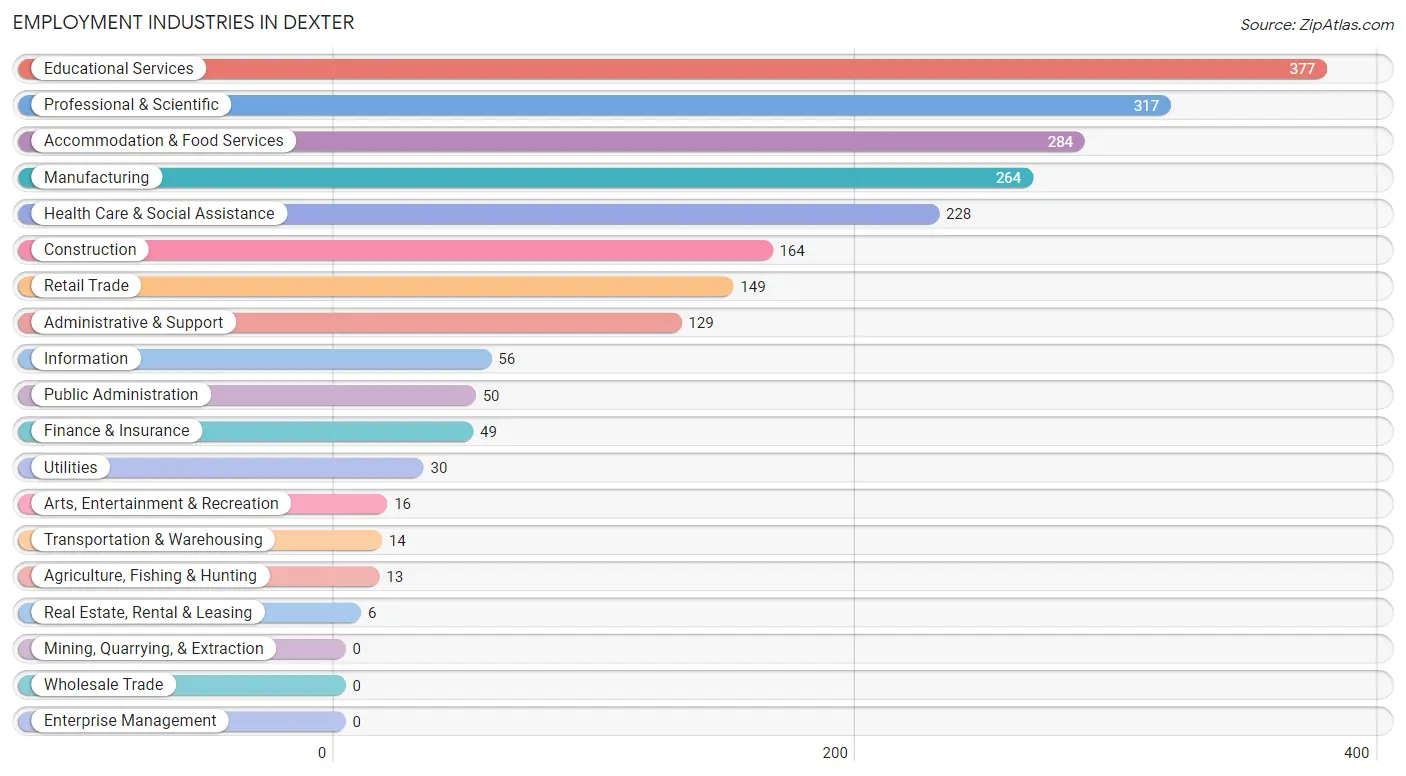
Employment Industries in Dexter
The major employment industries in Dexter include Educational Services (377 | 16.7%), Professional & Scientific (317 | 14.0%), Accommodation & Food Services (284 | 12.5%), Manufacturing (264 | 11.7%), and Health Care & Social Assistance (228 | 10.1%).
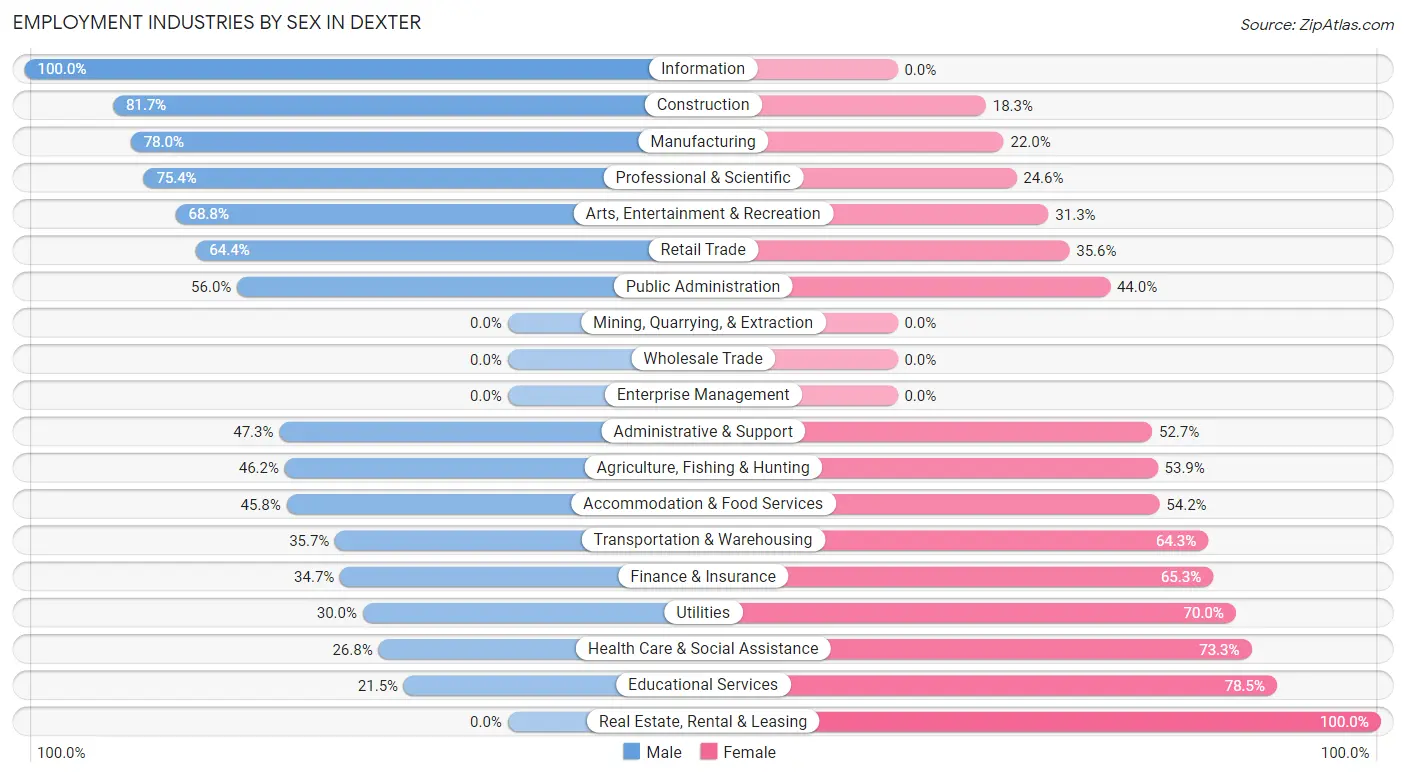
Employment Industries by Sex in Dexter
The Dexter industries that see more men than women are Information (100.0%), Construction (81.7%), and Manufacturing (78.0%), whereas the industries that tend to have a higher number of women are Real Estate, Rental & Leasing (100.0%), Educational Services (78.5%), and Health Care & Social Assistance (73.3%).
| Industry | Male | Female |
| Agriculture, Fishing & Hunting | 6 (46.2%) | 7 (53.8%) |
| Mining, Quarrying, & Extraction | 0 (0.0%) | 0 (0.0%) |
| Construction | 134 (81.7%) | 30 (18.3%) |
| Manufacturing | 206 (78.0%) | 58 (22.0%) |
| Wholesale Trade | 0 (0.0%) | 0 (0.0%) |
| Retail Trade | 96 (64.4%) | 53 (35.6%) |
| Transportation & Warehousing | 5 (35.7%) | 9 (64.3%) |
| Utilities | 9 (30.0%) | 21 (70.0%) |
| Information | 56 (100.0%) | 0 (0.0%) |
| Finance & Insurance | 17 (34.7%) | 32 (65.3%) |
| Real Estate, Rental & Leasing | 0 (0.0%) | 6 (100.0%) |
| Professional & Scientific | 239 (75.4%) | 78 (24.6%) |
| Enterprise Management | 0 (0.0%) | 0 (0.0%) |
| Administrative & Support | 61 (47.3%) | 68 (52.7%) |
| Educational Services | 81 (21.5%) | 296 (78.5%) |
| Health Care & Social Assistance | 61 (26.8%) | 167 (73.3%) |
| Arts, Entertainment & Recreation | 11 (68.8%) | 5 (31.2%) |
| Accommodation & Food Services | 130 (45.8%) | 154 (54.2%) |
| Public Administration | 28 (56.0%) | 22 (44.0%) |
| Total | 1,167 (51.5%) | 1,097 (48.4%) |
Education in Dexter
School Enrollment in Dexter
The most common levels of schooling among the 1,457 students in Dexter are elementary school (437 | 30.0%), high school (364 | 25.0%), and middle school (215 | 14.8%).
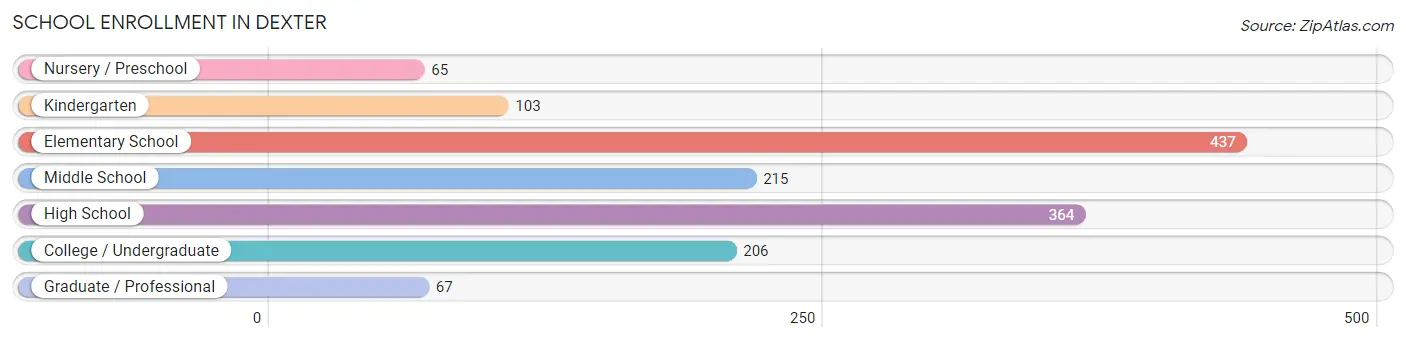
| School Level | # Students | % Students |
| Nursery / Preschool | 65 | 4.5% |
| Kindergarten | 103 | 7.1% |
| Elementary School | 437 | 30.0% |
| Middle School | 215 | 14.8% |
| High School | 364 | 25.0% |
| College / Undergraduate | 206 | 14.1% |
| Graduate / Professional | 67 | 4.6% |
| Total | 1,457 | 100.0% |
School Enrollment by Age by Funding Source in Dexter
Out of a total of 1,457 students who are enrolled in schools in Dexter, 35 (2.4%) attend a private institution, while the remaining 1,422 (97.6%) are enrolled in public schools. The age group of 3 to 4 year olds has the highest likelihood of being enrolled in private schools, with 16 (21.3% in the age bracket) enrolled. Conversely, the age group of 5 to 9 year old has the lowest likelihood of being enrolled in a private school, with 414 (100.0% in the age bracket) attending a public institution.
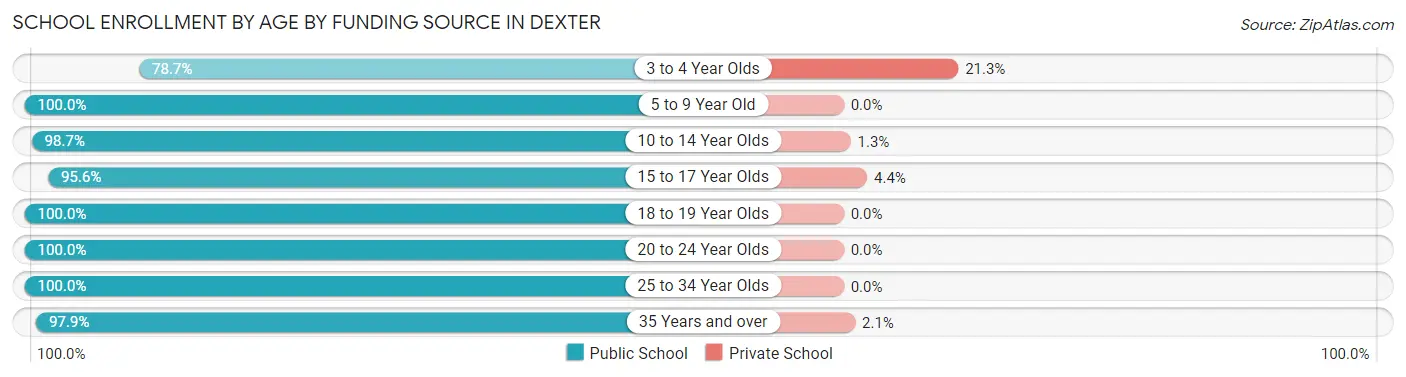
| Age Bracket | Public School | Private School |
| 3 to 4 Year Olds | 59 (78.7%) | 16 (21.3%) |
| 5 to 9 Year Old | 414 (100.0%) | 0 (0.0%) |
| 10 to 14 Year Olds | 384 (98.7%) | 5 (1.3%) |
| 15 to 17 Year Olds | 263 (95.6%) | 12 (4.4%) |
| 18 to 19 Year Olds | 133 (100.0%) | 0 (0.0%) |
| 20 to 24 Year Olds | 71 (100.0%) | 0 (0.0%) |
| 25 to 34 Year Olds | 6 (100.0%) | 0 (0.0%) |
| 35 Years and over | 92 (97.9%) | 2 (2.1%) |
| Total | 1,422 (97.6%) | 35 (2.4%) |
Educational Attainment by Field of Study in Dexter
Business (349 | 16.4%), science & technology (290 | 13.6%), education (229 | 10.7%), bio, nature & agricultural (213 | 10.0%), and psychology (179 | 8.4%) are the most common fields of study among 2,131 individuals in Dexter who have obtained a bachelor's degree or higher.
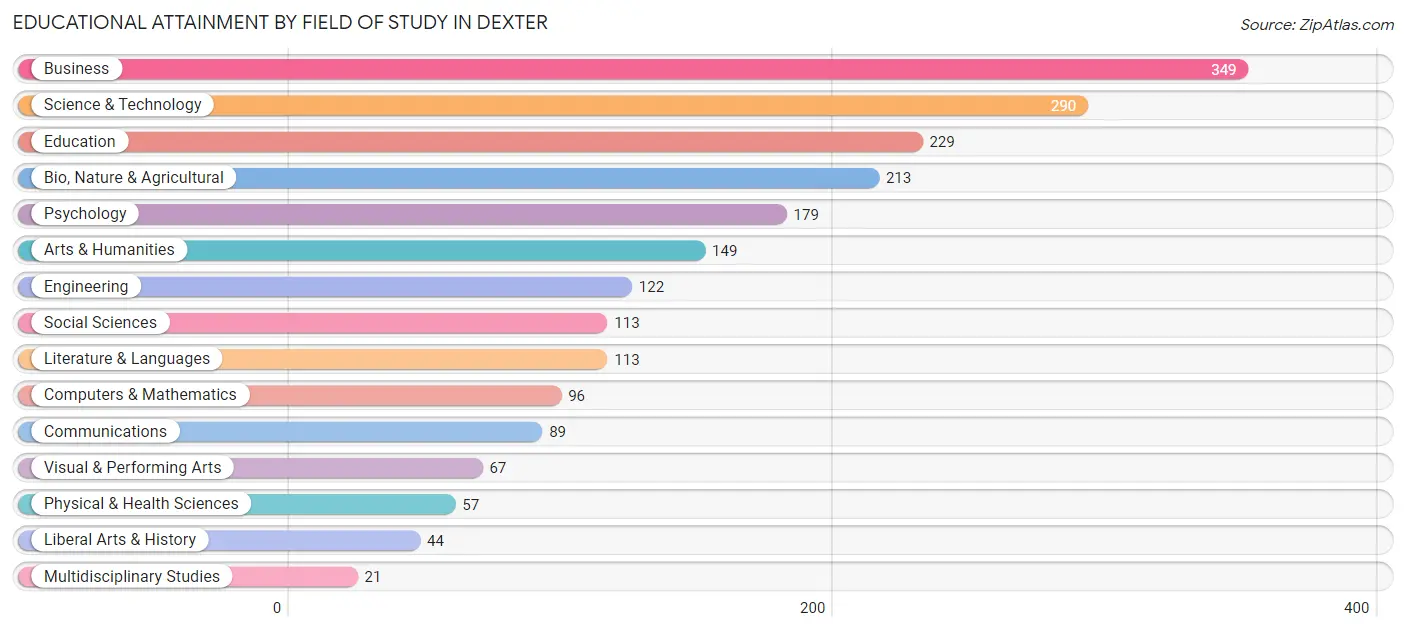
| Field of Study | # Graduates | % Graduates |
| Computers & Mathematics | 96 | 4.5% |
| Bio, Nature & Agricultural | 213 | 10.0% |
| Physical & Health Sciences | 57 | 2.7% |
| Psychology | 179 | 8.4% |
| Social Sciences | 113 | 5.3% |
| Engineering | 122 | 5.7% |
| Multidisciplinary Studies | 21 | 1.0% |
| Science & Technology | 290 | 13.6% |
| Business | 349 | 16.4% |
| Education | 229 | 10.7% |
| Literature & Languages | 113 | 5.3% |
| Liberal Arts & History | 44 | 2.1% |
| Visual & Performing Arts | 67 | 3.1% |
| Communications | 89 | 4.2% |
| Arts & Humanities | 149 | 7.0% |
| Total | 2,131 | 100.0% |
Transportation & Commute in Dexter
Vehicle Availability by Sex in Dexter
The most prevalent vehicle ownership categories in Dexter are males with 2 vehicles (430, accounting for 37.2%) and females with 2 vehicles (337, making up 41.5%).
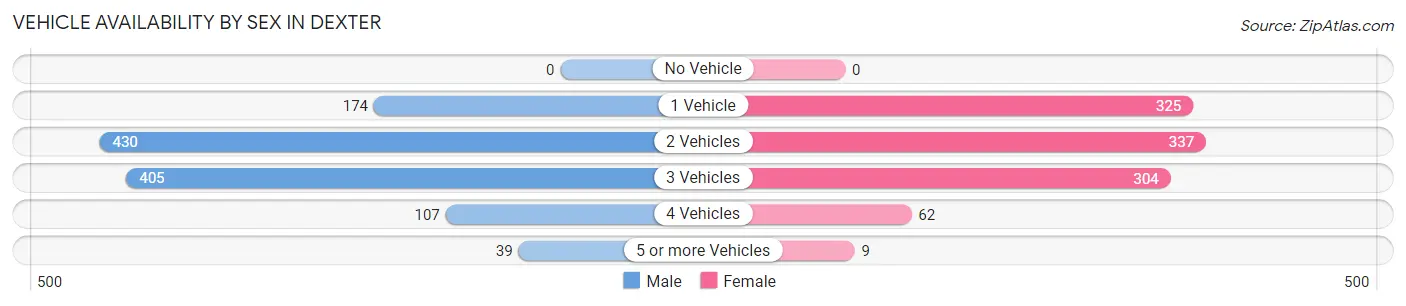
| Vehicles Available | Male | Female |
| No Vehicle | 0 (0.0%) | 0 (0.0%) |
| 1 Vehicle | 174 (15.1%) | 325 (31.3%) |
| 2 Vehicles | 430 (37.2%) | 337 (32.5%) |
| 3 Vehicles | 405 (35.1%) | 304 (29.3%) |
| 4 Vehicles | 107 (9.3%) | 62 (6.0%) |
| 5 or more Vehicles | 39 (3.4%) | 9 (0.9%) |
| Total | 1,155 (100.0%) | 1,037 (100.0%) |
Commute Time in Dexter
The most frequently occuring commute durations in Dexter are 20 to 24 minutes (319 commuters, 18.4%), 45 to 59 minutes (256 commuters, 14.7%), and 15 to 19 minutes (250 commuters, 14.4%).
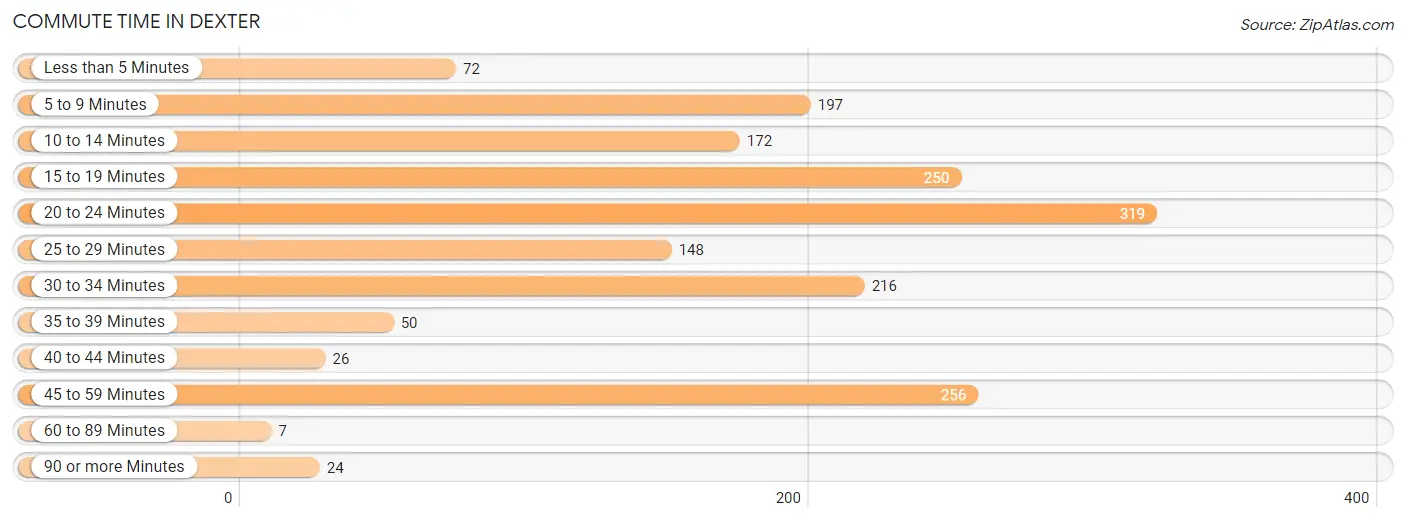
| Commute Time | # Commuters | % Commuters |
| Less than 5 Minutes | 72 | 4.2% |
| 5 to 9 Minutes | 197 | 11.3% |
| 10 to 14 Minutes | 172 | 9.9% |
| 15 to 19 Minutes | 250 | 14.4% |
| 20 to 24 Minutes | 319 | 18.4% |
| 25 to 29 Minutes | 148 | 8.5% |
| 30 to 34 Minutes | 216 | 12.4% |
| 35 to 39 Minutes | 50 | 2.9% |
| 40 to 44 Minutes | 26 | 1.5% |
| 45 to 59 Minutes | 256 | 14.7% |
| 60 to 89 Minutes | 7 | 0.4% |
| 90 or more Minutes | 24 | 1.4% |
Commute Time by Sex in Dexter
The most common commute times in Dexter are 20 to 24 minutes (191 commuters, 22.0%) for males and 15 to 19 minutes (138 commuters, 15.9%) for females.
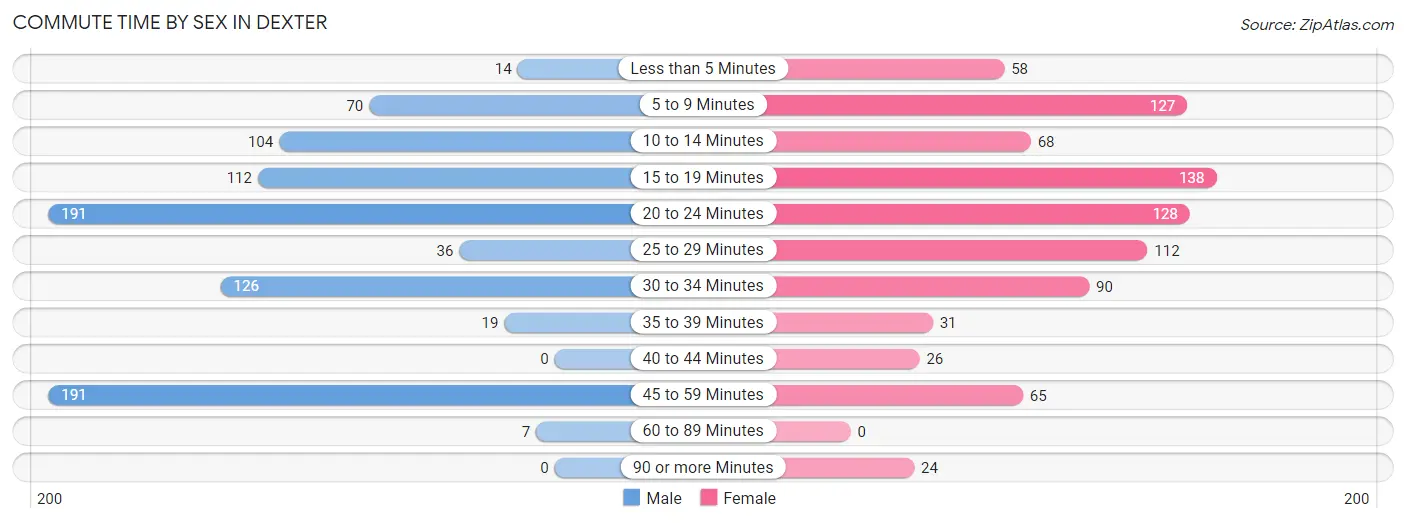
| Commute Time | Male | Female |
| Less than 5 Minutes | 14 (1.6%) | 58 (6.7%) |
| 5 to 9 Minutes | 70 (8.1%) | 127 (14.6%) |
| 10 to 14 Minutes | 104 (11.9%) | 68 (7.8%) |
| 15 to 19 Minutes | 112 (12.9%) | 138 (15.9%) |
| 20 to 24 Minutes | 191 (22.0%) | 128 (14.8%) |
| 25 to 29 Minutes | 36 (4.1%) | 112 (12.9%) |
| 30 to 34 Minutes | 126 (14.5%) | 90 (10.4%) |
| 35 to 39 Minutes | 19 (2.2%) | 31 (3.6%) |
| 40 to 44 Minutes | 0 (0.0%) | 26 (3.0%) |
| 45 to 59 Minutes | 191 (22.0%) | 65 (7.5%) |
| 60 to 89 Minutes | 7 (0.8%) | 0 (0.0%) |
| 90 or more Minutes | 0 (0.0%) | 24 (2.8%) |
Time of Departure to Work by Sex in Dexter
The most frequent times of departure to work in Dexter are 4:00 PM to 11:59 PM (185, 21.3%) for males and 7:00 AM to 7:29 AM (200, 23.1%) for females.
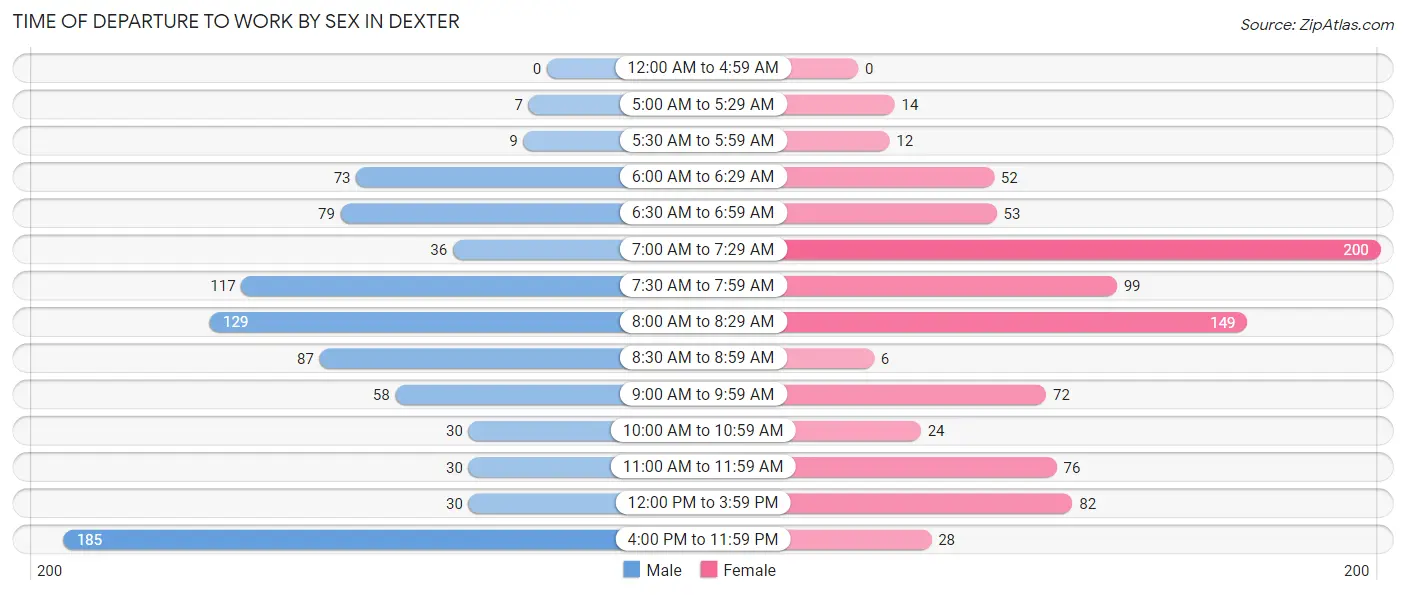
| Time of Departure | Male | Female |
| 12:00 AM to 4:59 AM | 0 (0.0%) | 0 (0.0%) |
| 5:00 AM to 5:29 AM | 7 (0.8%) | 14 (1.6%) |
| 5:30 AM to 5:59 AM | 9 (1.0%) | 12 (1.4%) |
| 6:00 AM to 6:29 AM | 73 (8.4%) | 52 (6.0%) |
| 6:30 AM to 6:59 AM | 79 (9.1%) | 53 (6.1%) |
| 7:00 AM to 7:29 AM | 36 (4.1%) | 200 (23.1%) |
| 7:30 AM to 7:59 AM | 117 (13.5%) | 99 (11.4%) |
| 8:00 AM to 8:29 AM | 129 (14.8%) | 149 (17.2%) |
| 8:30 AM to 8:59 AM | 87 (10.0%) | 6 (0.7%) |
| 9:00 AM to 9:59 AM | 58 (6.7%) | 72 (8.3%) |
| 10:00 AM to 10:59 AM | 30 (3.5%) | 24 (2.8%) |
| 11:00 AM to 11:59 AM | 30 (3.5%) | 76 (8.8%) |
| 12:00 PM to 3:59 PM | 30 (3.5%) | 82 (9.5%) |
| 4:00 PM to 11:59 PM | 185 (21.3%) | 28 (3.2%) |
| Total | 870 (100.0%) | 867 (100.0%) |
Housing Occupancy in Dexter
Occupancy by Ownership in Dexter
Of the total 1,758 dwellings in Dexter, owner-occupied units account for 1,269 (72.2%), while renter-occupied units make up 489 (27.8%).
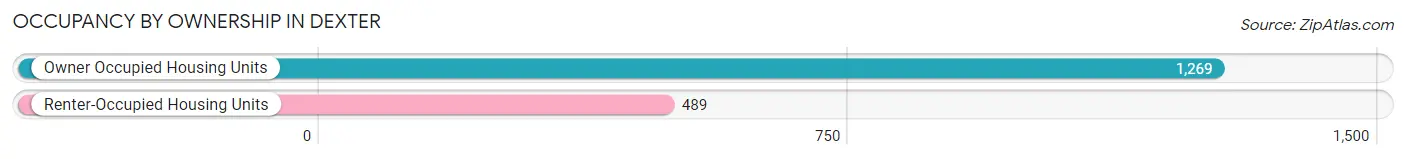
| Occupancy | # Housing Units | % Housing Units |
| Owner Occupied Housing Units | 1,269 | 72.2% |
| Renter-Occupied Housing Units | 489 | 27.8% |
| Total Occupied Housing Units | 1,758 | 100.0% |
Occupancy by Household Size in Dexter
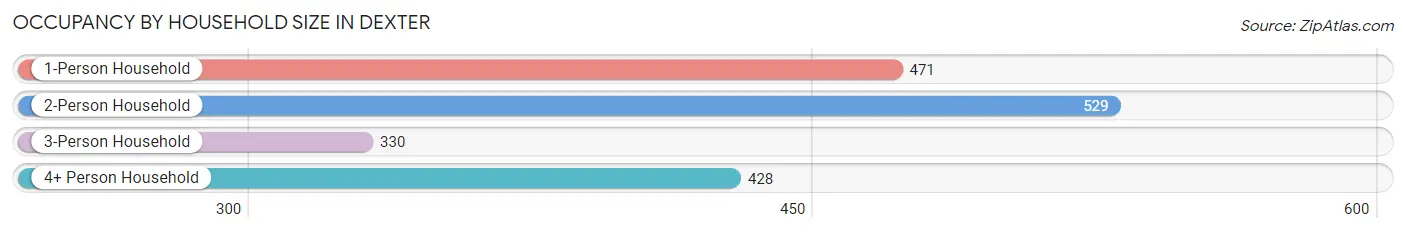
| Household Size | # Housing Units | % Housing Units |
| 1-Person Household | 471 | 26.8% |
| 2-Person Household | 529 | 30.1% |
| 3-Person Household | 330 | 18.8% |
| 4+ Person Household | 428 | 24.3% |
| Total Housing Units | 1,758 | 100.0% |
Occupancy by Ownership by Household Size in Dexter
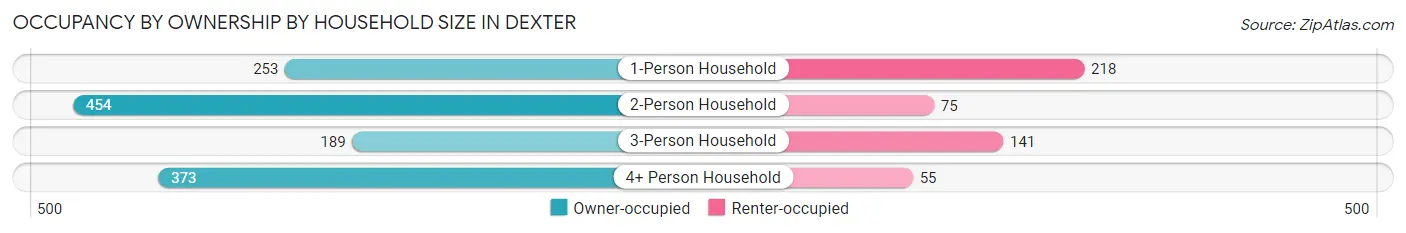
| Household Size | Owner-occupied | Renter-occupied |
| 1-Person Household | 253 (53.7%) | 218 (46.3%) |
| 2-Person Household | 454 (85.8%) | 75 (14.2%) |
| 3-Person Household | 189 (57.3%) | 141 (42.7%) |
| 4+ Person Household | 373 (87.2%) | 55 (12.9%) |
| Total Housing Units | 1,269 (72.2%) | 489 (27.8%) |
Occupancy by Educational Attainment in Dexter
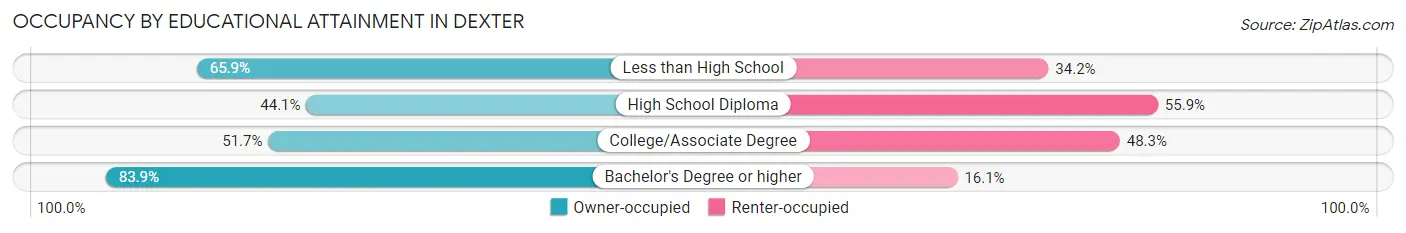
| Household Size | Owner-occupied | Renter-occupied |
| Less than High School | 54 (65.8%) | 28 (34.2%) |
| High School Diploma | 64 (44.1%) | 81 (55.9%) |
| College/Associate Degree | 214 (51.7%) | 200 (48.3%) |
| Bachelor's Degree or higher | 937 (83.9%) | 180 (16.1%) |
Occupancy by Age of Householder in Dexter
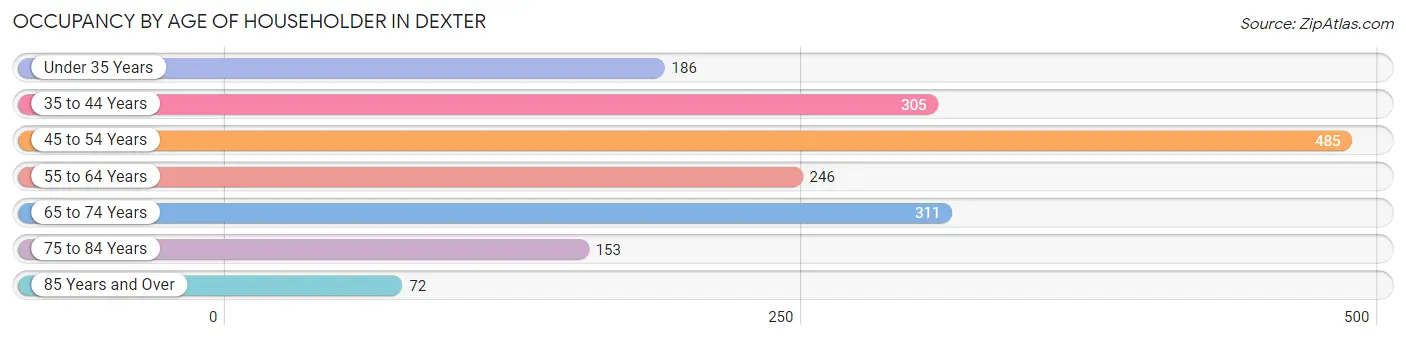
| Age Bracket | # Households | % Households |
| Under 35 Years | 186 | 10.6% |
| 35 to 44 Years | 305 | 17.3% |
| 45 to 54 Years | 485 | 27.6% |
| 55 to 64 Years | 246 | 14.0% |
| 65 to 74 Years | 311 | 17.7% |
| 75 to 84 Years | 153 | 8.7% |
| 85 Years and Over | 72 | 4.1% |
| Total | 1,758 | 100.0% |
Housing Finances in Dexter
Median Income by Occupancy in Dexter
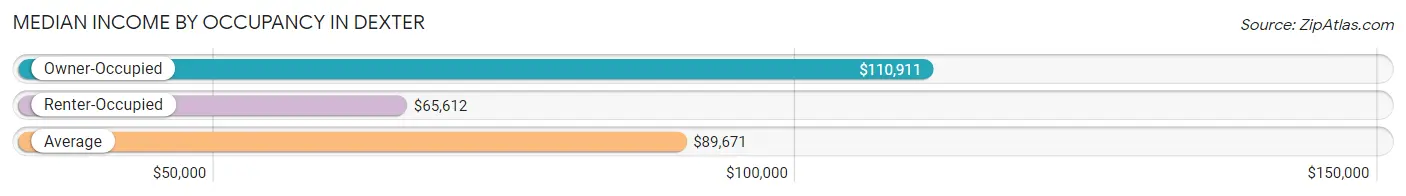
| Occupancy Type | # Households | Median Income |
| Owner-Occupied | 1,269 (72.2%) | $110,911 |
| Renter-Occupied | 489 (27.8%) | $65,612 |
| Average | 1,758 (100.0%) | $89,671 |
Occupancy by Householder Income Bracket in Dexter
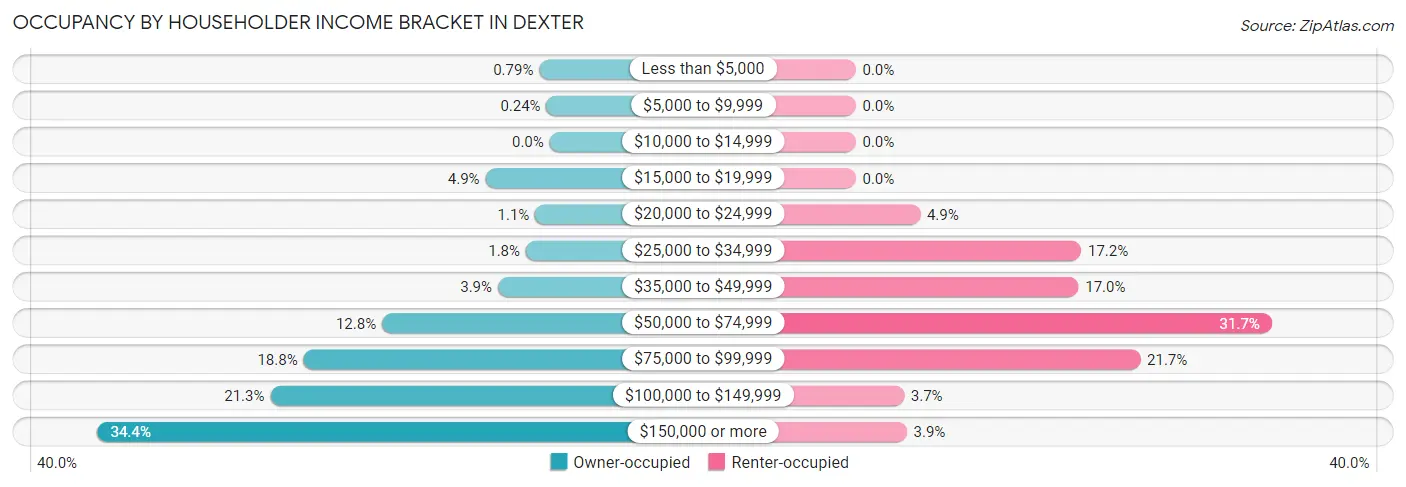
| Income Bracket | Owner-occupied | Renter-occupied |
| Less than $5,000 | 10 (0.8%) | 0 (0.0%) |
| $5,000 to $9,999 | 3 (0.2%) | 0 (0.0%) |
| $10,000 to $14,999 | 0 (0.0%) | 0 (0.0%) |
| $15,000 to $19,999 | 62 (4.9%) | 0 (0.0%) |
| $20,000 to $24,999 | 14 (1.1%) | 24 (4.9%) |
| $25,000 to $34,999 | 23 (1.8%) | 84 (17.2%) |
| $35,000 to $49,999 | 50 (3.9%) | 83 (17.0%) |
| $50,000 to $74,999 | 162 (12.8%) | 155 (31.7%) |
| $75,000 to $99,999 | 238 (18.8%) | 106 (21.7%) |
| $100,000 to $149,999 | 270 (21.3%) | 18 (3.7%) |
| $150,000 or more | 437 (34.4%) | 19 (3.9%) |
| Total | 1,269 (100.0%) | 489 (100.0%) |
Monthly Housing Cost Tiers in Dexter
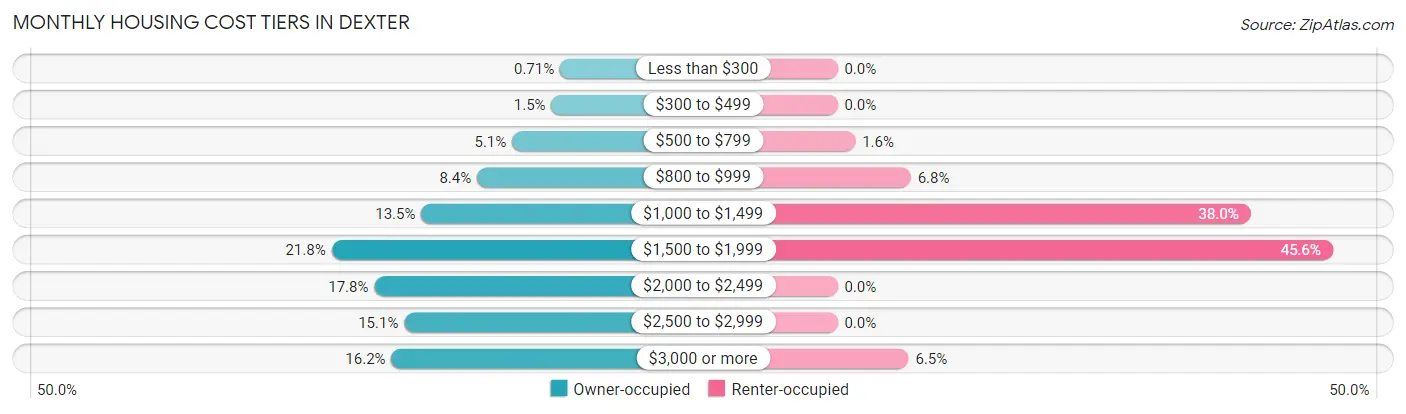
| Monthly Cost | Owner-occupied | Renter-occupied |
| Less than $300 | 9 (0.7%) | 0 (0.0%) |
| $300 to $499 | 19 (1.5%) | 0 (0.0%) |
| $500 to $799 | 65 (5.1%) | 8 (1.6%) |
| $800 to $999 | 106 (8.4%) | 33 (6.8%) |
| $1,000 to $1,499 | 171 (13.5%) | 186 (38.0%) |
| $1,500 to $1,999 | 276 (21.7%) | 223 (45.6%) |
| $2,000 to $2,499 | 226 (17.8%) | 0 (0.0%) |
| $2,500 to $2,999 | 191 (15.0%) | 0 (0.0%) |
| $3,000 or more | 206 (16.2%) | 32 (6.5%) |
| Total | 1,269 (100.0%) | 489 (100.0%) |
Physical Housing Characteristics in Dexter
Housing Structures in Dexter
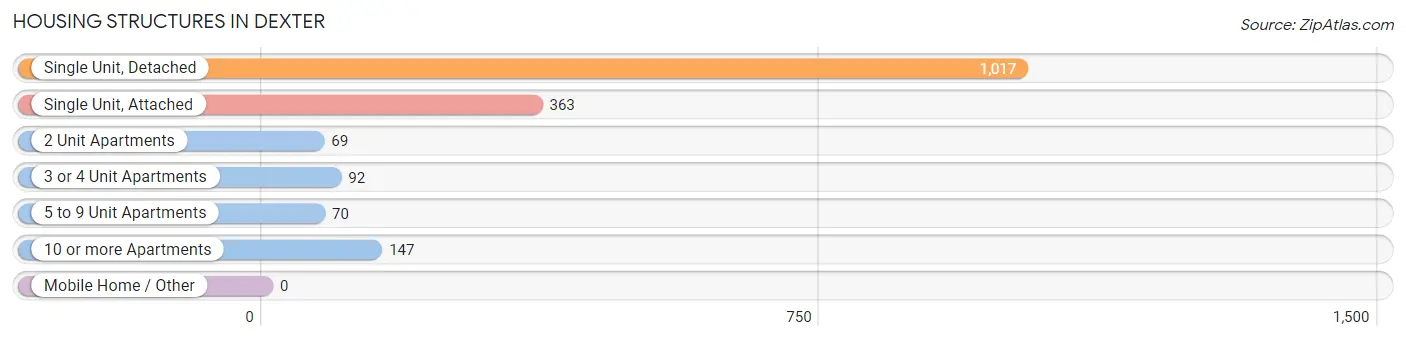
| Structure Type | # Housing Units | % Housing Units |
| Single Unit, Detached | 1,017 | 57.9% |
| Single Unit, Attached | 363 | 20.6% |
| 2 Unit Apartments | 69 | 3.9% |
| 3 or 4 Unit Apartments | 92 | 5.2% |
| 5 to 9 Unit Apartments | 70 | 4.0% |
| 10 or more Apartments | 147 | 8.4% |
| Mobile Home / Other | 0 | 0.0% |
| Total | 1,758 | 100.0% |
Housing Structures by Occupancy in Dexter
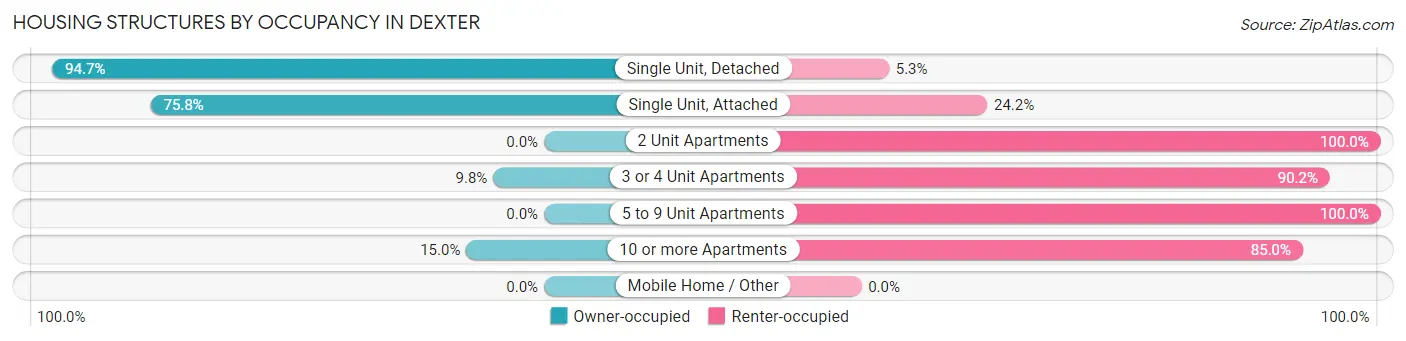
| Structure Type | Owner-occupied | Renter-occupied |
| Single Unit, Detached | 963 (94.7%) | 54 (5.3%) |
| Single Unit, Attached | 275 (75.8%) | 88 (24.2%) |
| 2 Unit Apartments | 0 (0.0%) | 69 (100.0%) |
| 3 or 4 Unit Apartments | 9 (9.8%) | 83 (90.2%) |
| 5 to 9 Unit Apartments | 0 (0.0%) | 70 (100.0%) |
| 10 or more Apartments | 22 (15.0%) | 125 (85.0%) |
| Mobile Home / Other | 0 (0.0%) | 0 (0.0%) |
| Total | 1,269 (72.2%) | 489 (27.8%) |
Housing Structures by Number of Rooms in Dexter
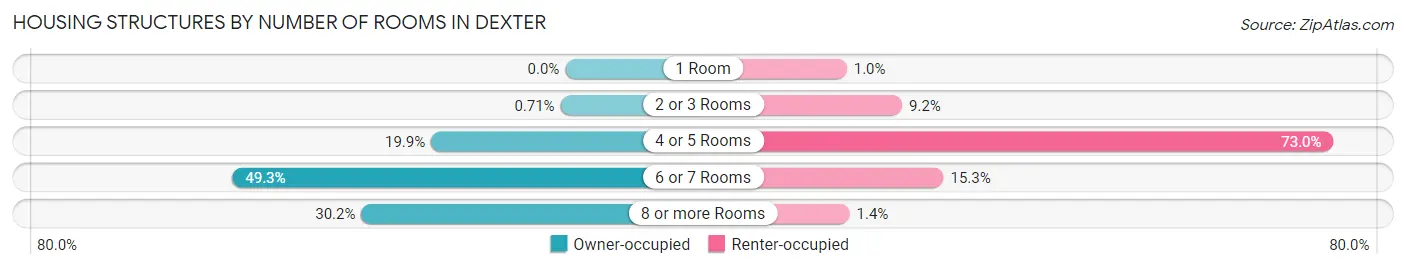
| Number of Rooms | Owner-occupied | Renter-occupied |
| 1 Room | 0 (0.0%) | 5 (1.0%) |
| 2 or 3 Rooms | 9 (0.7%) | 45 (9.2%) |
| 4 or 5 Rooms | 252 (19.9%) | 357 (73.0%) |
| 6 or 7 Rooms | 625 (49.2%) | 75 (15.3%) |
| 8 or more Rooms | 383 (30.2%) | 7 (1.4%) |
| Total | 1,269 (100.0%) | 489 (100.0%) |
Housing Structure by Heating Type in Dexter
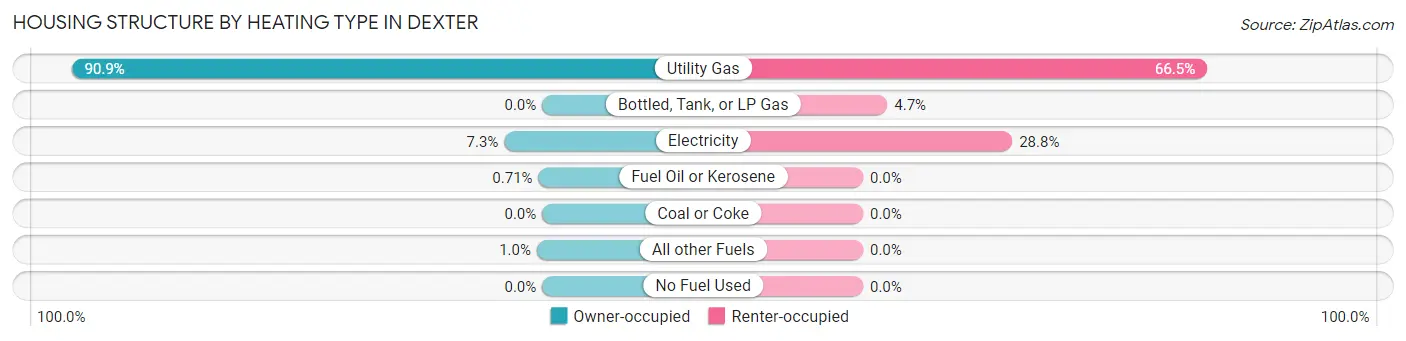
| Heating Type | Owner-occupied | Renter-occupied |
| Utility Gas | 1,154 (90.9%) | 325 (66.5%) |
| Bottled, Tank, or LP Gas | 0 (0.0%) | 23 (4.7%) |
| Electricity | 93 (7.3%) | 141 (28.8%) |
| Fuel Oil or Kerosene | 9 (0.7%) | 0 (0.0%) |
| Coal or Coke | 0 (0.0%) | 0 (0.0%) |
| All other Fuels | 13 (1.0%) | 0 (0.0%) |
| No Fuel Used | 0 (0.0%) | 0 (0.0%) |
| Total | 1,269 (100.0%) | 489 (100.0%) |
Household Vehicle Usage in Dexter
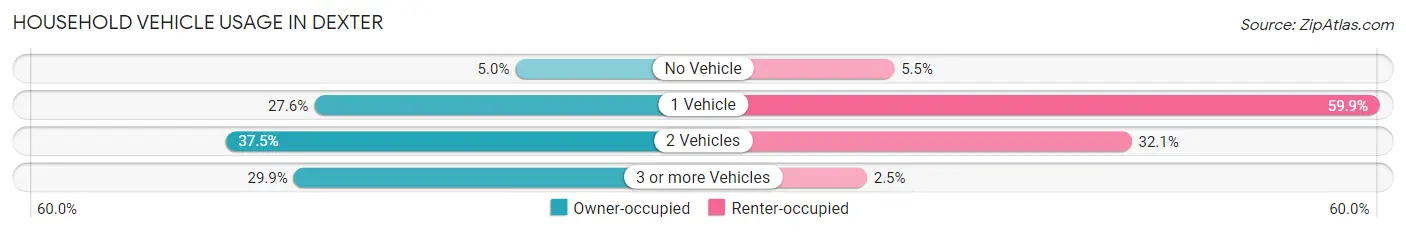
| Vehicles per Household | Owner-occupied | Renter-occupied |
| No Vehicle | 64 (5.0%) | 27 (5.5%) |
| 1 Vehicle | 350 (27.6%) | 293 (59.9%) |
| 2 Vehicles | 476 (37.5%) | 157 (32.1%) |
| 3 or more Vehicles | 379 (29.9%) | 12 (2.5%) |
| Total | 1,269 (100.0%) | 489 (100.0%) |
Real Estate & Mortgages in Dexter
Real Estate and Mortgage Overview in Dexter
| Characteristic | Without Mortgage | With Mortgage |
| Housing Units | 344 | 925 |
| Median Property Value | $368,000 | $399,800 |
| Median Household Income | $107,500 | $326 |
| Monthly Housing Costs | $932 | $206 |
| Real Estate Taxes | $6,076 | $10 |
Property Value by Mortgage Status in Dexter
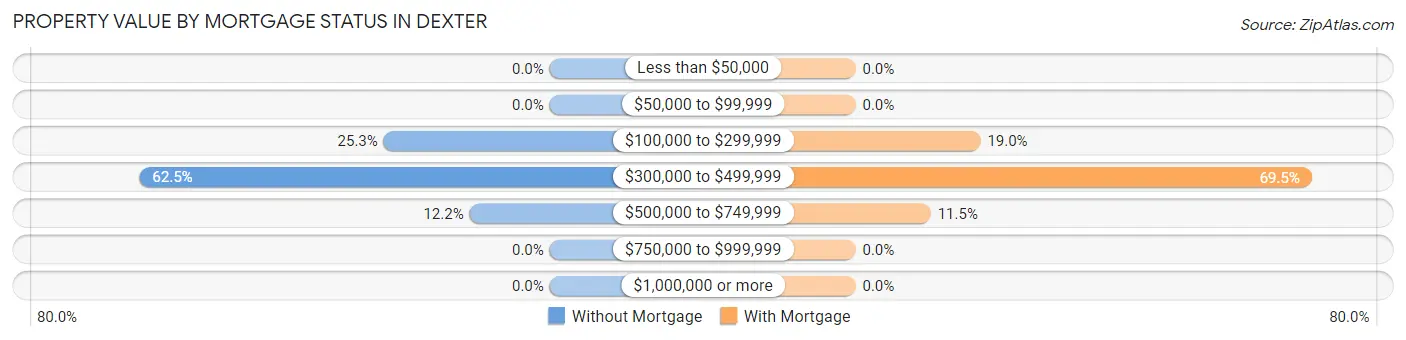
| Property Value | Without Mortgage | With Mortgage |
| Less than $50,000 | 0 (0.0%) | 0 (0.0%) |
| $50,000 to $99,999 | 0 (0.0%) | 0 (0.0%) |
| $100,000 to $299,999 | 87 (25.3%) | 176 (19.0%) |
| $300,000 to $499,999 | 215 (62.5%) | 643 (69.5%) |
| $500,000 to $749,999 | 42 (12.2%) | 106 (11.5%) |
| $750,000 to $999,999 | 0 (0.0%) | 0 (0.0%) |
| $1,000,000 or more | 0 (0.0%) | 0 (0.0%) |
| Total | 344 (100.0%) | 925 (100.0%) |
Household Income by Mortgage Status in Dexter
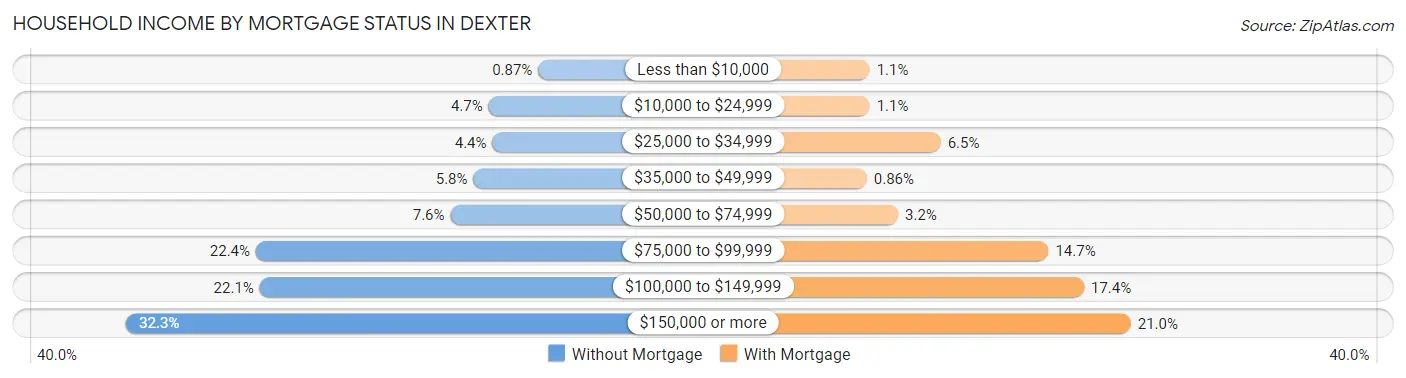
| Household Income | Without Mortgage | With Mortgage |
| Less than $10,000 | 3 (0.9%) | 10 (1.1%) |
| $10,000 to $24,999 | 16 (4.6%) | 10 (1.1%) |
| $25,000 to $34,999 | 15 (4.4%) | 60 (6.5%) |
| $35,000 to $49,999 | 20 (5.8%) | 8 (0.9%) |
| $50,000 to $74,999 | 26 (7.6%) | 30 (3.2%) |
| $75,000 to $99,999 | 77 (22.4%) | 136 (14.7%) |
| $100,000 to $149,999 | 76 (22.1%) | 161 (17.4%) |
| $150,000 or more | 111 (32.3%) | 194 (21.0%) |
| Total | 344 (100.0%) | 925 (100.0%) |
Property Value to Household Income Ratio in Dexter
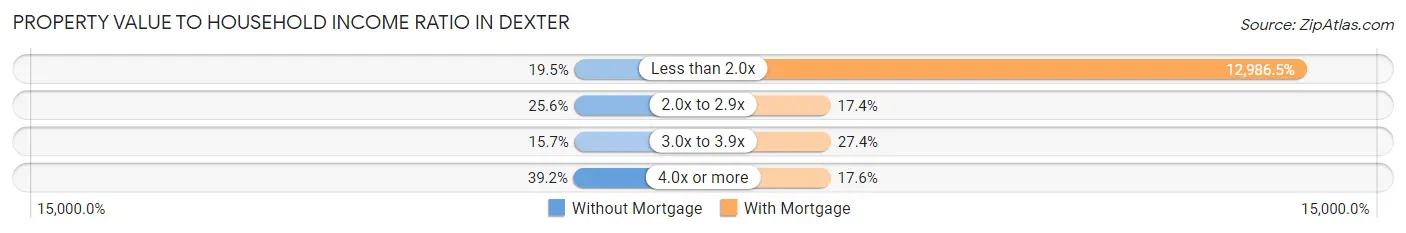
| Value-to-Income Ratio | Without Mortgage | With Mortgage |
| Less than 2.0x | 67 (19.5%) | 120,125 (12,986.5%) |
| 2.0x to 2.9x | 88 (25.6%) | 161 (17.4%) |
| 3.0x to 3.9x | 54 (15.7%) | 253 (27.4%) |
| 4.0x or more | 135 (39.2%) | 163 (17.6%) |
| Total | 344 (100.0%) | 925 (100.0%) |
Real Estate Taxes by Mortgage Status in Dexter
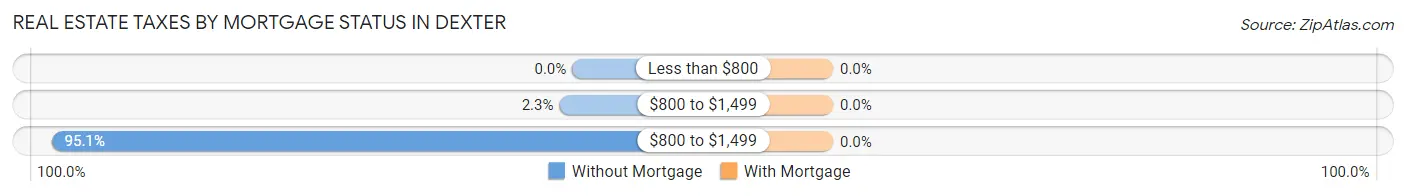
| Property Taxes | Without Mortgage | With Mortgage |
| Less than $800 | 0 (0.0%) | 0 (0.0%) |
| $800 to $1,499 | 8 (2.3%) | 0 (0.0%) |
| $800 to $1,499 | 327 (95.1%) | 0 (0.0%) |
| Total | 344 (100.0%) | 925 (100.0%) |
Health & Disability in Dexter
Health Insurance Coverage by Age in Dexter
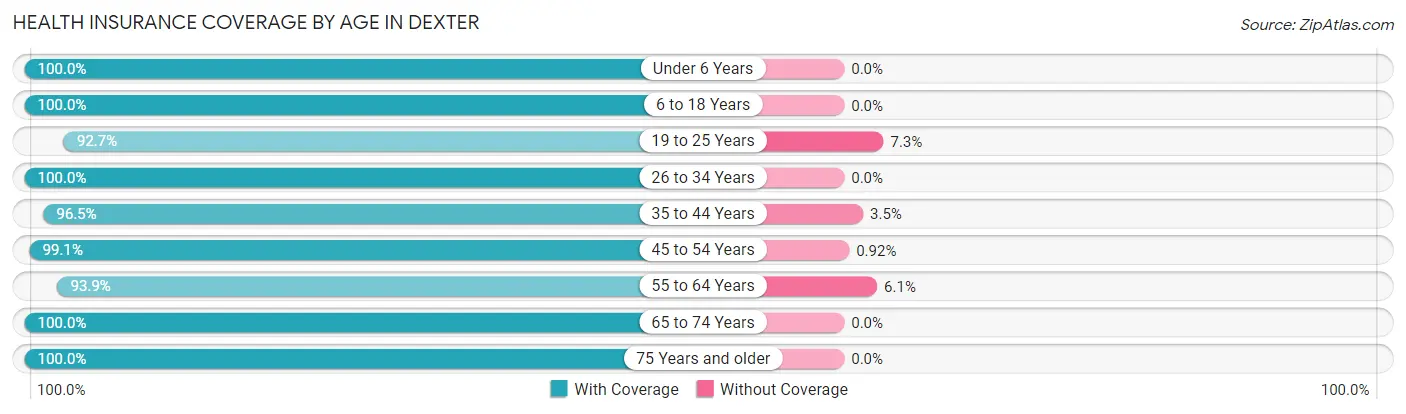
| Age Bracket | With Coverage | Without Coverage |
| Under 6 Years | 344 (100.0%) | 0 (0.0%) |
| 6 to 18 Years | 1,055 (100.0%) | 0 (0.0%) |
| 19 to 25 Years | 380 (92.7%) | 30 (7.3%) |
| 26 to 34 Years | 186 (100.0%) | 0 (0.0%) |
| 35 to 44 Years | 522 (96.5%) | 19 (3.5%) |
| 45 to 54 Years | 866 (99.1%) | 8 (0.9%) |
| 55 to 64 Years | 291 (93.9%) | 19 (6.1%) |
| 65 to 74 Years | 425 (100.0%) | 0 (0.0%) |
| 75 Years and older | 360 (100.0%) | 0 (0.0%) |
| Total | 4,429 (98.3%) | 76 (1.7%) |
Health Insurance Coverage by Citizenship Status in Dexter
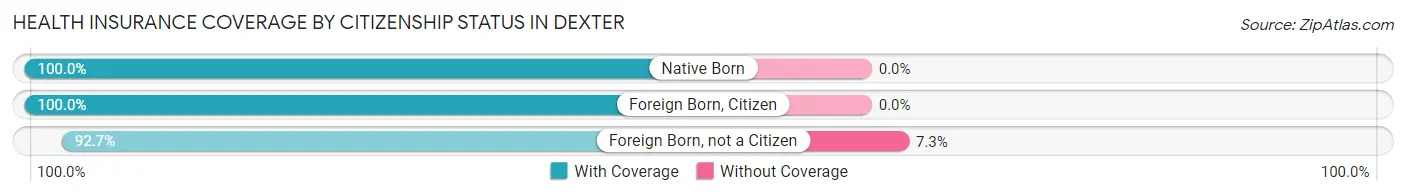
| Citizenship Status | With Coverage | Without Coverage |
| Native Born | 344 (100.0%) | 0 (0.0%) |
| Foreign Born, Citizen | 1,055 (100.0%) | 0 (0.0%) |
| Foreign Born, not a Citizen | 380 (92.7%) | 30 (7.3%) |
Health Insurance Coverage by Household Income in Dexter
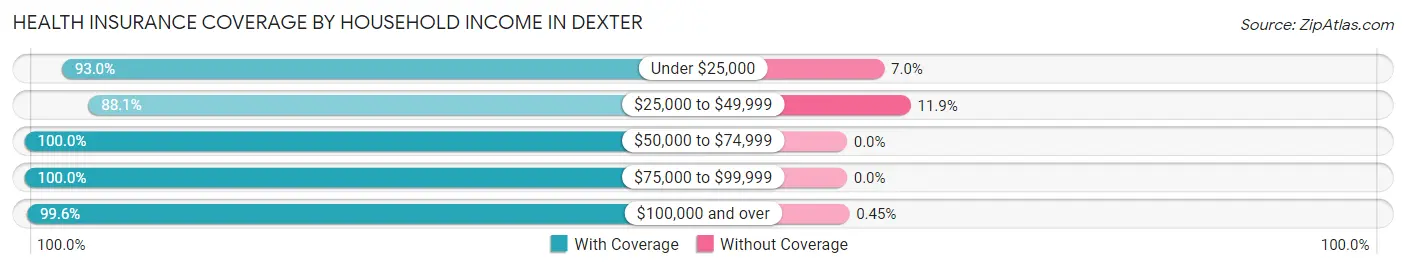
| Household Income | With Coverage | Without Coverage |
| Under $25,000 | 133 (93.0%) | 10 (7.0%) |
| $25,000 to $49,999 | 413 (88.1%) | 56 (11.9%) |
| $50,000 to $74,999 | 643 (100.0%) | 0 (0.0%) |
| $75,000 to $99,999 | 1,031 (100.0%) | 0 (0.0%) |
| $100,000 and over | 2,209 (99.6%) | 10 (0.4%) |
Public vs Private Health Insurance Coverage by Age in Dexter
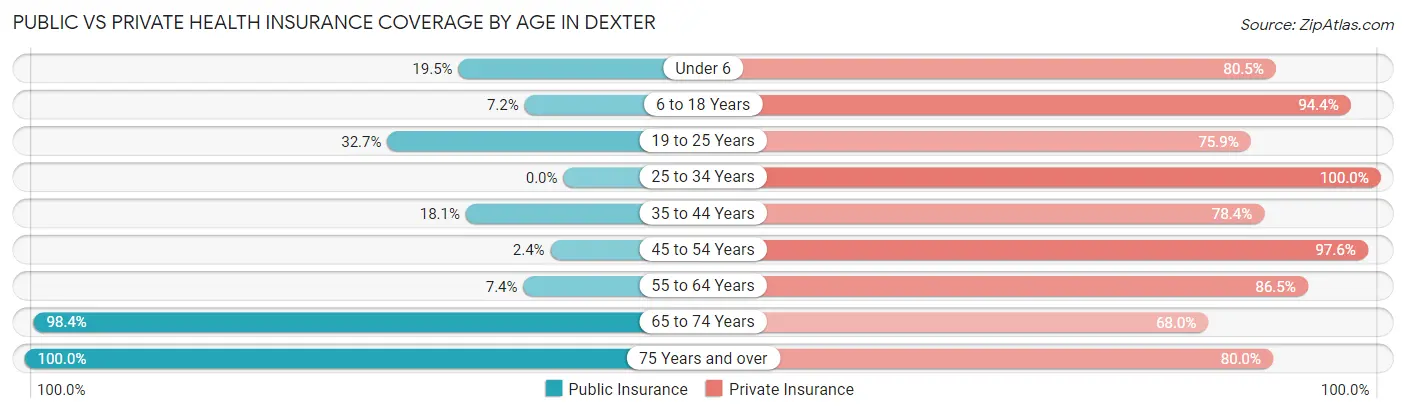
| Age Bracket | Public Insurance | Private Insurance |
| Under 6 | 67 (19.5%) | 277 (80.5%) |
| 6 to 18 Years | 76 (7.2%) | 996 (94.4%) |
| 19 to 25 Years | 134 (32.7%) | 311 (75.8%) |
| 25 to 34 Years | 0 (0.0%) | 186 (100.0%) |
| 35 to 44 Years | 98 (18.1%) | 424 (78.4%) |
| 45 to 54 Years | 21 (2.4%) | 853 (97.6%) |
| 55 to 64 Years | 23 (7.4%) | 268 (86.5%) |
| 65 to 74 Years | 418 (98.4%) | 289 (68.0%) |
| 75 Years and over | 360 (100.0%) | 288 (80.0%) |
| Total | 1,197 (26.6%) | 3,892 (86.4%) |
Disability Status by Sex by Age in Dexter
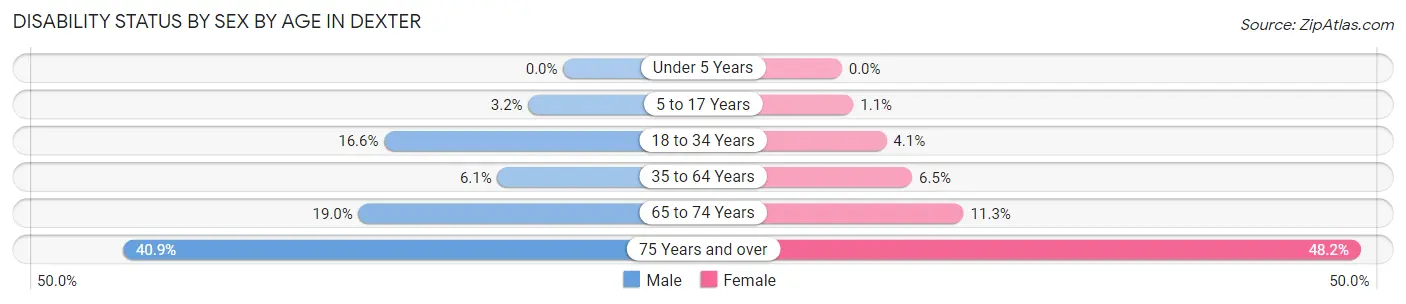
| Age Bracket | Male | Female |
| Under 5 Years | 0 (0.0%) | 0 (0.0%) |
| 5 to 17 Years | 17 (3.2%) | 6 (1.1%) |
| 18 to 34 Years | 59 (16.6%) | 12 (4.1%) |
| 35 to 64 Years | 53 (6.1%) | 56 (6.5%) |
| 65 to 74 Years | 27 (19.0%) | 32 (11.3%) |
| 75 Years and over | 47 (40.9%) | 118 (48.2%) |
Disability Class by Sex by Age in Dexter
Disability Class: Hearing Difficulty
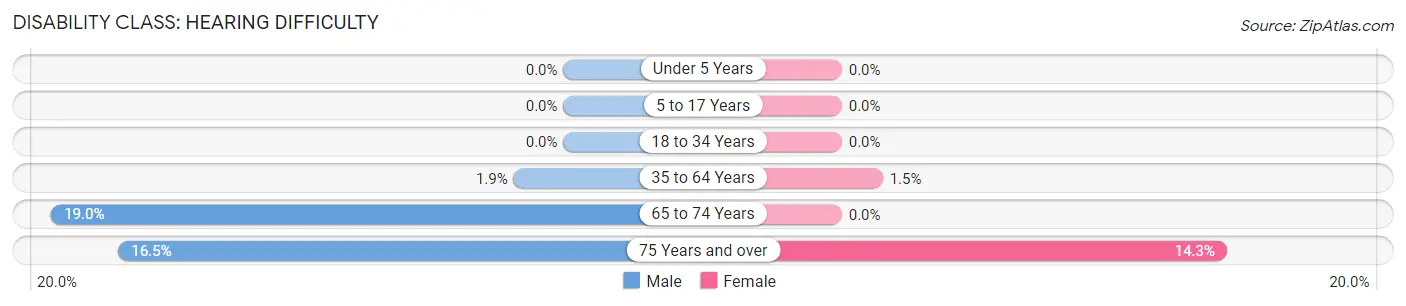
| Age Bracket | Male | Female |
| Under 5 Years | 0 (0.0%) | 0 (0.0%) |
| 5 to 17 Years | 0 (0.0%) | 0 (0.0%) |
| 18 to 34 Years | 0 (0.0%) | 0 (0.0%) |
| 35 to 64 Years | 16 (1.8%) | 13 (1.5%) |
| 65 to 74 Years | 27 (19.0%) | 0 (0.0%) |
| 75 Years and over | 19 (16.5%) | 35 (14.3%) |
Disability Class: Vision Difficulty
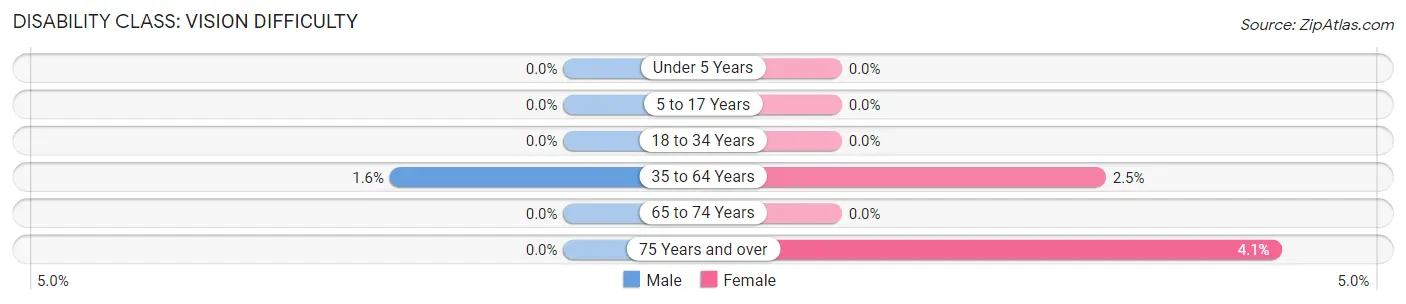
| Age Bracket | Male | Female |
| Under 5 Years | 0 (0.0%) | 0 (0.0%) |
| 5 to 17 Years | 0 (0.0%) | 0 (0.0%) |
| 18 to 34 Years | 0 (0.0%) | 0 (0.0%) |
| 35 to 64 Years | 14 (1.6%) | 21 (2.5%) |
| 65 to 74 Years | 0 (0.0%) | 0 (0.0%) |
| 75 Years and over | 0 (0.0%) | 10 (4.1%) |
Disability Class: Cognitive Difficulty
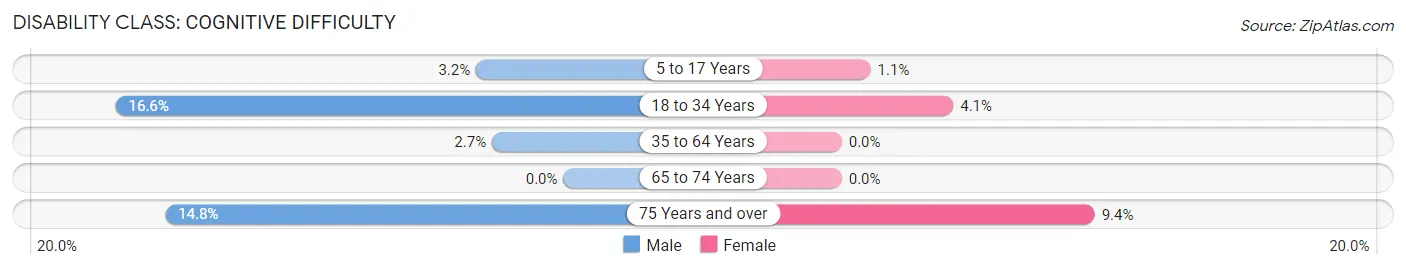
| Age Bracket | Male | Female |
| 5 to 17 Years | 17 (3.2%) | 6 (1.1%) |
| 18 to 34 Years | 59 (16.6%) | 12 (4.1%) |
| 35 to 64 Years | 23 (2.6%) | 0 (0.0%) |
| 65 to 74 Years | 0 (0.0%) | 0 (0.0%) |
| 75 Years and over | 17 (14.8%) | 23 (9.4%) |
Disability Class: Ambulatory Difficulty
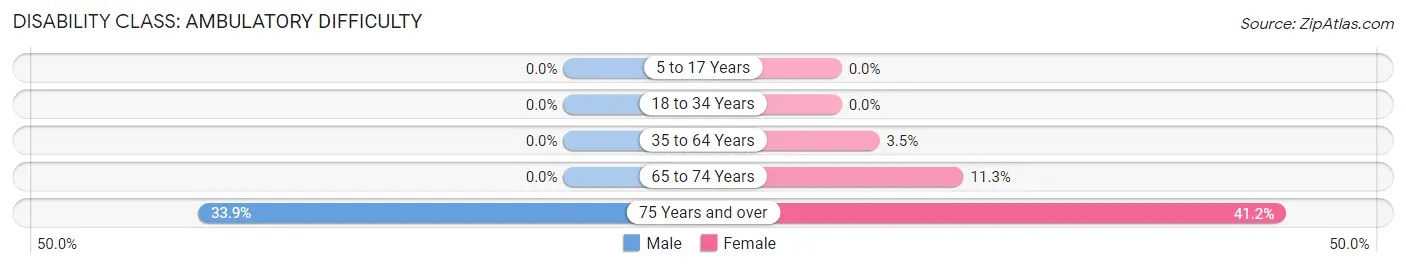
| Age Bracket | Male | Female |
| 5 to 17 Years | 0 (0.0%) | 0 (0.0%) |
| 18 to 34 Years | 0 (0.0%) | 0 (0.0%) |
| 35 to 64 Years | 0 (0.0%) | 30 (3.5%) |
| 65 to 74 Years | 0 (0.0%) | 32 (11.3%) |
| 75 Years and over | 39 (33.9%) | 101 (41.2%) |
Disability Class: Self-Care Difficulty
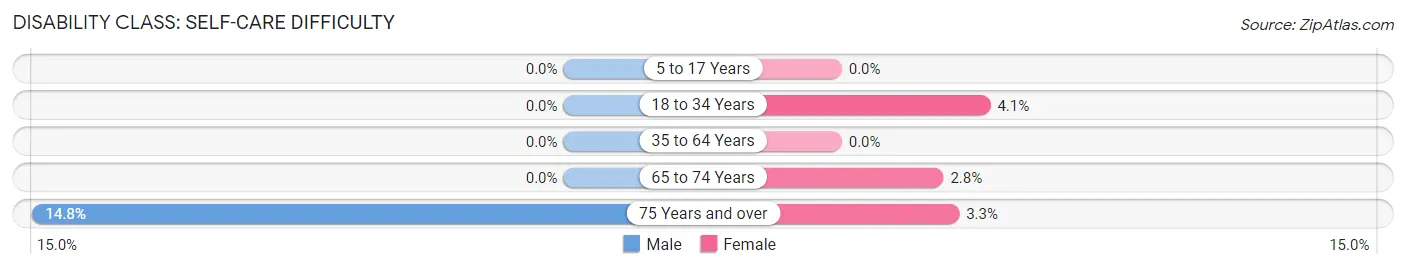
| Age Bracket | Male | Female |
| 5 to 17 Years | 0 (0.0%) | 0 (0.0%) |
| 18 to 34 Years | 0 (0.0%) | 12 (4.1%) |
| 35 to 64 Years | 0 (0.0%) | 0 (0.0%) |
| 65 to 74 Years | 0 (0.0%) | 8 (2.8%) |
| 75 Years and over | 17 (14.8%) | 8 (3.3%) |
Technology Access in Dexter
Computing Device Access in Dexter
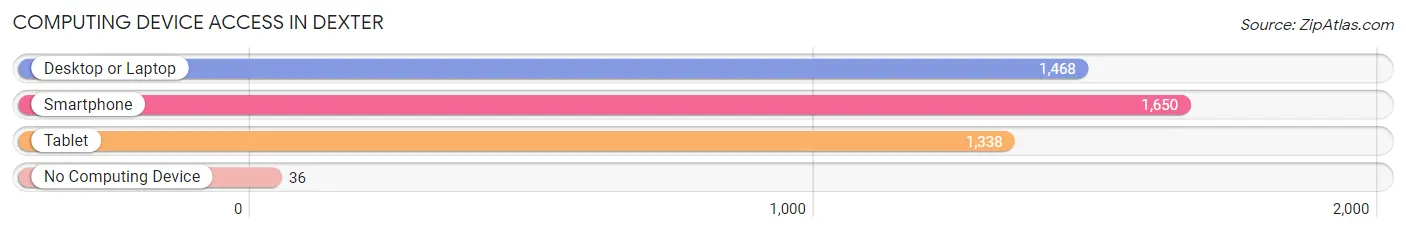
| Device Type | # Households | % Households |
| Desktop or Laptop | 1,468 | 83.5% |
| Smartphone | 1,650 | 93.9% |
| Tablet | 1,338 | 76.1% |
| No Computing Device | 36 | 2.1% |
| Total | 1,758 | 100.0% |
Internet Access in Dexter
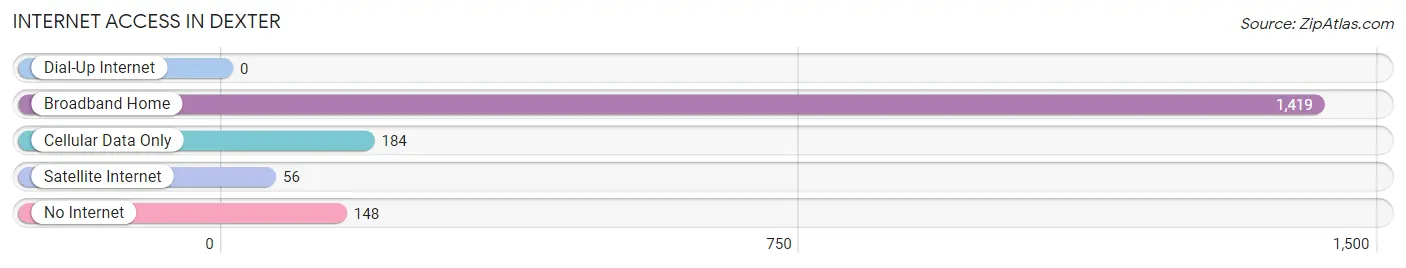
| Internet Type | # Households | % Households |
| Dial-Up Internet | 0 | 0.0% |
| Broadband Home | 1,419 | 80.7% |
| Cellular Data Only | 184 | 10.5% |
| Satellite Internet | 56 | 3.2% |
| No Internet | 148 | 8.4% |
| Total | 1,758 | 100.0% |
Dexter Summary
Dexter, Michigan is a small town located in Washtenaw County, Michigan. It is situated on the Huron River, about 8 miles northwest of Ann Arbor. The population of Dexter was 4,067 at the 2010 census.
History
The area that is now Dexter was first settled in 1824 by John and Mary Dexter. The town was originally known as Mill Creek Settlement, but was later renamed Dexter in 1832 after the founders. The town was officially incorporated in 1837.
In the early days, Dexter was a farming community, with many of the residents working in the nearby mills. The town was also home to a number of small businesses, including a blacksmith shop, a general store, and a sawmill.
In the late 19th century, Dexter began to grow and develop. The Dexter State Bank was established in 1891, and the Dexter Telephone Company was founded in 1895. The Dexter Public Library was established in 1901, and the Dexter High School was built in 1906.
In the early 20th century, Dexter continued to grow and develop. The Dexter Community Hospital was established in 1921, and the Dexter Community Center was built in 1924. The Dexter Post Office was established in 1925, and the Dexter Fire Department was founded in 1927.
Geography
Dexter is located in southeastern Michigan, about 8 miles northwest of Ann Arbor. The town is situated on the Huron River, and is surrounded by rolling hills and farmland. The town is located in the Huron River watershed, and is part of the Huron River Valley.
The climate in Dexter is humid continental, with hot summers and cold winters. The average temperature in July is 75°F, and the average temperature in January is 22°F. The average annual precipitation is 33 inches.
Economy
The economy of Dexter is largely based on agriculture and manufacturing. The town is home to a number of small businesses, including a grocery store, a hardware store, and a restaurant. The town is also home to a number of small manufacturing companies, including a plastics manufacturer and a metal fabrication company.
The town is also home to a number of educational institutions, including the Dexter Community Schools, the Dexter Public Library, and the Dexter Community Center.
Demographics
As of the 2010 census, the population of Dexter was 4,067. The racial makeup of the town was 94.3% White, 1.7% African American, 0.3% Native American, 1.2% Asian, 0.1% Pacific Islander, 0.7% from other races, and 1.9% from two or more races. Hispanic or Latino of any race were 2.3% of the population.
The median income for a household in Dexter was $60,938, and the median income for a family was $71,917. The per capita income for the town was $27,945. About 4.3% of families and 5.7% of the population were below the poverty line, including 6.3% of those under age 18 and 4.2% of those age 65 or over.
Common Questions
What is Per Capita Income in Dexter?
Per Capita income in Dexter is $50,131.
What is the Median Family Income in Dexter?
Median Family Income in Dexter is $111,419.
What is the Median Household income in Dexter?
Median Household Income in Dexter is $89,671.
What is Income or Wage Gap in Dexter?
Income or Wage Gap in Dexter is 11.2%.
Women in Dexter earn 88.8 cents for every dollar earned by a man.
What is Inequality or Gini Index in Dexter?
Inequality or Gini Index in Dexter is 0.44.
What is the Total Population of Dexter?
Total Population of Dexter is 4,505.
What is the Total Male Population of Dexter?
Total Male Population of Dexter is 2,174.
What is the Total Female Population of Dexter?
Total Female Population of Dexter is 2,331.
What is the Ratio of Males per 100 Females in Dexter?
There are 93.26 Males per 100 Females in Dexter.
What is the Ratio of Females per 100 Males in Dexter?
There are 107.22 Females per 100 Males in Dexter.
What is the Median Population Age in Dexter?
Median Population Age in Dexter is 39.2 Years.
What is the Average Family Size in Dexter
Average Family Size in Dexter is 3.1 People.
What is the Average Household Size in Dexter
Average Household Size in Dexter is 2.6 People.
How Large is the Labor Force in Dexter?
There are 2,330 People in the Labor Forcein in Dexter.
What is the Percentage of People in the Labor Force in Dexter?
68.7% of People are in the Labor Force in Dexter.
What is the Unemployment Rate in Dexter?
Unemployment Rate in Dexter is 2.7%.