Argentine, MI Map & Demographics
Argentine Map
Argentine Overview
$41,228
PER CAPITA INCOME
$113,702
AVG FAMILY INCOME
$93,571
AVG HOUSEHOLD INCOME
27.0%
WAGE / INCOME GAP [ % ]
73.0¢/ $1
WAGE / INCOME GAP [ $ ]
0.39
INEQUALITY / GINI INDEX
2,451
TOTAL POPULATION
1,224
MALE POPULATION
1,227
FEMALE POPULATION
99.76
MALES / 100 FEMALES
100.25
FEMALES / 100 MALES
46.7
MEDIAN AGE
2.9
AVG FAMILY SIZE
2.5
AVG HOUSEHOLD SIZE
1,090
LABOR FORCE [ PEOPLE ]
53.0%
PERCENT IN LABOR FORCE
6.2%
UNEMPLOYMENT RATE
Income in Argentine
Income Overview in Argentine
Per Capita Income in Argentine is $41,228, while median incomes of families and households are $113,702 and $93,571 respectively.
| Characteristic | Number | Measure |
| Per Capita Income | 2,451 | $41,228 |
| Median Family Income | 683 | $113,702 |
| Mean Family Income | 683 | $115,611 |
| Median Household Income | 968 | $93,571 |
| Mean Household Income | 968 | $101,889 |
| Income Deficit | 683 | $0 |
| Wage / Income Gap (%) | 2,451 | 26.96% |
| Wage / Income Gap ($) | 2,451 | 73.04¢ per $1 |
| Gini / Inequality Index | 2,451 | 0.39 |
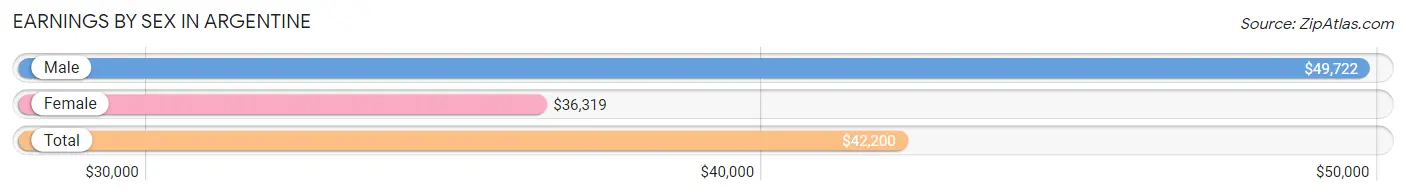
Earnings by Sex in Argentine
Average Earnings in Argentine are $42,200, $49,722 for men and $36,319 for women, a difference of 27.0%.
| Sex | Number | Average Earnings |
| Male | 656 (55.8%) | $49,722 |
| Female | 520 (44.2%) | $36,319 |
| Total | 1,176 (100.0%) | $42,200 |
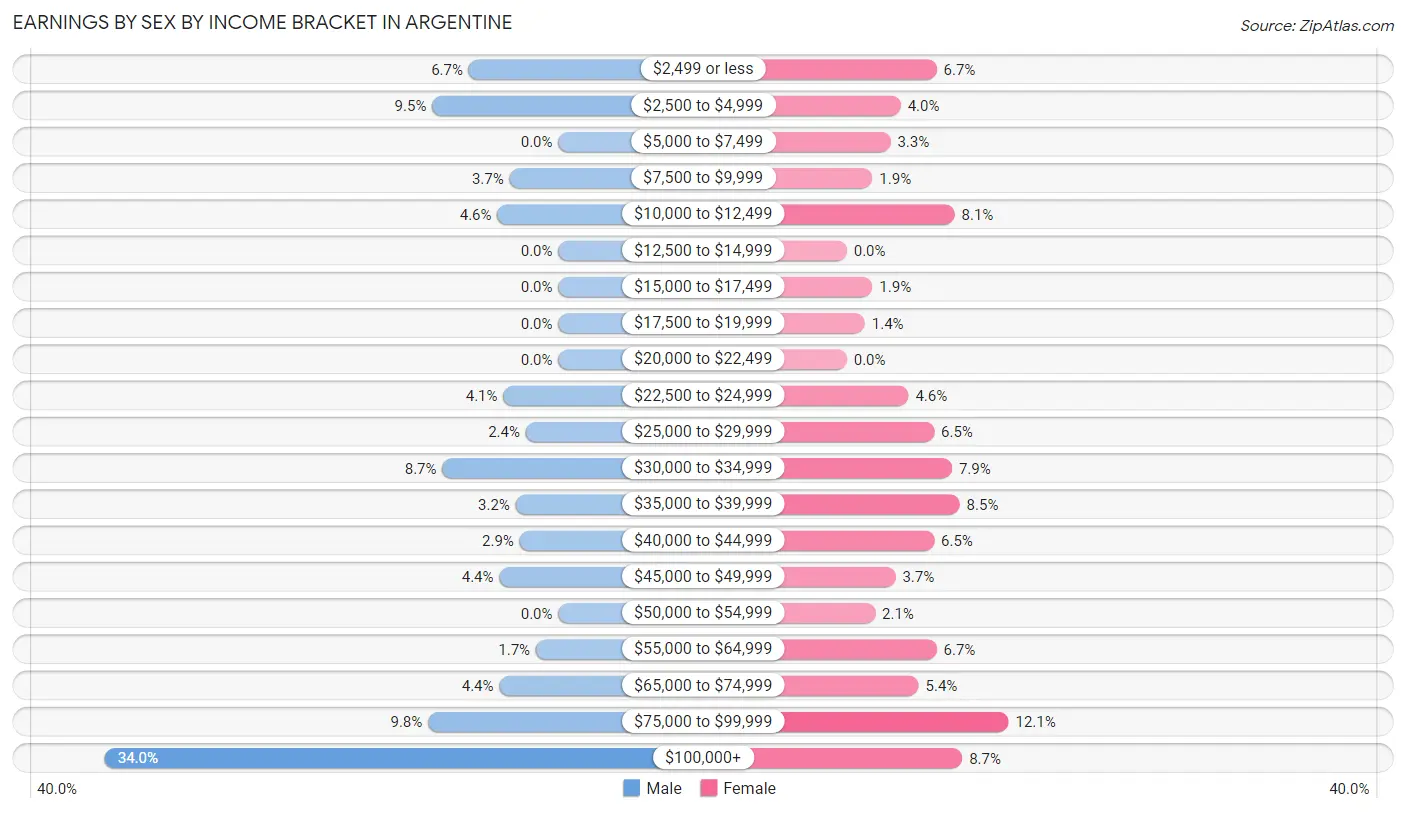
Earnings by Sex by Income Bracket in Argentine
The most common earnings brackets in Argentine are $100,000+ for men (223 | 34.0%) and $75,000 to $99,999 for women (63 | 12.1%).
| Income | Male | Female |
| $2,499 or less | 44 (6.7%) | 35 (6.7%) |
| $2,500 to $4,999 | 62 (9.5%) | 21 (4.0%) |
| $5,000 to $7,499 | 0 (0.0%) | 17 (3.3%) |
| $7,500 to $9,999 | 24 (3.7%) | 10 (1.9%) |
| $10,000 to $12,499 | 30 (4.6%) | 42 (8.1%) |
| $12,500 to $14,999 | 0 (0.0%) | 0 (0.0%) |
| $15,000 to $17,499 | 0 (0.0%) | 10 (1.9%) |
| $17,500 to $19,999 | 0 (0.0%) | 7 (1.3%) |
| $20,000 to $22,499 | 0 (0.0%) | 0 (0.0%) |
| $22,500 to $24,999 | 27 (4.1%) | 24 (4.6%) |
| $25,000 to $29,999 | 16 (2.4%) | 34 (6.5%) |
| $30,000 to $34,999 | 57 (8.7%) | 41 (7.9%) |
| $35,000 to $39,999 | 21 (3.2%) | 44 (8.5%) |
| $40,000 to $44,999 | 19 (2.9%) | 34 (6.5%) |
| $45,000 to $49,999 | 29 (4.4%) | 19 (3.6%) |
| $50,000 to $54,999 | 0 (0.0%) | 11 (2.1%) |
| $55,000 to $64,999 | 11 (1.7%) | 35 (6.7%) |
| $65,000 to $74,999 | 29 (4.4%) | 28 (5.4%) |
| $75,000 to $99,999 | 64 (9.8%) | 63 (12.1%) |
| $100,000+ | 223 (34.0%) | 45 (8.6%) |
| Total | 656 (100.0%) | 520 (100.0%) |
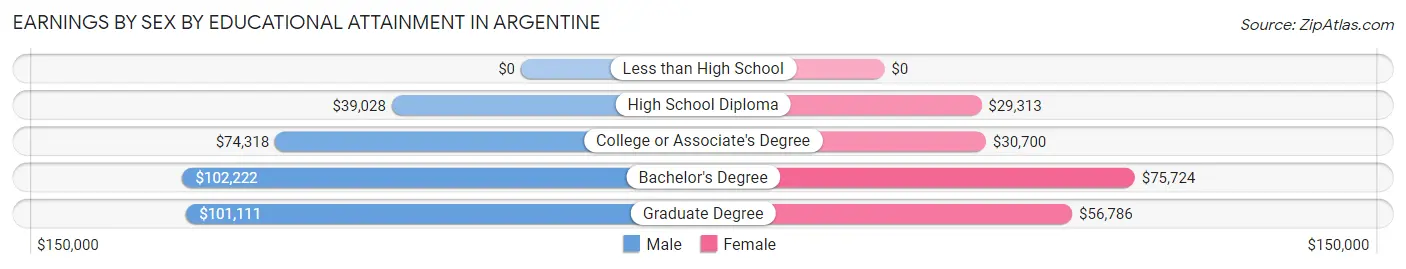
Earnings by Sex by Educational Attainment in Argentine
Average earnings in Argentine are $75,473 for men and $41,042 for women, a difference of 45.6%. Men with an educational attainment of bachelor's degree enjoy the highest average annual earnings of $102,222, while those with high school diploma education earn the least with $39,028. Women with an educational attainment of bachelor's degree earn the most with the average annual earnings of $75,724, while those with high school diploma education have the smallest earnings of $29,313.
| Educational Attainment | Male Income | Female Income |
| Less than High School | - | - |
| High School Diploma | $39,028 | $29,313 |
| College or Associate's Degree | $74,318 | $30,700 |
| Bachelor's Degree | $102,222 | $75,724 |
| Graduate Degree | $101,111 | $56,786 |
| Total | $75,473 | $41,042 |
Family Income in Argentine
Family Income Brackets in Argentine
According to the Argentine family income data, there are 154 families falling into the $100,000 to $149,999 income range, which is the most common income bracket and makes up 22.6% of all families.
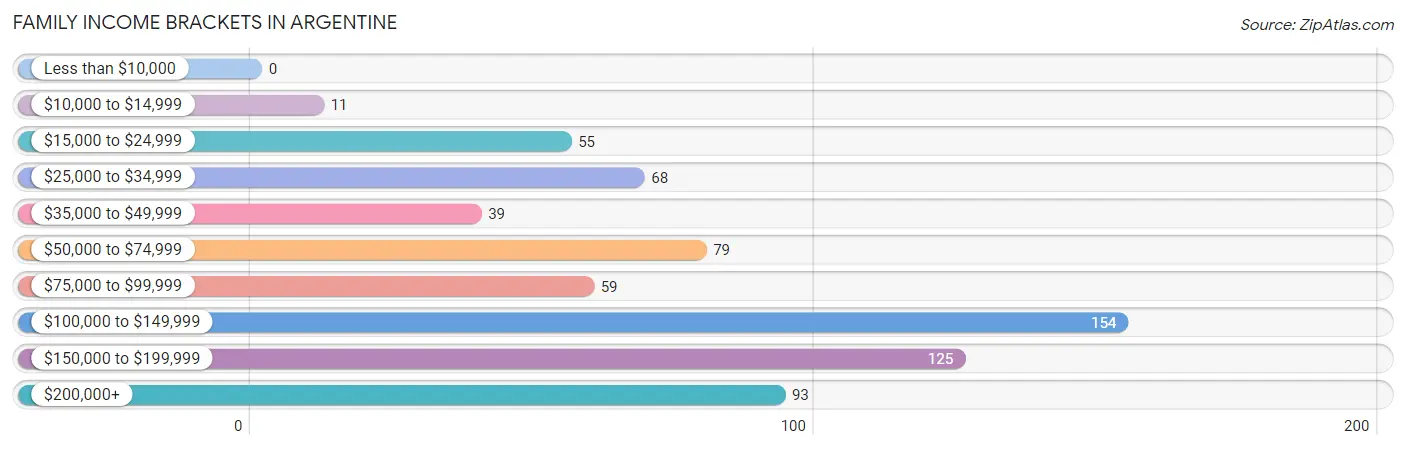
| Income Bracket | # Families | % Families |
| Less than $10,000 | 0 | 0.0% |
| $10,000 to $14,999 | 11 | 1.6% |
| $15,000 to $24,999 | 55 | 8.1% |
| $25,000 to $34,999 | 68 | 10.0% |
| $35,000 to $49,999 | 39 | 5.7% |
| $50,000 to $74,999 | 79 | 11.6% |
| $75,000 to $99,999 | 59 | 8.6% |
| $100,000 to $149,999 | 154 | 22.5% |
| $150,000 to $199,999 | 125 | 18.3% |
| $200,000+ | 93 | 13.6% |
Family Income by Famaliy Size in Argentine
5-person families (86 | 12.6%) account for the highest median family income in Argentine with $164,844 per family, while 2-person families (362 | 53.0%) have the highest median income of $47,847 per family member.
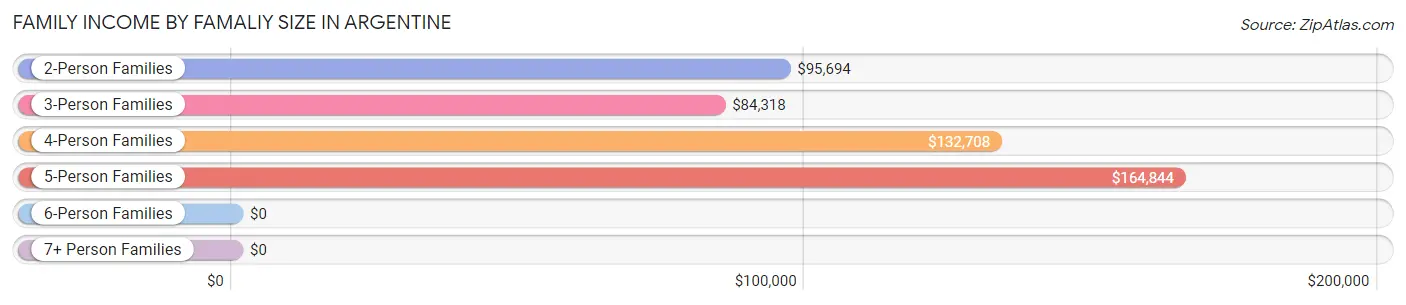
| Income Bracket | # Families | Median Income |
| 2-Person Families | 362 (53.0%) | $95,694 |
| 3-Person Families | 160 (23.4%) | $84,318 |
| 4-Person Families | 75 (11.0%) | $132,708 |
| 5-Person Families | 86 (12.6%) | $164,844 |
| 6-Person Families | 0 (0.0%) | $0 |
| 7+ Person Families | 0 (0.0%) | $0 |
| Total | 683 (100.0%) | $113,702 |
Family Income by Number of Earners in Argentine
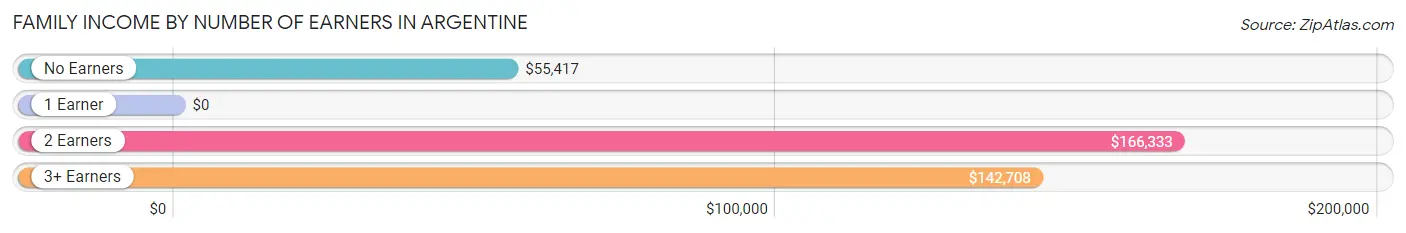
| Number of Earners | # Families | Median Income |
| No Earners | 121 (17.7%) | $55,417 |
| 1 Earner | 253 (37.0%) | $0 |
| 2 Earners | 196 (28.7%) | $166,333 |
| 3+ Earners | 113 (16.5%) | $142,708 |
| Total | 683 (100.0%) | $113,702 |
Household Income in Argentine
Household Income Brackets in Argentine
With 218 households falling in the category, the $100,000 to $149,999 income range is the most frequent in Argentine, accounting for 22.5% of all households. In contrast, only 19 households (2.0%) fall into the $10,000 to $14,999 income bracket, making it the least populous group.
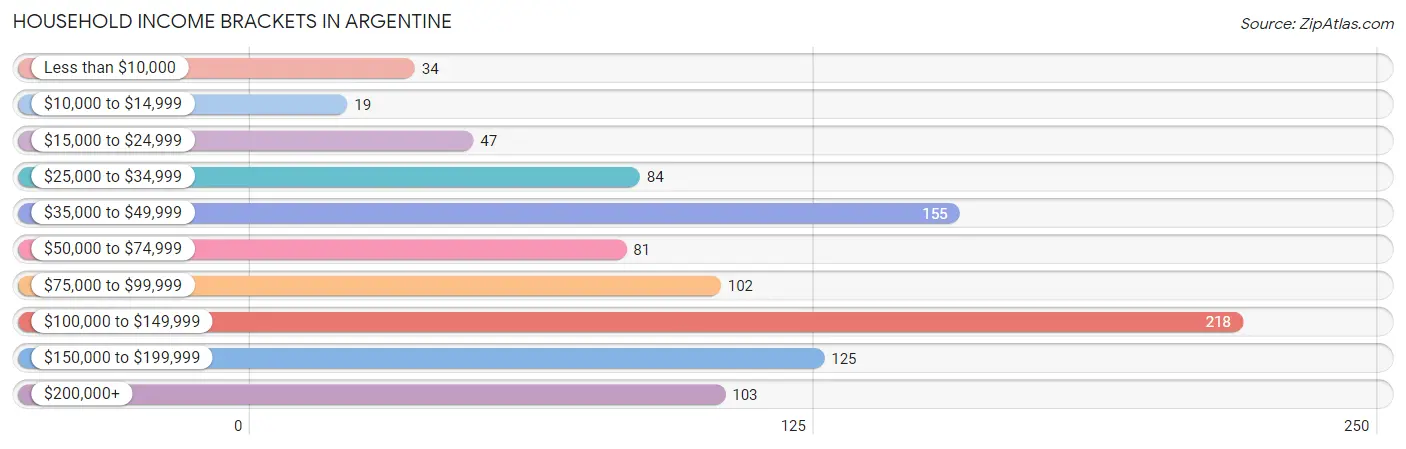
| Income Bracket | # Households | % Households |
| Less than $10,000 | 34 | 3.5% |
| $10,000 to $14,999 | 19 | 2.0% |
| $15,000 to $24,999 | 47 | 4.9% |
| $25,000 to $34,999 | 84 | 8.7% |
| $35,000 to $49,999 | 155 | 16.0% |
| $50,000 to $74,999 | 81 | 8.4% |
| $75,000 to $99,999 | 102 | 10.5% |
| $100,000 to $149,999 | 218 | 22.5% |
| $150,000 to $199,999 | 125 | 12.9% |
| $200,000+ | 103 | 10.6% |
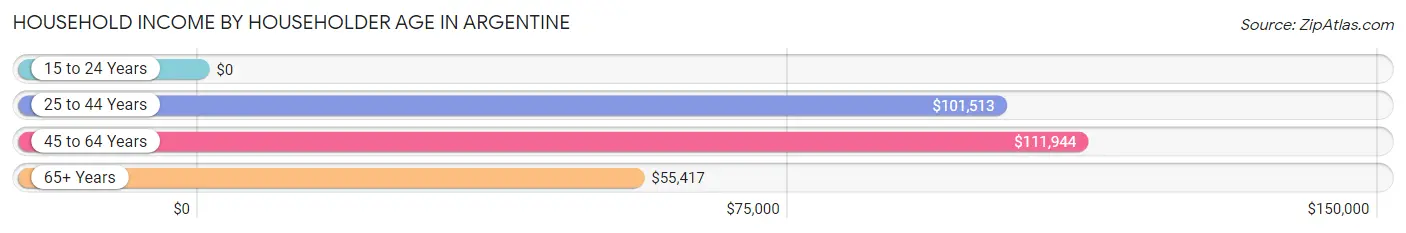
Household Income by Householder Age in Argentine
The median household income in Argentine is $93,571, with the highest median household income of $111,944 found in the 45 to 64 years age bracket for the primary householder. A total of 460 households (47.5%) fall into this category.
| Income Bracket | # Households | Median Income |
| 15 to 24 Years | 0 (0.0%) | $0 |
| 25 to 44 Years | 237 (24.5%) | $101,513 |
| 45 to 64 Years | 460 (47.5%) | $111,944 |
| 65+ Years | 271 (28.0%) | $55,417 |
| Total | 968 (100.0%) | $93,571 |
Poverty in Argentine
Income Below Poverty by Sex and Age in Argentine
With 6.2% poverty level for males and 11.9% for females among the residents of Argentine, 45 to 54 year old males and 16 and 17 year old females are the most vulnerable to poverty, with 39 males (26.4%) and 17 females (30.4%) in their respective age groups living below the poverty level.
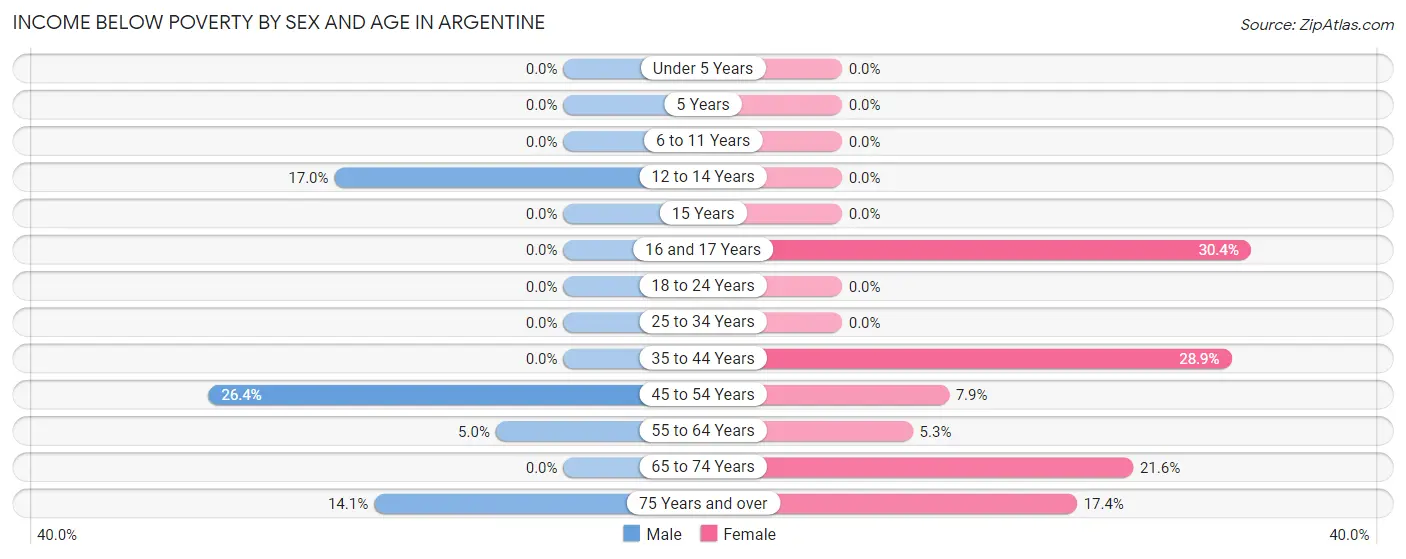
| Age Bracket | Male | Female |
| Under 5 Years | 0 (0.0%) | 0 (0.0%) |
| 5 Years | 0 (0.0%) | 0 (0.0%) |
| 6 to 11 Years | 0 (0.0%) | 0 (0.0%) |
| 12 to 14 Years | 17 (17.0%) | 0 (0.0%) |
| 15 Years | 0 (0.0%) | 0 (0.0%) |
| 16 and 17 Years | 0 (0.0%) | 17 (30.4%) |
| 18 to 24 Years | 0 (0.0%) | 0 (0.0%) |
| 25 to 34 Years | 0 (0.0%) | 0 (0.0%) |
| 35 to 44 Years | 0 (0.0%) | 48 (28.9%) |
| 45 to 54 Years | 39 (26.4%) | 17 (7.9%) |
| 55 to 64 Years | 11 (5.0%) | 10 (5.3%) |
| 65 to 74 Years | 0 (0.0%) | 32 (21.6%) |
| 75 Years and over | 9 (14.1%) | 15 (17.4%) |
| Total | 76 (6.2%) | 139 (11.9%) |
Income Above Poverty by Sex and Age in Argentine
According to the poverty statistics in Argentine, males aged under 5 years and females aged under 5 years are the age groups that are most secure financially, with 100.0% of males and 100.0% of females in these age groups living above the poverty line.
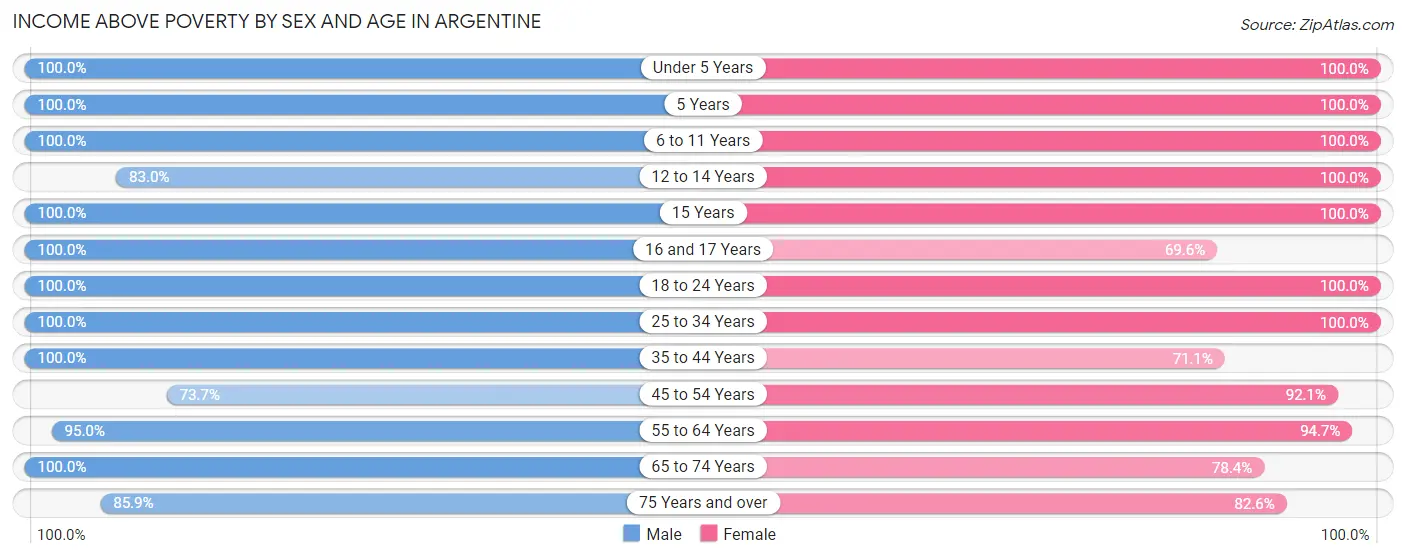
| Age Bracket | Male | Female |
| Under 5 Years | 41 (100.0%) | 32 (100.0%) |
| 5 Years | 16 (100.0%) | 13 (100.0%) |
| 6 to 11 Years | 47 (100.0%) | 53 (100.0%) |
| 12 to 14 Years | 83 (83.0%) | 62 (100.0%) |
| 15 Years | 9 (100.0%) | 10 (100.0%) |
| 16 and 17 Years | 33 (100.0%) | 39 (69.6%) |
| 18 to 24 Years | 110 (100.0%) | 50 (100.0%) |
| 25 to 34 Years | 86 (100.0%) | 91 (100.0%) |
| 35 to 44 Years | 150 (100.0%) | 118 (71.1%) |
| 45 to 54 Years | 109 (73.7%) | 197 (92.1%) |
| 55 to 64 Years | 208 (95.0%) | 180 (94.7%) |
| 65 to 74 Years | 201 (100.0%) | 116 (78.4%) |
| 75 Years and over | 55 (85.9%) | 71 (82.6%) |
| Total | 1,148 (93.8%) | 1,032 (88.1%) |
Income Below Poverty Among Married-Couple Families in Argentine
The poverty statistics for married-couple families in Argentine show that 2.1% or 11 of the total 532 families live below the poverty line. Families with no children have the highest poverty rate of 2.9%, comprising of 11 families. On the other hand, families with 1 or 2 children have the lowest poverty rate of 0.0%, which includes 0 families.
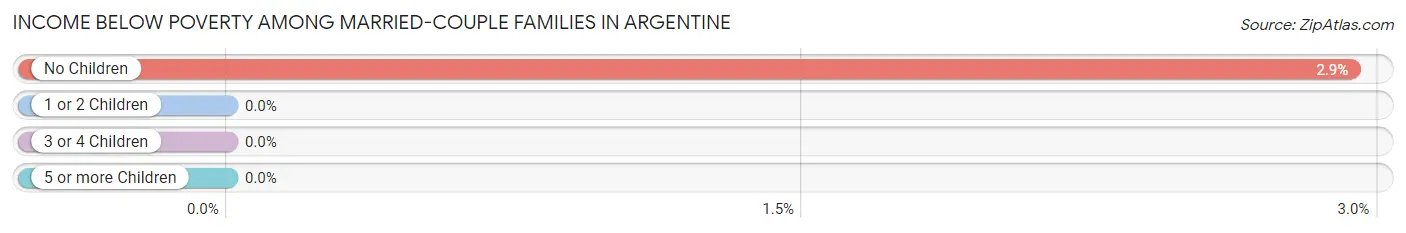
| Children | Above Poverty | Below Poverty |
| No Children | 365 (97.1%) | 11 (2.9%) |
| 1 or 2 Children | 91 (100.0%) | 0 (0.0%) |
| 3 or 4 Children | 65 (100.0%) | 0 (0.0%) |
| 5 or more Children | 0 (0.0%) | 0 (0.0%) |
| Total | 521 (97.9%) | 11 (2.1%) |
Income Below Poverty Among Single-Parent Households in Argentine
According to the poverty data in Argentine, 21.7% or 18 single-father households and 25.0% or 17 single-mother households are living below the poverty line. Among single-father households, those with no children have the highest poverty rate, with 18 households (36.7%) experiencing poverty. Likewise, among single-mother households, those with 1 or 2 children have the highest poverty rate, with 17 households (40.5%) falling below the poverty line.
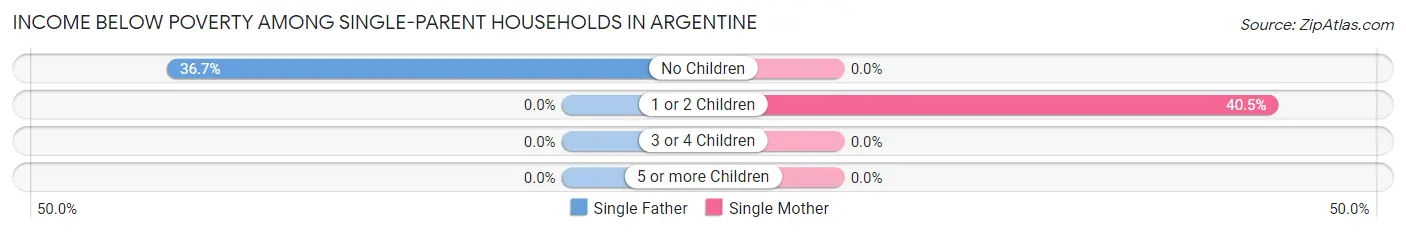
| Children | Single Father | Single Mother |
| No Children | 18 (36.7%) | 0 (0.0%) |
| 1 or 2 Children | 0 (0.0%) | 17 (40.5%) |
| 3 or 4 Children | 0 (0.0%) | 0 (0.0%) |
| 5 or more Children | 0 (0.0%) | 0 (0.0%) |
| Total | 18 (21.7%) | 17 (25.0%) |
Income Below Poverty Among Married-Couple vs Single-Parent Households in Argentine
The poverty data for Argentine shows that 11 of the married-couple family households (2.1%) and 35 of the single-parent households (23.2%) are living below the poverty level. Within the married-couple family households, those with no children have the highest poverty rate, with 11 households (2.9%) falling below the poverty line. Among the single-parent households, those with no children have the highest poverty rate, with 18 household (27.7%) living below poverty.
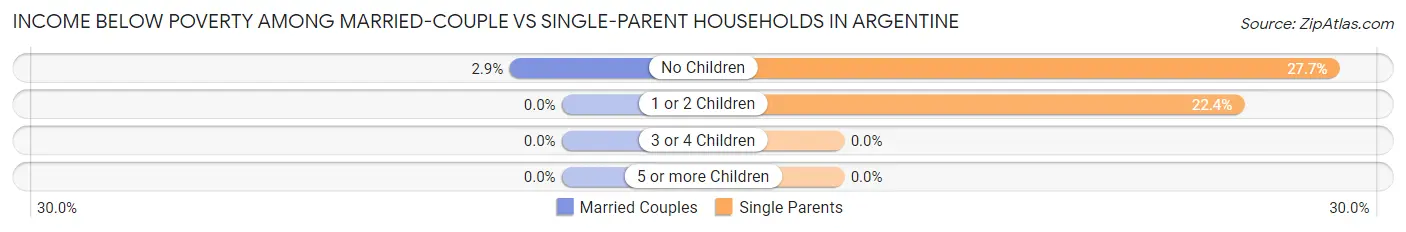
| Children | Married-Couple Families | Single-Parent Households |
| No Children | 11 (2.9%) | 18 (27.7%) |
| 1 or 2 Children | 0 (0.0%) | 17 (22.4%) |
| 3 or 4 Children | 0 (0.0%) | 0 (0.0%) |
| 5 or more Children | 0 (0.0%) | 0 (0.0%) |
| Total | 11 (2.1%) | 35 (23.2%) |
Race in Argentine
The most populous races in Argentine are White / Caucasian (2,337 | 95.4%), Some other Race (55 | 2.2%), and Hispanic or Latino (36 | 1.5%).
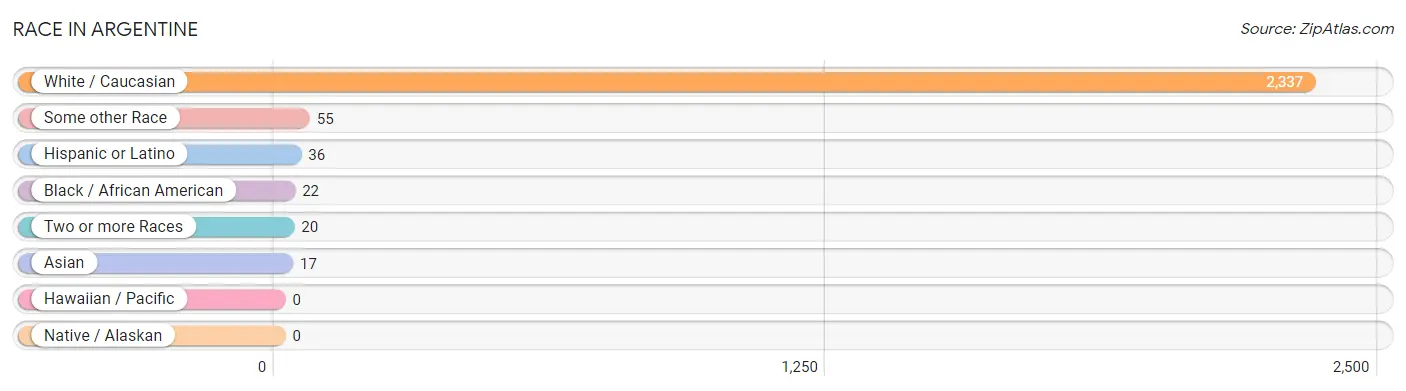
| Race | # Population | % Population |
| Asian | 17 | 0.7% |
| Black / African American | 22 | 0.9% |
| Hawaiian / Pacific | 0 | 0.0% |
| Hispanic or Latino | 36 | 1.5% |
| Native / Alaskan | 0 | 0.0% |
| White / Caucasian | 2,337 | 95.4% |
| Two or more Races | 20 | 0.8% |
| Some other Race | 55 | 2.2% |
| Total | 2,451 | 100.0% |
Ancestry in Argentine
The most populous ancestries reported in Argentine are German (400 | 16.3%), American (338 | 13.8%), Irish (261 | 10.6%), English (247 | 10.1%), and French (153 | 6.2%), together accounting for 57.1% of all Argentine residents.
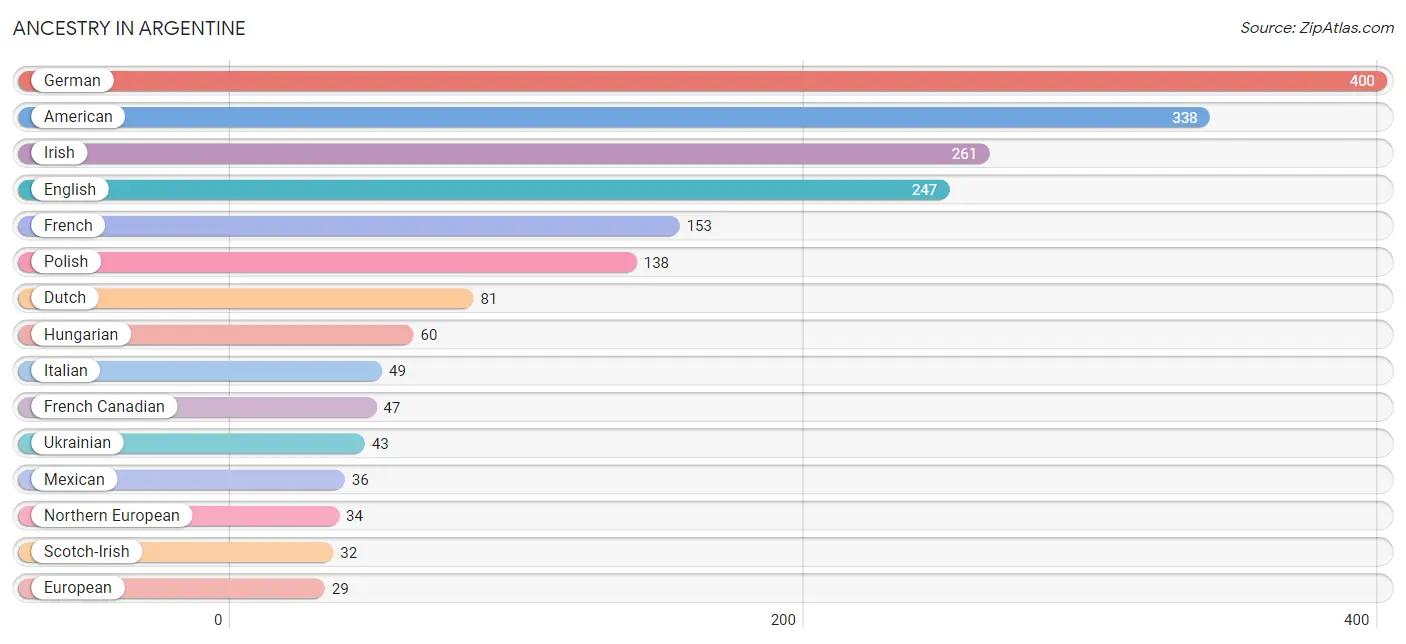
| Ancestry | # Population | % Population |
| American | 338 | 13.8% |
| Belgian | 8 | 0.3% |
| Burmese | 17 | 0.7% |
| Croatian | 9 | 0.4% |
| Dutch | 81 | 3.3% |
| Eastern European | 9 | 0.4% |
| English | 247 | 10.1% |
| European | 29 | 1.2% |
| French | 153 | 6.2% |
| French Canadian | 47 | 1.9% |
| German | 400 | 16.3% |
| Hungarian | 60 | 2.5% |
| Irish | 261 | 10.6% |
| Italian | 49 | 2.0% |
| Lithuanian | 8 | 0.3% |
| Mexican | 36 | 1.5% |
| Northern European | 34 | 1.4% |
| Norwegian | 8 | 0.3% |
| Polish | 138 | 5.6% |
| Scandinavian | 9 | 0.4% |
| Scotch-Irish | 32 | 1.3% |
| Scottish | 8 | 0.3% |
| Swedish | 9 | 0.4% |
| Ukrainian | 43 | 1.8% |
| Welsh | 11 | 0.4% | View All 25 Rows |
Immigrants in Argentine
The most numerous immigrant groups reported in Argentine came from Latin America (25 | 1.0%), Asia (17 | 0.7%), Eastern Asia (17 | 0.7%), Korea (17 | 0.7%), and South America (15 | 0.6%), together accounting for 3.7% of all Argentine residents.
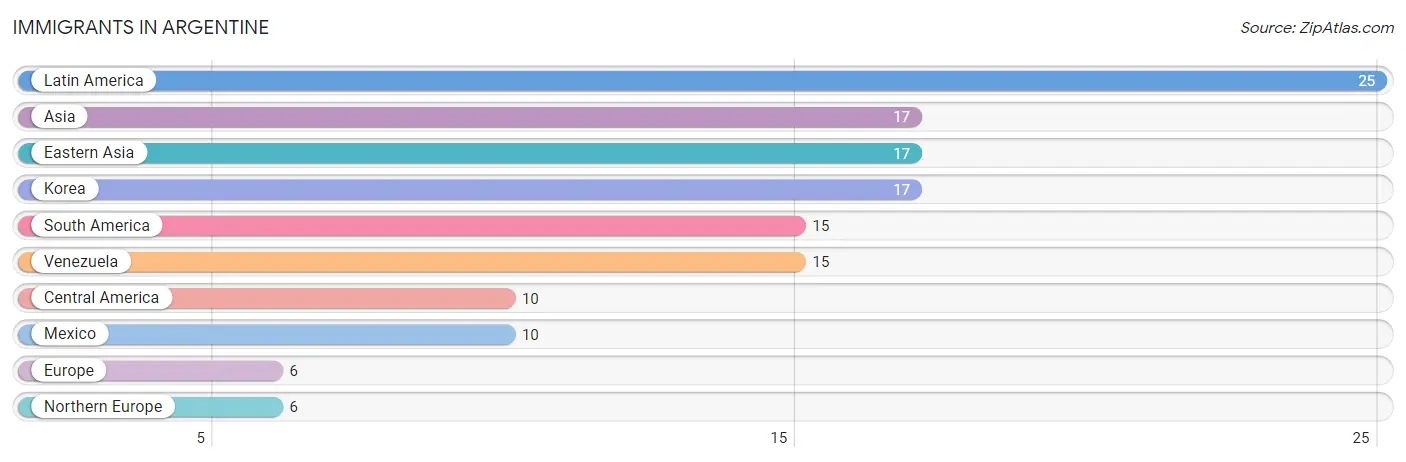
| Immigration Origin | # Population | % Population |
| Asia | 17 | 0.7% |
| Central America | 10 | 0.4% |
| Eastern Asia | 17 | 0.7% |
| Europe | 6 | 0.2% |
| Korea | 17 | 0.7% |
| Latin America | 25 | 1.0% |
| Mexico | 10 | 0.4% |
| Northern Europe | 6 | 0.2% |
| South America | 15 | 0.6% |
| Venezuela | 15 | 0.6% | View All 10 Rows |
Sex and Age in Argentine
Sex and Age in Argentine
The most populous age groups in Argentine are 60 to 64 Years (125 | 10.2%) for men and 50 to 54 Years (141 | 11.5%) for women.
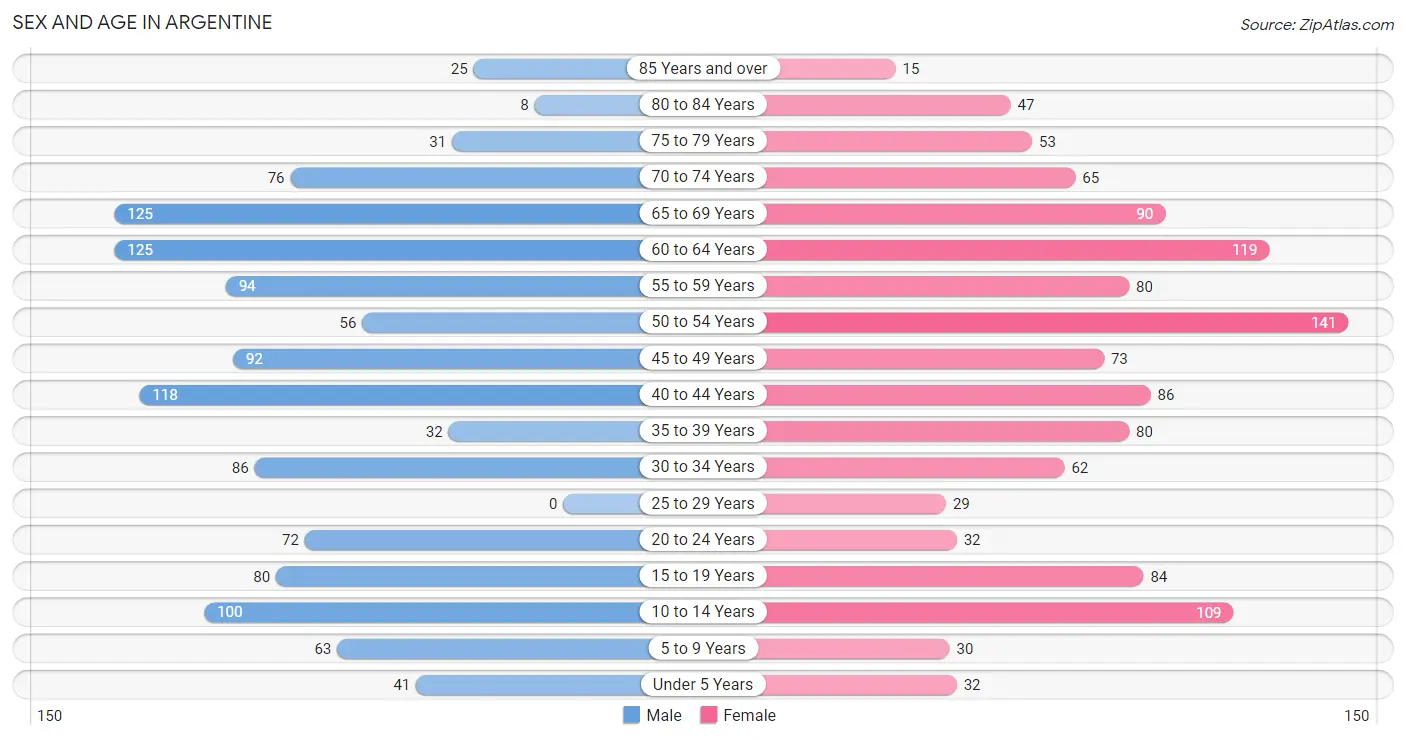
| Age Bracket | Male | Female |
| Under 5 Years | 41 (3.4%) | 32 (2.6%) |
| 5 to 9 Years | 63 (5.1%) | 30 (2.4%) |
| 10 to 14 Years | 100 (8.2%) | 109 (8.9%) |
| 15 to 19 Years | 80 (6.5%) | 84 (6.9%) |
| 20 to 24 Years | 72 (5.9%) | 32 (2.6%) |
| 25 to 29 Years | 0 (0.0%) | 29 (2.4%) |
| 30 to 34 Years | 86 (7.0%) | 62 (5.1%) |
| 35 to 39 Years | 32 (2.6%) | 80 (6.5%) |
| 40 to 44 Years | 118 (9.6%) | 86 (7.0%) |
| 45 to 49 Years | 92 (7.5%) | 73 (5.9%) |
| 50 to 54 Years | 56 (4.6%) | 141 (11.5%) |
| 55 to 59 Years | 94 (7.7%) | 80 (6.5%) |
| 60 to 64 Years | 125 (10.2%) | 119 (9.7%) |
| 65 to 69 Years | 125 (10.2%) | 90 (7.3%) |
| 70 to 74 Years | 76 (6.2%) | 65 (5.3%) |
| 75 to 79 Years | 31 (2.5%) | 53 (4.3%) |
| 80 to 84 Years | 8 (0.6%) | 47 (3.8%) |
| 85 Years and over | 25 (2.0%) | 15 (1.2%) |
| Total | 1,224 (100.0%) | 1,227 (100.0%) |
Families and Households in Argentine
Median Family Size in Argentine
The median family size in Argentine is 2.90 persons per family, with married-couple families (532 | 77.9%) accounting for the largest median family size of 3.03 persons per family. On the other hand, single male/father families (83 | 12.1%) represent the smallest median family size with 2.02 persons per family.
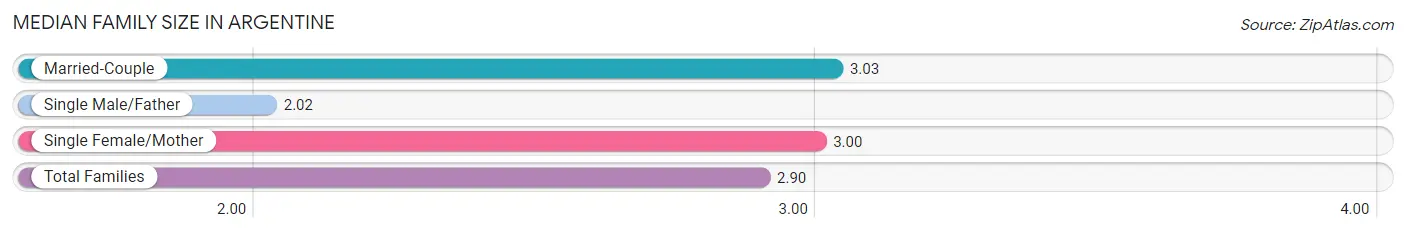
| Family Type | # Families | Family Size |
| Married-Couple | 532 (77.9%) | 3.03 |
| Single Male/Father | 83 (12.1%) | 2.02 |
| Single Female/Mother | 68 (10.0%) | 3.00 |
| Total Families | 683 (100.0%) | 2.90 |
Median Household Size in Argentine
The median household size in Argentine is 2.49 persons per household, with single female/mother households (68 | 7.0%) accounting for the largest median household size of 3.31 persons per household. non-family households (285 | 29.4%) represent the smallest median household size with 1.24 persons per household.
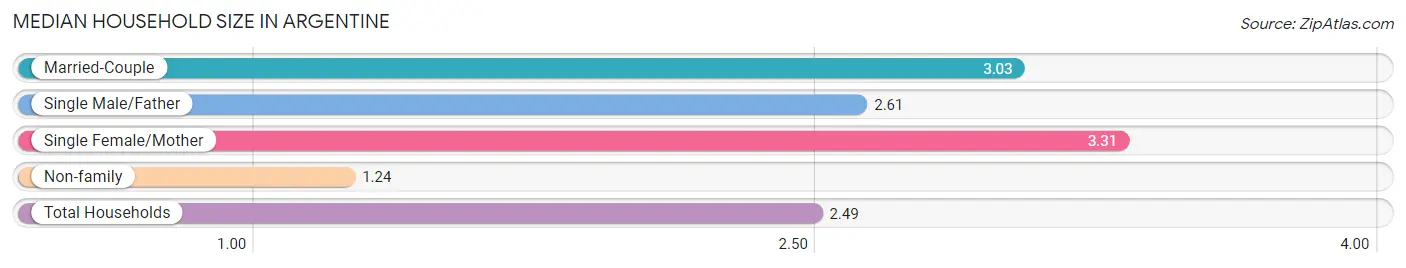
| Household Type | # Households | Household Size |
| Married-Couple | 532 (55.0%) | 3.03 |
| Single Male/Father | 83 (8.6%) | 2.61 |
| Single Female/Mother | 68 (7.0%) | 3.31 |
| Non-family | 285 (29.4%) | 1.24 |
| Total Households | 968 (100.0%) | 2.49 |
Household Size by Marriage Status in Argentine
Out of a total of 968 households in Argentine, 683 (70.6%) are family households, while 285 (29.4%) are nonfamily households. The most numerous type of family households are 2-person households, comprising 310, and the most common type of nonfamily households are 1-person households, comprising 222.
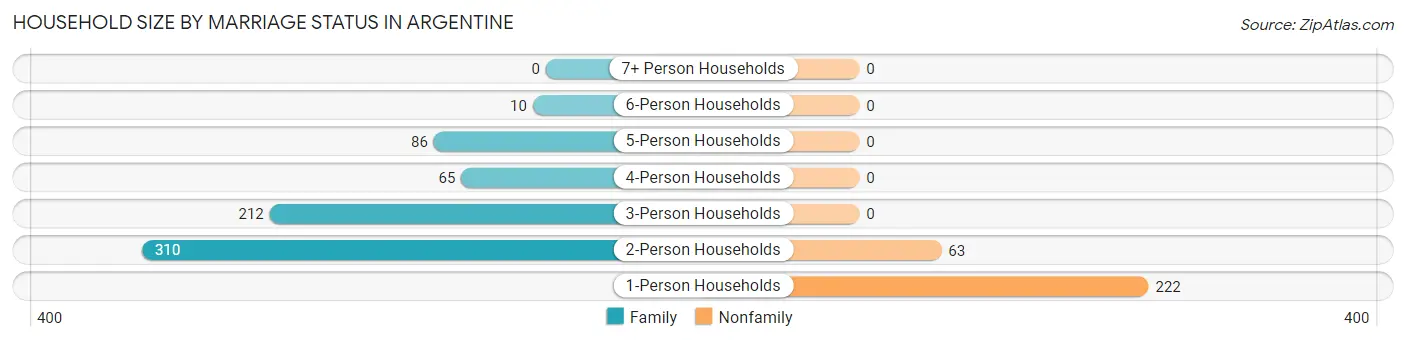
| Household Size | Family Households | Nonfamily Households |
| 1-Person Households | - | 222 (22.9%) |
| 2-Person Households | 310 (32.0%) | 63 (6.5%) |
| 3-Person Households | 212 (21.9%) | 0 (0.0%) |
| 4-Person Households | 65 (6.7%) | 0 (0.0%) |
| 5-Person Households | 86 (8.9%) | 0 (0.0%) |
| 6-Person Households | 10 (1.0%) | 0 (0.0%) |
| 7+ Person Households | 0 (0.0%) | 0 (0.0%) |
| Total | 683 (70.6%) | 285 (29.4%) |
Female Fertility in Argentine
Fertility by Age in Argentine
Average fertility rate in Argentine is 42.0 births per 1,000 women. Women in the age bracket of 20 to 34 years have the highest fertility rate with 163.0 births per 1,000 women. Women in the age bracket of 20 to 34 years acount for 100.0% of all women with births.
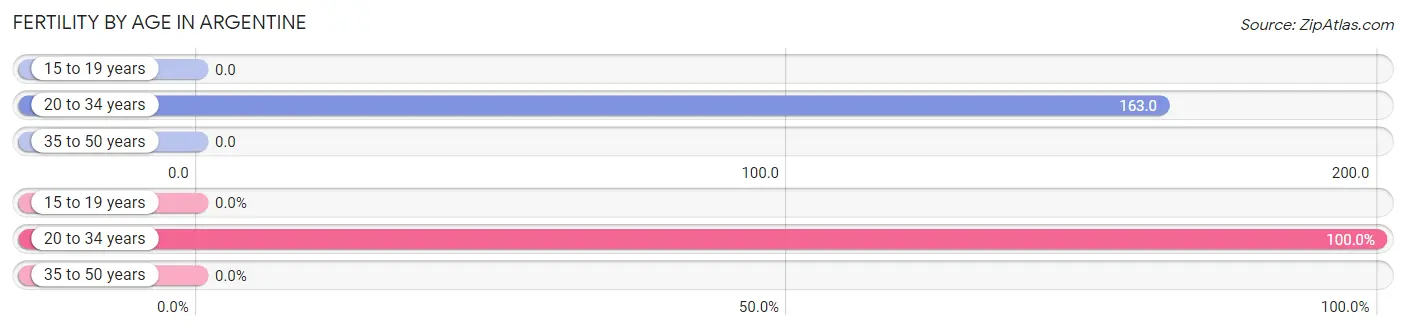
| Age Bracket | Women with Births | Births / 1,000 Women |
| 15 to 19 years | 0 (0.0%) | 0.0 |
| 20 to 34 years | 20 (100.0%) | 163.0 |
| 35 to 50 years | 0 (0.0%) | 0.0 |
| Total | 20 (100.0%) | 42.0 |
Fertility by Age by Marriage Status in Argentine
45.0% of women with births (20) in Argentine are married. The highest percentage of unmarried women with births falls into 20 to 34 years age bracket with 55.0% of them unmarried at the time of birth, while the lowest percentage of unmarried women with births belong to 20 to 34 years age bracket with 55.0% of them unmarried.
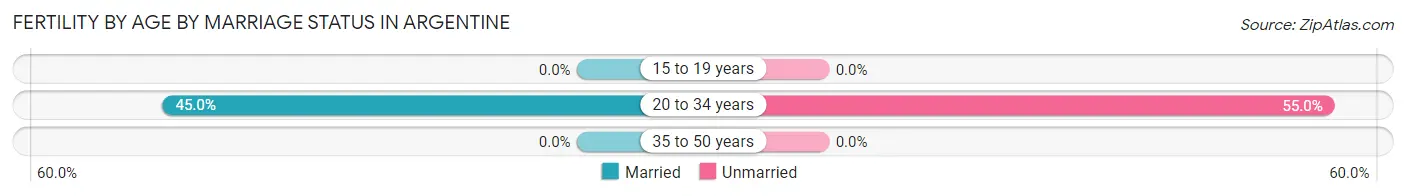
| Age Bracket | Married | Unmarried |
| 15 to 19 years | 0 (0.0%) | 0 (0.0%) |
| 20 to 34 years | 9 (45.0%) | 11 (55.0%) |
| 35 to 50 years | 0 (0.0%) | 0 (0.0%) |
| Total | 9 (45.0%) | 11 (55.0%) |
Fertility by Education in Argentine
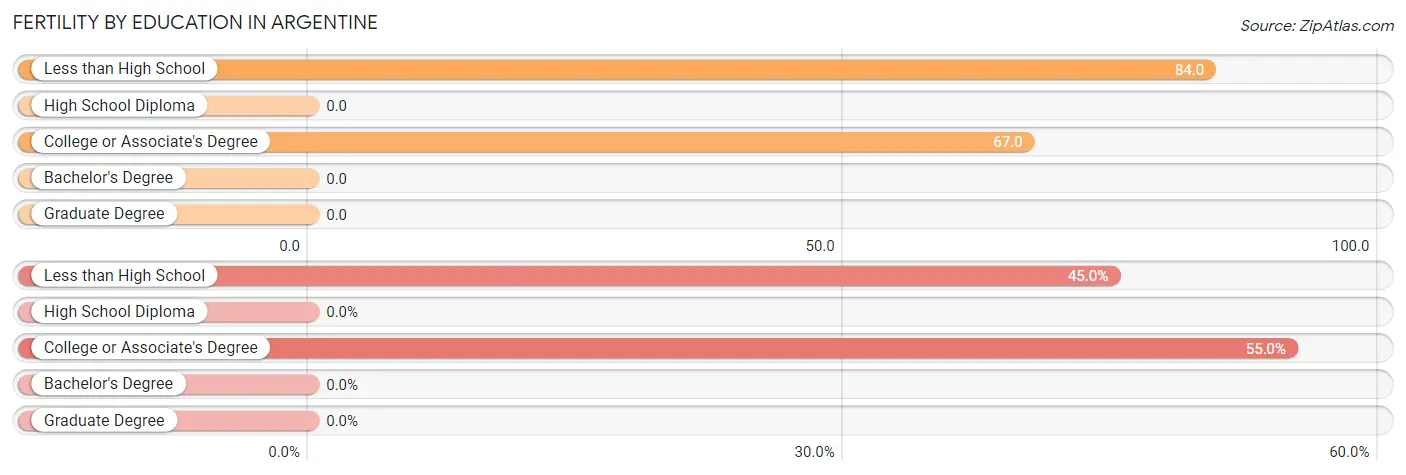
| Educational Attainment | Women with Births | Births / 1,000 Women |
| Less than High School | 9 (45.0%) | 84.0 |
| High School Diploma | 0 (0.0%) | 0.0 |
| College or Associate's Degree | 11 (55.0%) | 67.0 |
| Bachelor's Degree | 0 (0.0%) | 0.0 |
| Graduate Degree | 0 (0.0%) | 0.0 |
| Total | 20 (100.0%) | 42.0 |
Fertility by Education by Marriage Status in Argentine
55.0% of women with births in Argentine are unmarried. Women with the educational attainment of less than high school are most likely to be married with 100.0% of them married at childbirth, while women with the educational attainment of college or associate's degree are least likely to be married with 100.0% of them unmarried at childbirth.
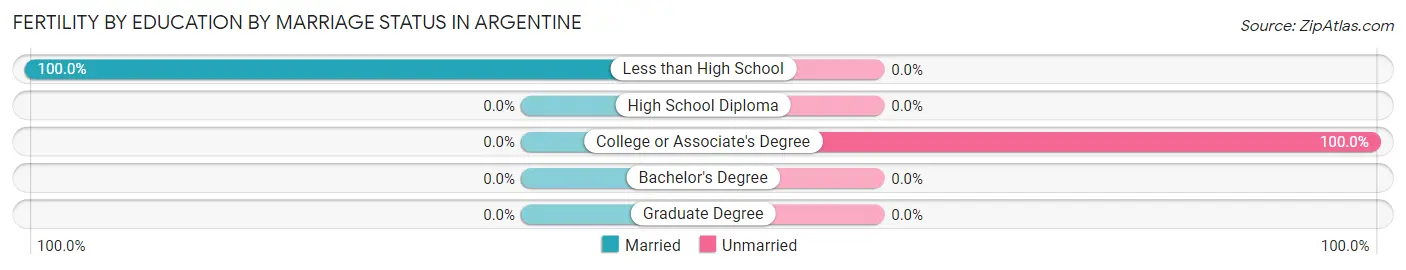
| Educational Attainment | Married | Unmarried |
| Less than High School | 9 (100.0%) | 0 (0.0%) |
| High School Diploma | 0 (0.0%) | 0 (0.0%) |
| College or Associate's Degree | 0 (0.0%) | 11 (100.0%) |
| Bachelor's Degree | 0 (0.0%) | 0 (0.0%) |
| Graduate Degree | 0 (0.0%) | 0 (0.0%) |
| Total | 9 (45.0%) | 11 (55.0%) |
Employment Characteristics in Argentine
Employment by Class of Employer in Argentine
Among the 974 employed individuals in Argentine, private company employees (745 | 76.5%), local government employees (85 | 8.7%), and not-for-profit organizations (50 | 5.1%) make up the most common classes of employment.
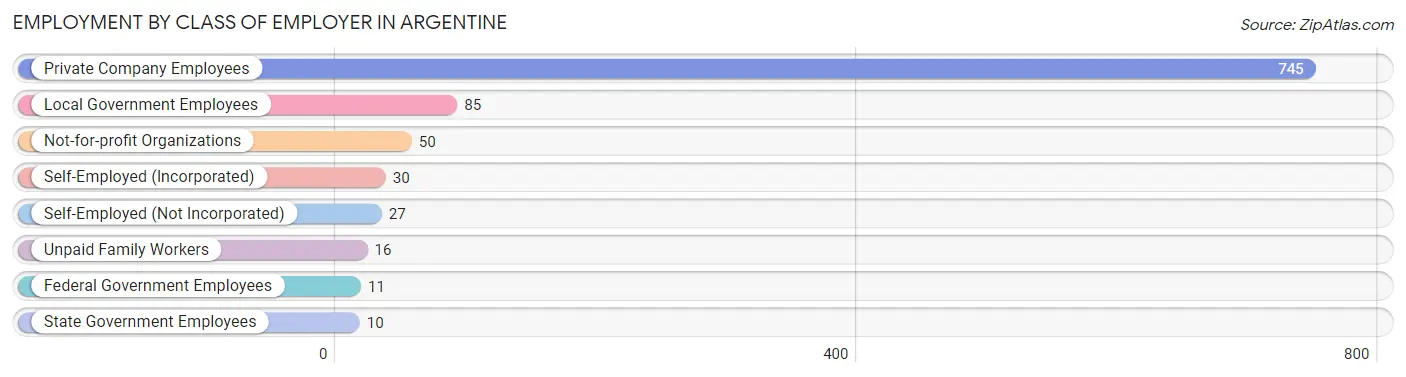
| Employer Class | # Employees | % Employees |
| Private Company Employees | 745 | 76.5% |
| Self-Employed (Incorporated) | 30 | 3.1% |
| Self-Employed (Not Incorporated) | 27 | 2.8% |
| Not-for-profit Organizations | 50 | 5.1% |
| Local Government Employees | 85 | 8.7% |
| State Government Employees | 10 | 1.0% |
| Federal Government Employees | 11 | 1.1% |
| Unpaid Family Workers | 16 | 1.6% |
| Total | 974 | 100.0% |
Employment Status by Age in Argentine
According to the labor force statistics for Argentine, out of the total population over 16 years of age (2,057), 53.0% or 1,090 individuals are in the labor force, with 6.2% or 68 of them unemployed. The age group with the highest labor force participation rate is 25 to 29 years, with 100.0% or 29 individuals in the labor force. Within the labor force, the 35 to 44 years age range has the highest percentage of unemployed individuals, with 12.3% or 29 of them being unemployed.
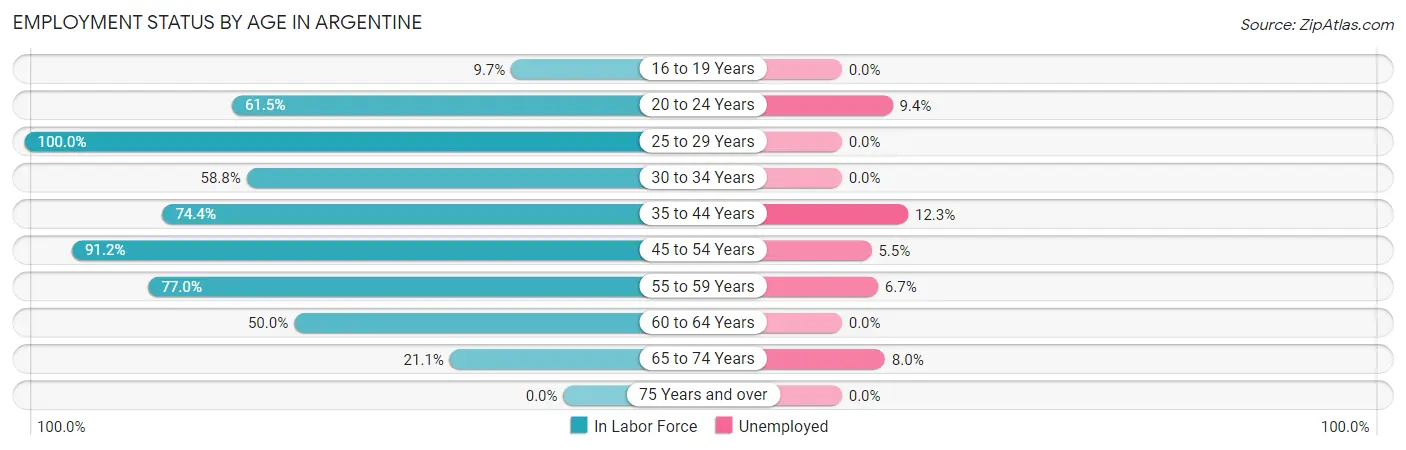
| Age Bracket | In Labor Force | Unemployed |
| 16 to 19 Years | 14 (9.7%) | 0 (0.0%) |
| 20 to 24 Years | 64 (61.5%) | 6 (9.4%) |
| 25 to 29 Years | 29 (100.0%) | 0 (0.0%) |
| 30 to 34 Years | 87 (58.8%) | 0 (0.0%) |
| 35 to 44 Years | 235 (74.4%) | 29 (12.3%) |
| 45 to 54 Years | 330 (91.2%) | 18 (5.5%) |
| 55 to 59 Years | 134 (77.0%) | 9 (6.7%) |
| 60 to 64 Years | 122 (50.0%) | 0 (0.0%) |
| 65 to 74 Years | 75 (21.1%) | 6 (8.0%) |
| 75 Years and over | 0 (0.0%) | 0 (0.0%) |
| Total | 1,090 (53.0%) | 68 (6.2%) |
Employment Status by Educational Attainment in Argentine
According to labor force statistics for Argentine, 73.6% of individuals (937) out of the total population between 25 and 64 years of age (1,273) are in the labor force, with 6.0% or 56 of them being unemployed. The group with the highest labor force participation rate are those with the educational attainment of bachelor's degree or higher, with 85.5% or 389 individuals in the labor force. Within the labor force, individuals with high school diploma education have the highest percentage of unemployment, with 14.2% or 30 of them being unemployed.
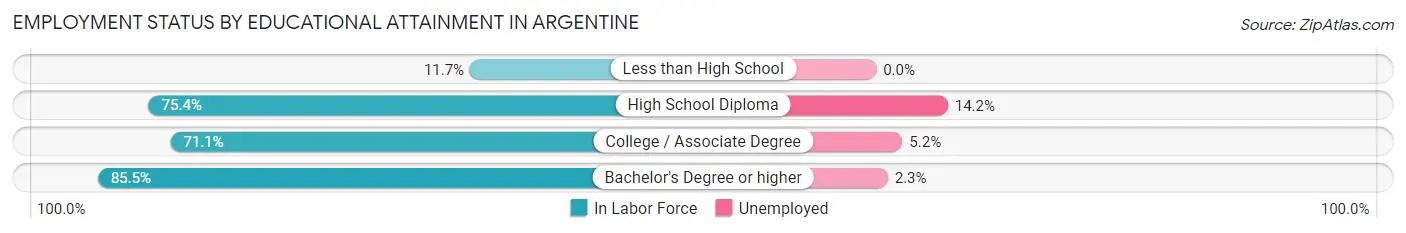
| Educational Attainment | In Labor Force | Unemployed |
| Less than High School | 9 (11.7%) | 0 (0.0%) |
| High School Diploma | 212 (75.4%) | 40 (14.2%) |
| College / Associate Degree | 327 (71.1%) | 24 (5.2%) |
| Bachelor's Degree or higher | 389 (85.5%) | 10 (2.3%) |
| Total | 937 (73.6%) | 76 (6.0%) |
Employment Occupations by Sex in Argentine
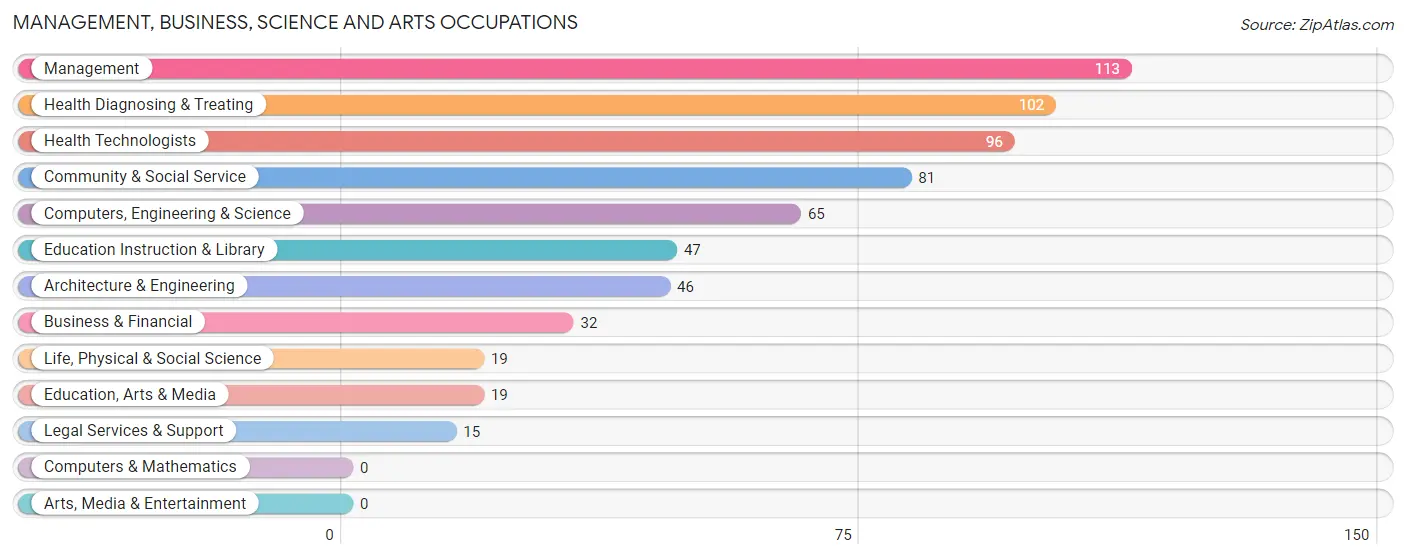
Management, Business, Science and Arts Occupations
The most common Management, Business, Science and Arts occupations in Argentine are Management (113 | 11.1%), Health Diagnosing & Treating (102 | 10.0%), Health Technologists (96 | 9.4%), Community & Social Service (81 | 7.9%), and Computers, Engineering & Science (65 | 6.4%).
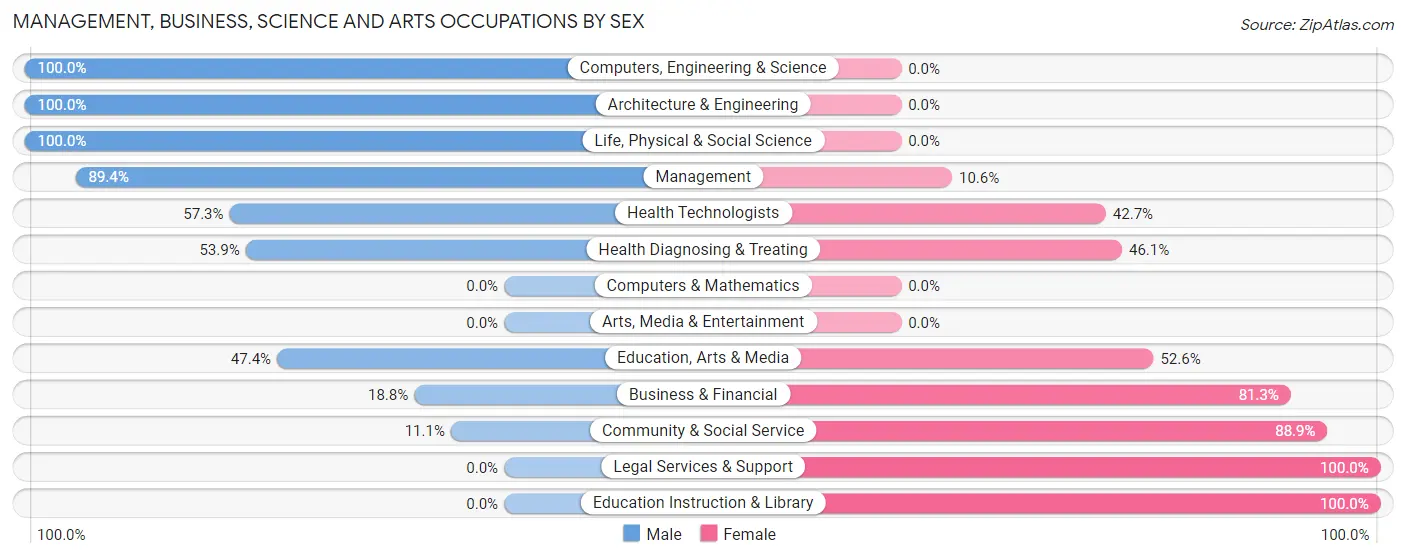
Management, Business, Science and Arts Occupations by Sex
Within the Management, Business, Science and Arts occupations in Argentine, the most male-oriented occupations are Computers, Engineering & Science (100.0%), Architecture & Engineering (100.0%), and Life, Physical & Social Science (100.0%), while the most female-oriented occupations are Legal Services & Support (100.0%), Education Instruction & Library (100.0%), and Community & Social Service (88.9%).
| Occupation | Male | Female |
| Management | 101 (89.4%) | 12 (10.6%) |
| Business & Financial | 6 (18.8%) | 26 (81.2%) |
| Computers, Engineering & Science | 65 (100.0%) | 0 (0.0%) |
| Computers & Mathematics | 0 (0.0%) | 0 (0.0%) |
| Architecture & Engineering | 46 (100.0%) | 0 (0.0%) |
| Life, Physical & Social Science | 19 (100.0%) | 0 (0.0%) |
| Community & Social Service | 9 (11.1%) | 72 (88.9%) |
| Education, Arts & Media | 9 (47.4%) | 10 (52.6%) |
| Legal Services & Support | 0 (0.0%) | 15 (100.0%) |
| Education Instruction & Library | 0 (0.0%) | 47 (100.0%) |
| Arts, Media & Entertainment | 0 (0.0%) | 0 (0.0%) |
| Health Diagnosing & Treating | 55 (53.9%) | 47 (46.1%) |
| Health Technologists | 55 (57.3%) | 41 (42.7%) |
| Total (Category) | 236 (60.1%) | 157 (40.0%) |
| Total (Overall) | 563 (55.1%) | 459 (44.9%) |
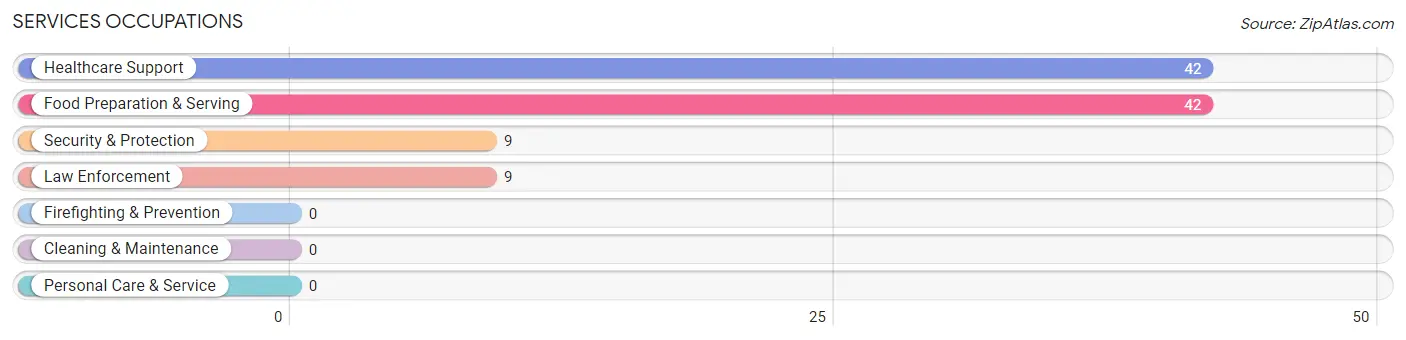
Services Occupations
The most common Services occupations in Argentine are Healthcare Support (42 | 4.1%), Food Preparation & Serving (42 | 4.1%), Security & Protection (9 | 0.9%), and Law Enforcement (9 | 0.9%).
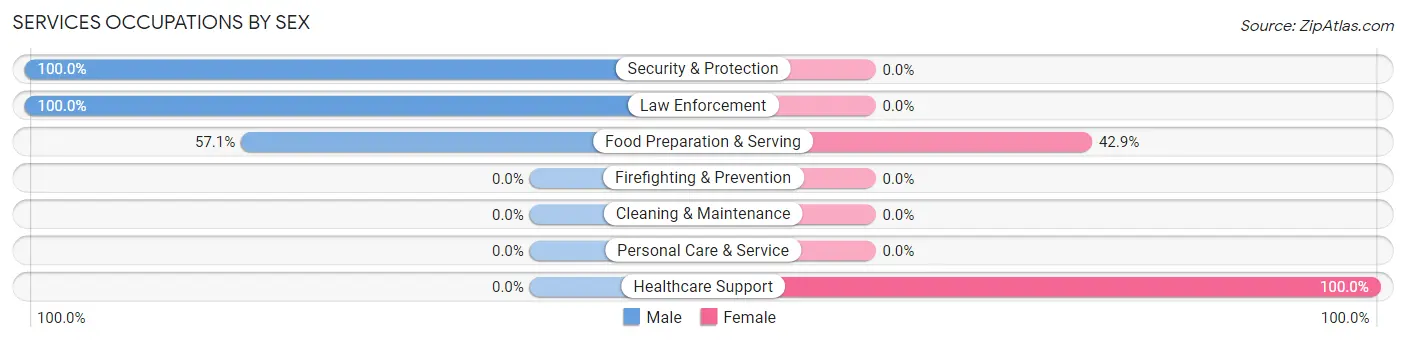
Services Occupations by Sex
Within the Services occupations in Argentine, the most male-oriented occupations are Security & Protection (100.0%), Law Enforcement (100.0%), and Food Preparation & Serving (57.1%), while the most female-oriented occupations are Healthcare Support (100.0%), and Food Preparation & Serving (42.9%).
| Occupation | Male | Female |
| Healthcare Support | 0 (0.0%) | 42 (100.0%) |
| Security & Protection | 9 (100.0%) | 0 (0.0%) |
| Firefighting & Prevention | 0 (0.0%) | 0 (0.0%) |
| Law Enforcement | 9 (100.0%) | 0 (0.0%) |
| Food Preparation & Serving | 24 (57.1%) | 18 (42.9%) |
| Cleaning & Maintenance | 0 (0.0%) | 0 (0.0%) |
| Personal Care & Service | 0 (0.0%) | 0 (0.0%) |
| Total (Category) | 33 (35.5%) | 60 (64.5%) |
| Total (Overall) | 563 (55.1%) | 459 (44.9%) |
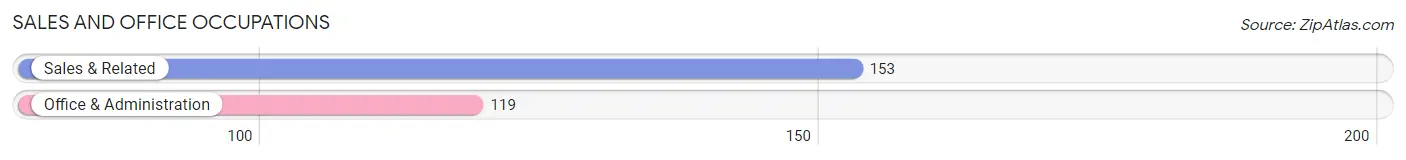
Sales and Office Occupations
The most common Sales and Office occupations in Argentine are Sales & Related (153 | 15.0%), and Office & Administration (119 | 11.6%).
Sales and Office Occupations by Sex

| Occupation | Male | Female |
| Sales & Related | 93 (60.8%) | 60 (39.2%) |
| Office & Administration | 11 (9.2%) | 108 (90.8%) |
| Total (Category) | 104 (38.2%) | 168 (61.8%) |
| Total (Overall) | 563 (55.1%) | 459 (44.9%) |
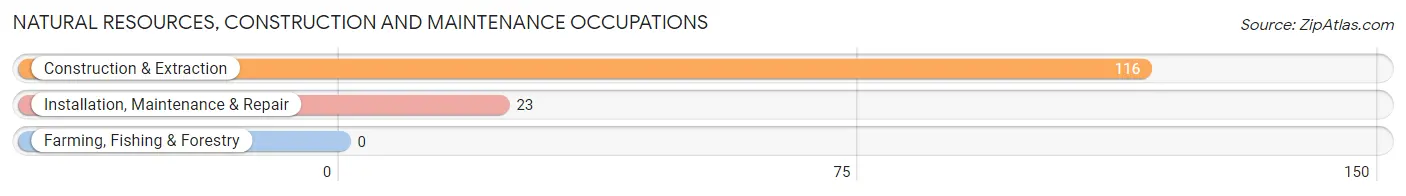
Natural Resources, Construction and Maintenance Occupations
The most common Natural Resources, Construction and Maintenance occupations in Argentine are Construction & Extraction (116 | 11.4%), and Installation, Maintenance & Repair (23 | 2.2%).
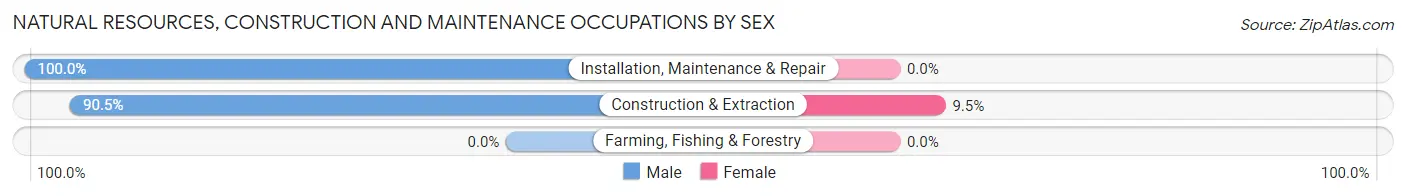
Natural Resources, Construction and Maintenance Occupations by Sex
| Occupation | Male | Female |
| Farming, Fishing & Forestry | 0 (0.0%) | 0 (0.0%) |
| Construction & Extraction | 105 (90.5%) | 11 (9.5%) |
| Installation, Maintenance & Repair | 23 (100.0%) | 0 (0.0%) |
| Total (Category) | 128 (92.1%) | 11 (7.9%) |
| Total (Overall) | 563 (55.1%) | 459 (44.9%) |
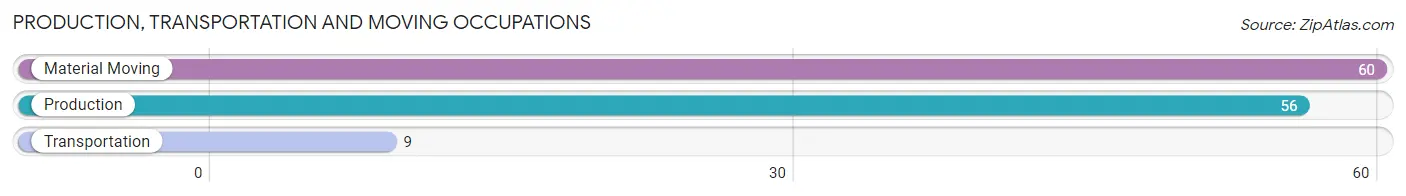
Production, Transportation and Moving Occupations
The most common Production, Transportation and Moving occupations in Argentine are Material Moving (60 | 5.9%), Production (56 | 5.5%), and Transportation (9 | 0.9%).
Production, Transportation and Moving Occupations by Sex
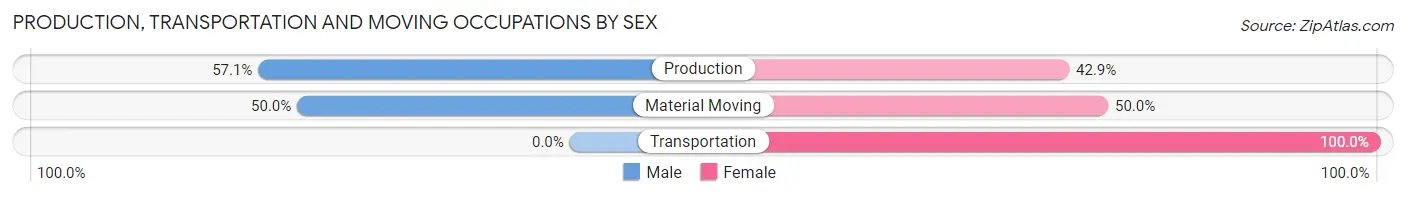
| Occupation | Male | Female |
| Production | 32 (57.1%) | 24 (42.9%) |
| Transportation | 0 (0.0%) | 9 (100.0%) |
| Material Moving | 30 (50.0%) | 30 (50.0%) |
| Total (Category) | 62 (49.6%) | 63 (50.4%) |
| Total (Overall) | 563 (55.1%) | 459 (44.9%) |
Employment Industries by Sex in Argentine
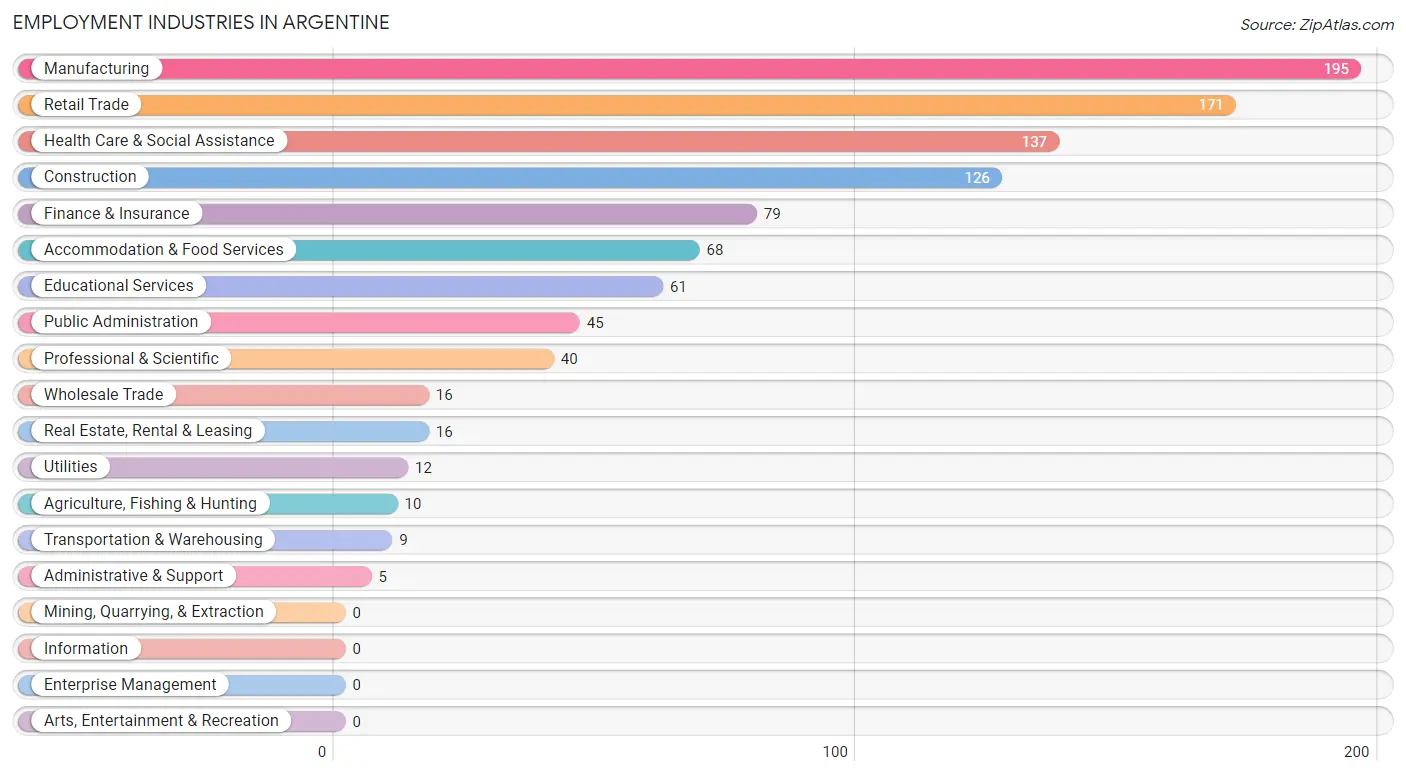
Employment Industries in Argentine
The major employment industries in Argentine include Manufacturing (195 | 19.1%), Retail Trade (171 | 16.7%), Health Care & Social Assistance (137 | 13.4%), Construction (126 | 12.3%), and Finance & Insurance (79 | 7.7%).
Employment Industries by Sex in Argentine
The Argentine industries that see more men than women are Agriculture, Fishing & Hunting (100.0%), Utilities (100.0%), and Administrative & Support (100.0%), whereas the industries that tend to have a higher number of women are Wholesale Trade (100.0%), Transportation & Warehousing (100.0%), and Real Estate, Rental & Leasing (100.0%).
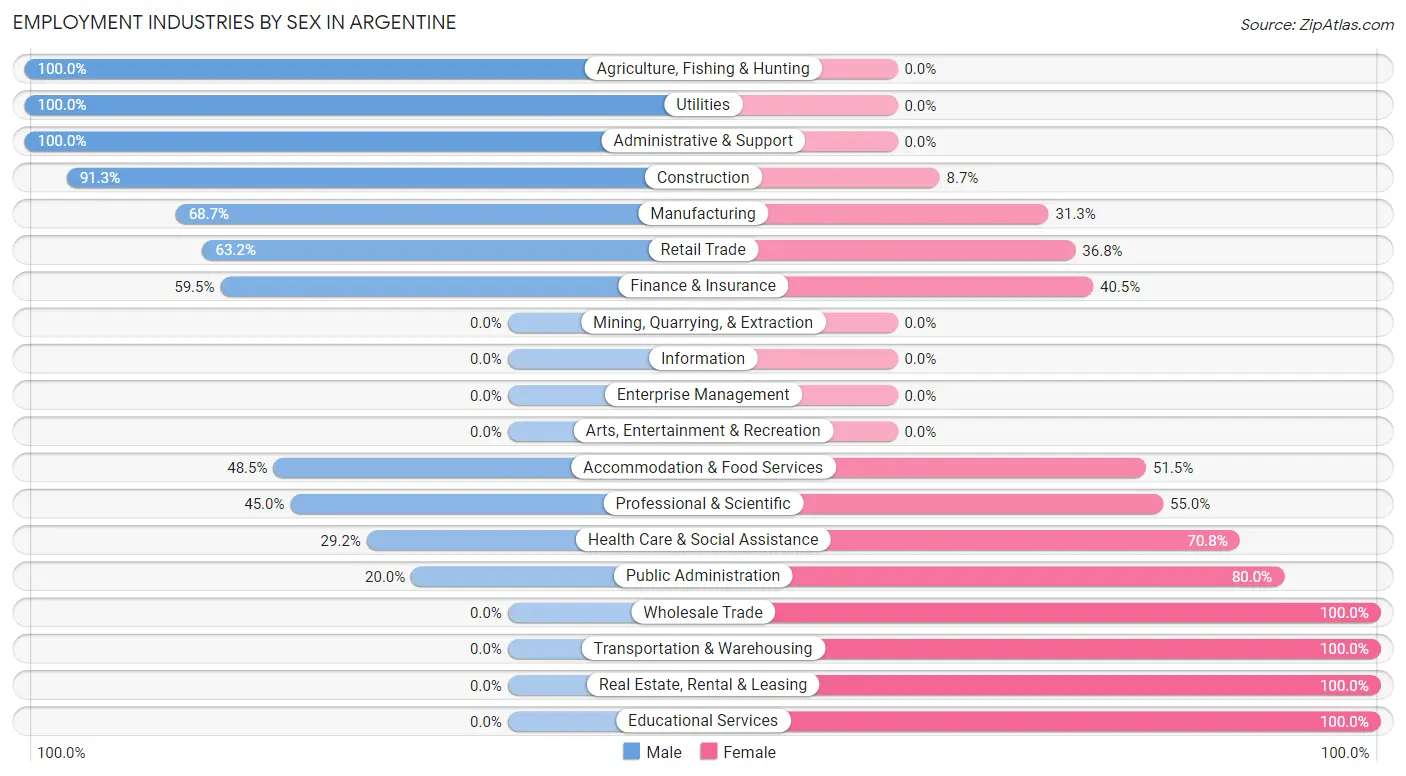
| Industry | Male | Female |
| Agriculture, Fishing & Hunting | 10 (100.0%) | 0 (0.0%) |
| Mining, Quarrying, & Extraction | 0 (0.0%) | 0 (0.0%) |
| Construction | 115 (91.3%) | 11 (8.7%) |
| Manufacturing | 134 (68.7%) | 61 (31.3%) |
| Wholesale Trade | 0 (0.0%) | 16 (100.0%) |
| Retail Trade | 108 (63.2%) | 63 (36.8%) |
| Transportation & Warehousing | 0 (0.0%) | 9 (100.0%) |
| Utilities | 12 (100.0%) | 0 (0.0%) |
| Information | 0 (0.0%) | 0 (0.0%) |
| Finance & Insurance | 47 (59.5%) | 32 (40.5%) |
| Real Estate, Rental & Leasing | 0 (0.0%) | 16 (100.0%) |
| Professional & Scientific | 18 (45.0%) | 22 (55.0%) |
| Enterprise Management | 0 (0.0%) | 0 (0.0%) |
| Administrative & Support | 5 (100.0%) | 0 (0.0%) |
| Educational Services | 0 (0.0%) | 61 (100.0%) |
| Health Care & Social Assistance | 40 (29.2%) | 97 (70.8%) |
| Arts, Entertainment & Recreation | 0 (0.0%) | 0 (0.0%) |
| Accommodation & Food Services | 33 (48.5%) | 35 (51.5%) |
| Public Administration | 9 (20.0%) | 36 (80.0%) |
| Total | 563 (55.1%) | 459 (44.9%) |
Education in Argentine
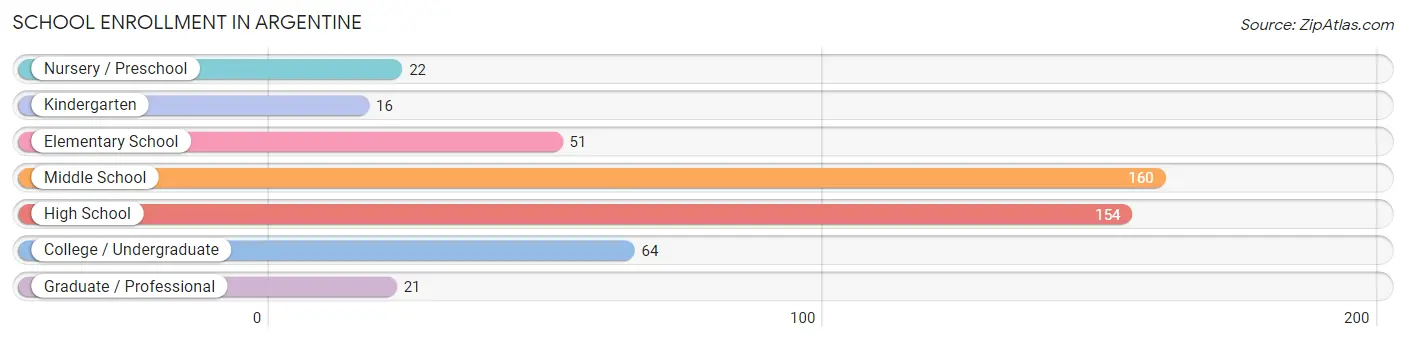
School Enrollment in Argentine
The most common levels of schooling among the 488 students in Argentine are middle school (160 | 32.8%), high school (154 | 31.6%), and college / undergraduate (64 | 13.1%).
| School Level | # Students | % Students |
| Nursery / Preschool | 22 | 4.5% |
| Kindergarten | 16 | 3.3% |
| Elementary School | 51 | 10.4% |
| Middle School | 160 | 32.8% |
| High School | 154 | 31.6% |
| College / Undergraduate | 64 | 13.1% |
| Graduate / Professional | 21 | 4.3% |
| Total | 488 | 100.0% |
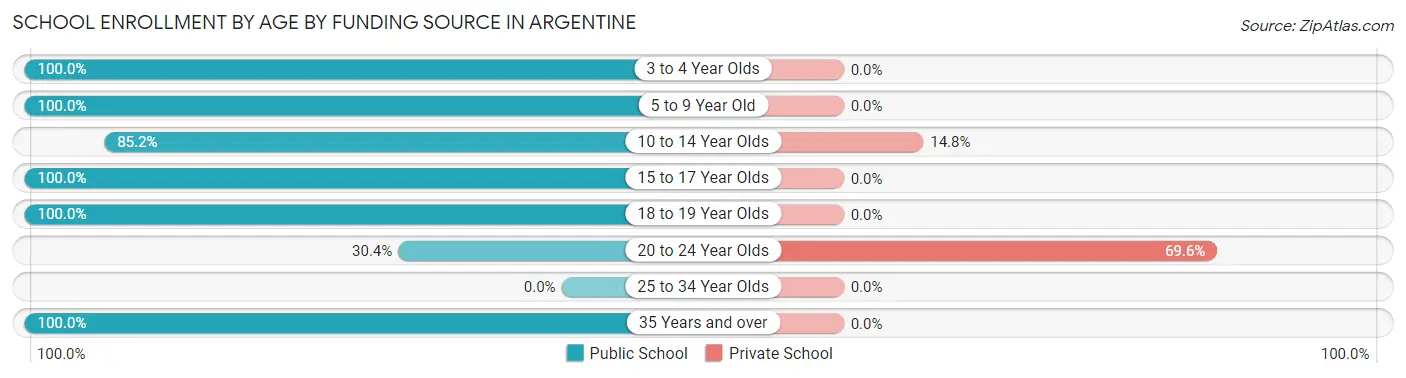
School Enrollment by Age by Funding Source in Argentine
Out of a total of 488 students who are enrolled in schools in Argentine, 63 (12.9%) attend a private institution, while the remaining 425 (87.1%) are enrolled in public schools. The age group of 20 to 24 year olds has the highest likelihood of being enrolled in private schools, with 32 (69.6% in the age bracket) enrolled. Conversely, the age group of 3 to 4 year olds has the lowest likelihood of being enrolled in a private school, with 9 (100.0% in the age bracket) attending a public institution.
| Age Bracket | Public School | Private School |
| 3 to 4 Year Olds | 9 (100.0%) | 0 (0.0%) |
| 5 to 9 Year Old | 61 (100.0%) | 0 (0.0%) |
| 10 to 14 Year Olds | 178 (85.2%) | 31 (14.8%) |
| 15 to 17 Year Olds | 97 (100.0%) | 0 (0.0%) |
| 18 to 19 Year Olds | 45 (100.0%) | 0 (0.0%) |
| 20 to 24 Year Olds | 14 (30.4%) | 32 (69.6%) |
| 25 to 34 Year Olds | 0 (0.0%) | 0 (0.0%) |
| 35 Years and over | 21 (100.0%) | 0 (0.0%) |
| Total | 425 (87.1%) | 63 (12.9%) |
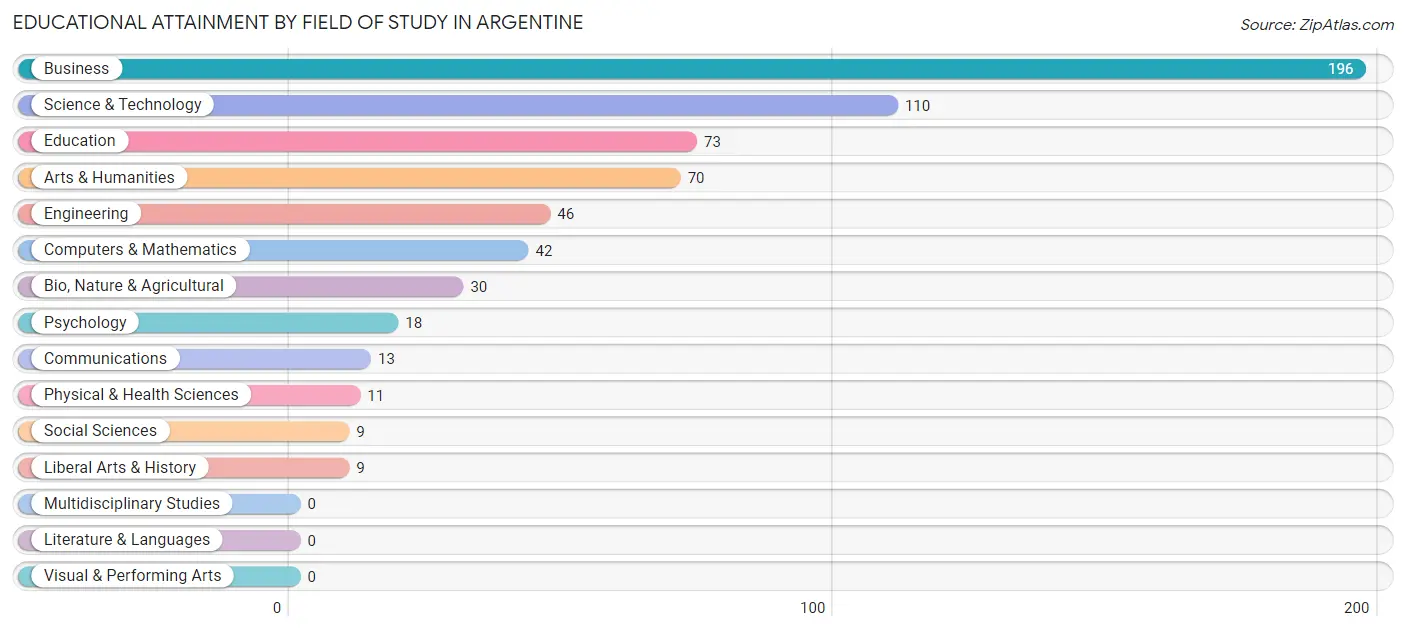
Educational Attainment by Field of Study in Argentine
Business (196 | 31.3%), science & technology (110 | 17.5%), education (73 | 11.6%), arts & humanities (70 | 11.2%), and engineering (46 | 7.3%) are the most common fields of study among 627 individuals in Argentine who have obtained a bachelor's degree or higher.
| Field of Study | # Graduates | % Graduates |
| Computers & Mathematics | 42 | 6.7% |
| Bio, Nature & Agricultural | 30 | 4.8% |
| Physical & Health Sciences | 11 | 1.8% |
| Psychology | 18 | 2.9% |
| Social Sciences | 9 | 1.4% |
| Engineering | 46 | 7.3% |
| Multidisciplinary Studies | 0 | 0.0% |
| Science & Technology | 110 | 17.5% |
| Business | 196 | 31.3% |
| Education | 73 | 11.6% |
| Literature & Languages | 0 | 0.0% |
| Liberal Arts & History | 9 | 1.4% |
| Visual & Performing Arts | 0 | 0.0% |
| Communications | 13 | 2.1% |
| Arts & Humanities | 70 | 11.2% |
| Total | 627 | 100.0% |
Transportation & Commute in Argentine
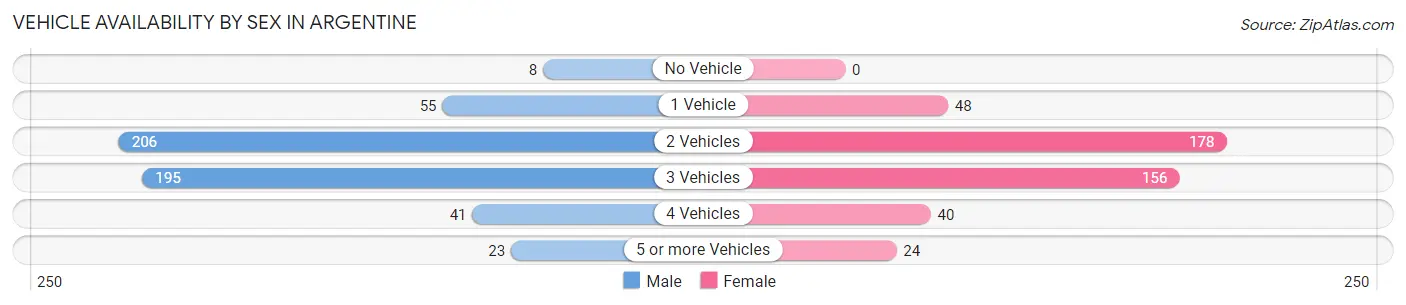
Vehicle Availability by Sex in Argentine
The most prevalent vehicle ownership categories in Argentine are males with 2 vehicles (206, accounting for 39.0%) and females with 2 vehicles (178, making up 46.2%).
| Vehicles Available | Male | Female |
| No Vehicle | 8 (1.5%) | 0 (0.0%) |
| 1 Vehicle | 55 (10.4%) | 48 (10.8%) |
| 2 Vehicles | 206 (39.0%) | 178 (39.9%) |
| 3 Vehicles | 195 (36.9%) | 156 (35.0%) |
| 4 Vehicles | 41 (7.8%) | 40 (9.0%) |
| 5 or more Vehicles | 23 (4.4%) | 24 (5.4%) |
| Total | 528 (100.0%) | 446 (100.0%) |
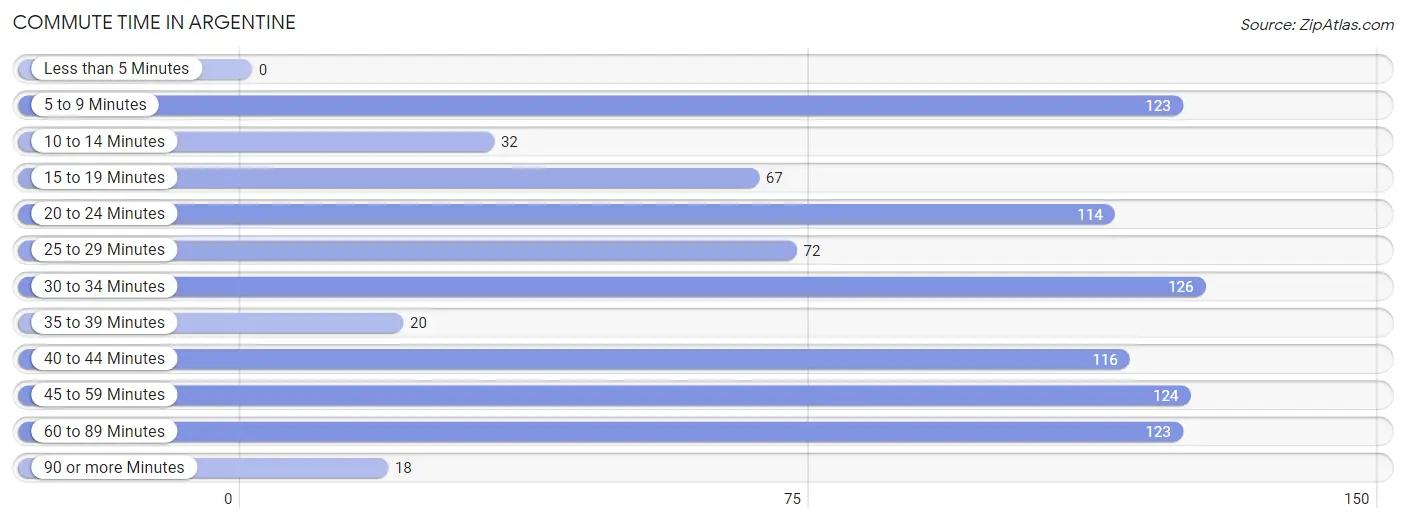
Commute Time in Argentine
The most frequently occuring commute durations in Argentine are 30 to 34 minutes (126 commuters, 13.5%), 45 to 59 minutes (124 commuters, 13.3%), and 5 to 9 minutes (123 commuters, 13.2%).
| Commute Time | # Commuters | % Commuters |
| Less than 5 Minutes | 0 | 0.0% |
| 5 to 9 Minutes | 123 | 13.2% |
| 10 to 14 Minutes | 32 | 3.4% |
| 15 to 19 Minutes | 67 | 7.2% |
| 20 to 24 Minutes | 114 | 12.2% |
| 25 to 29 Minutes | 72 | 7.7% |
| 30 to 34 Minutes | 126 | 13.5% |
| 35 to 39 Minutes | 20 | 2.1% |
| 40 to 44 Minutes | 116 | 12.4% |
| 45 to 59 Minutes | 124 | 13.3% |
| 60 to 89 Minutes | 123 | 13.2% |
| 90 or more Minutes | 18 | 1.9% |
Commute Time by Sex in Argentine
The most common commute times in Argentine are 60 to 89 minutes (123 commuters, 24.1%) for males and 5 to 9 minutes (83 commuters, 19.5%) for females.
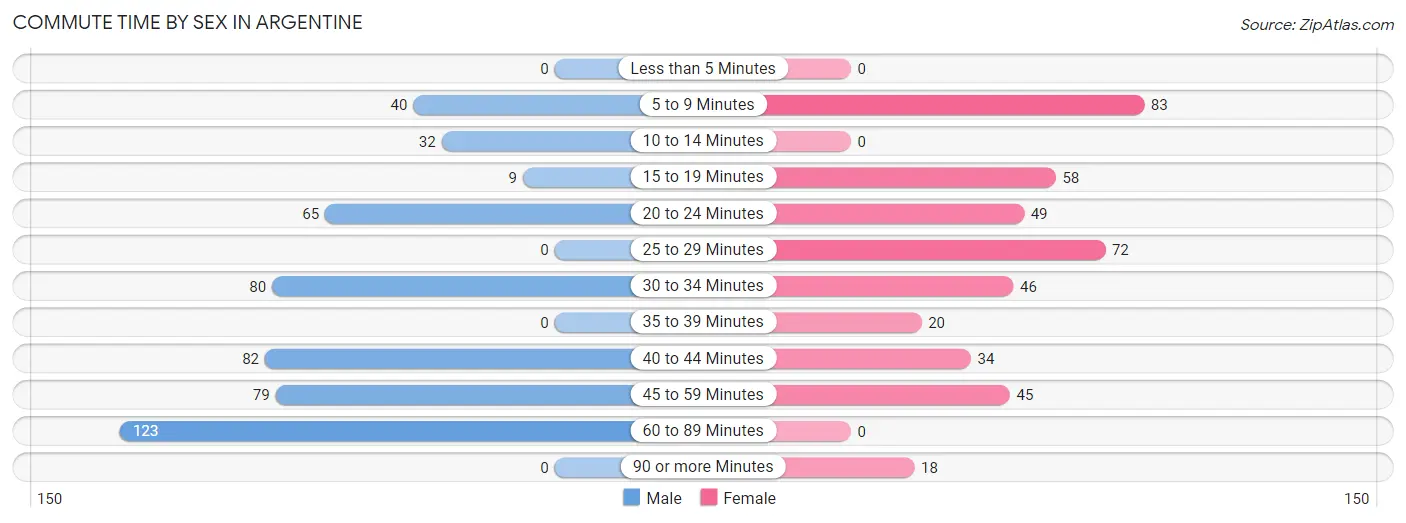
| Commute Time | Male | Female |
| Less than 5 Minutes | 0 (0.0%) | 0 (0.0%) |
| 5 to 9 Minutes | 40 (7.8%) | 83 (19.5%) |
| 10 to 14 Minutes | 32 (6.3%) | 0 (0.0%) |
| 15 to 19 Minutes | 9 (1.8%) | 58 (13.7%) |
| 20 to 24 Minutes | 65 (12.8%) | 49 (11.5%) |
| 25 to 29 Minutes | 0 (0.0%) | 72 (16.9%) |
| 30 to 34 Minutes | 80 (15.7%) | 46 (10.8%) |
| 35 to 39 Minutes | 0 (0.0%) | 20 (4.7%) |
| 40 to 44 Minutes | 82 (16.1%) | 34 (8.0%) |
| 45 to 59 Minutes | 79 (15.5%) | 45 (10.6%) |
| 60 to 89 Minutes | 123 (24.1%) | 0 (0.0%) |
| 90 or more Minutes | 0 (0.0%) | 18 (4.2%) |
Time of Departure to Work by Sex in Argentine
The most frequent times of departure to work in Argentine are 12:00 AM to 4:59 AM (89, 17.4%) for males and 8:00 AM to 8:29 AM (70, 16.5%) for females.
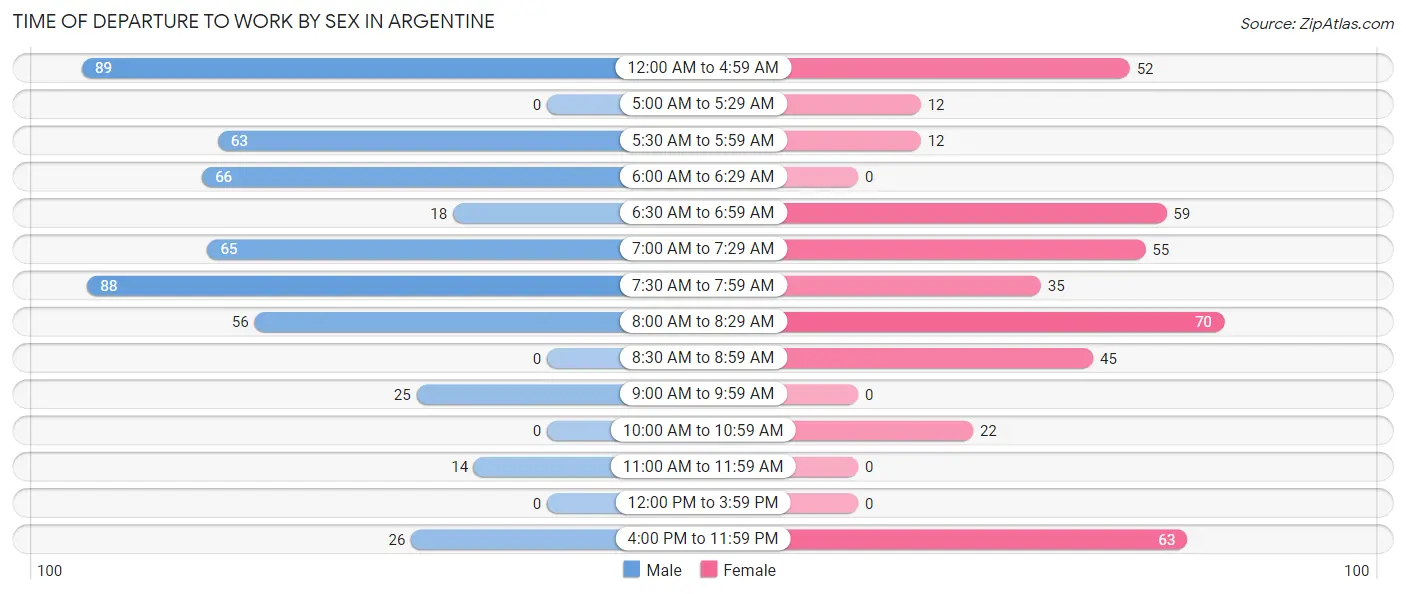
| Time of Departure | Male | Female |
| 12:00 AM to 4:59 AM | 89 (17.4%) | 52 (12.2%) |
| 5:00 AM to 5:29 AM | 0 (0.0%) | 12 (2.8%) |
| 5:30 AM to 5:59 AM | 63 (12.3%) | 12 (2.8%) |
| 6:00 AM to 6:29 AM | 66 (12.9%) | 0 (0.0%) |
| 6:30 AM to 6:59 AM | 18 (3.5%) | 59 (13.9%) |
| 7:00 AM to 7:29 AM | 65 (12.8%) | 55 (12.9%) |
| 7:30 AM to 7:59 AM | 88 (17.2%) | 35 (8.2%) |
| 8:00 AM to 8:29 AM | 56 (11.0%) | 70 (16.5%) |
| 8:30 AM to 8:59 AM | 0 (0.0%) | 45 (10.6%) |
| 9:00 AM to 9:59 AM | 25 (4.9%) | 0 (0.0%) |
| 10:00 AM to 10:59 AM | 0 (0.0%) | 22 (5.2%) |
| 11:00 AM to 11:59 AM | 14 (2.8%) | 0 (0.0%) |
| 12:00 PM to 3:59 PM | 0 (0.0%) | 0 (0.0%) |
| 4:00 PM to 11:59 PM | 26 (5.1%) | 63 (14.8%) |
| Total | 510 (100.0%) | 425 (100.0%) |
Housing Occupancy in Argentine
Occupancy by Ownership in Argentine
Of the total 968 dwellings in Argentine, owner-occupied units account for 848 (87.6%), while renter-occupied units make up 120 (12.4%).
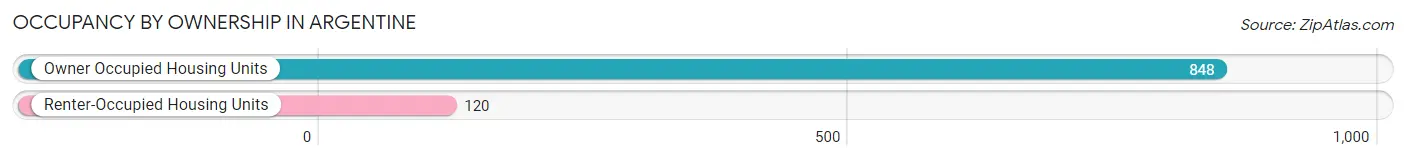
| Occupancy | # Housing Units | % Housing Units |
| Owner Occupied Housing Units | 848 | 87.6% |
| Renter-Occupied Housing Units | 120 | 12.4% |
| Total Occupied Housing Units | 968 | 100.0% |
Occupancy by Household Size in Argentine
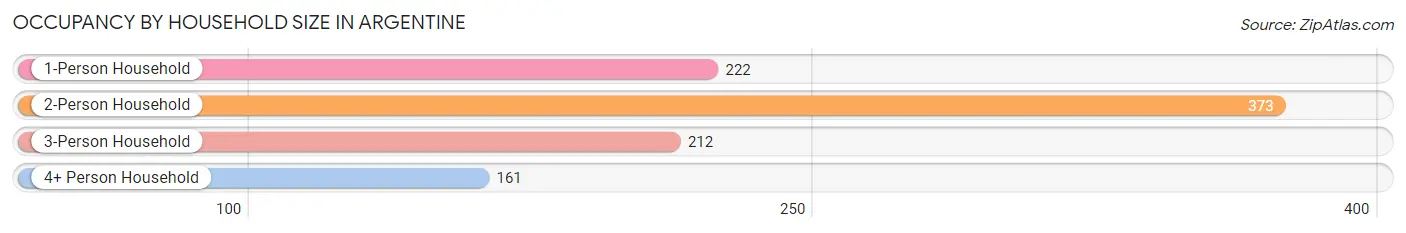
| Household Size | # Housing Units | % Housing Units |
| 1-Person Household | 222 | 22.9% |
| 2-Person Household | 373 | 38.5% |
| 3-Person Household | 212 | 21.9% |
| 4+ Person Household | 161 | 16.6% |
| Total Housing Units | 968 | 100.0% |
Occupancy by Ownership by Household Size in Argentine
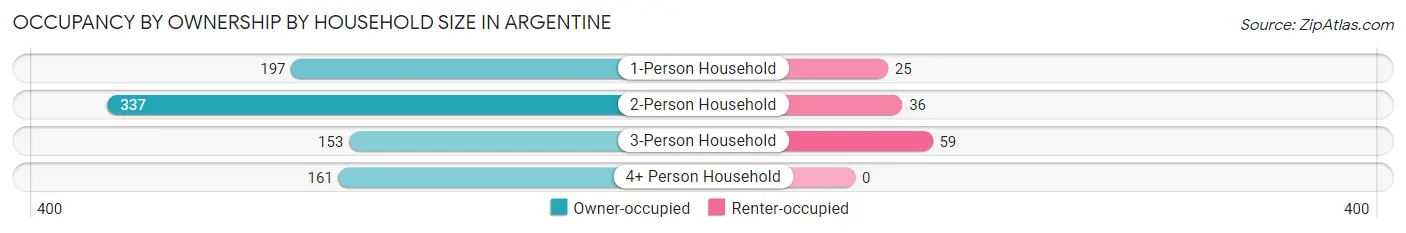
| Household Size | Owner-occupied | Renter-occupied |
| 1-Person Household | 197 (88.7%) | 25 (11.3%) |
| 2-Person Household | 337 (90.3%) | 36 (9.7%) |
| 3-Person Household | 153 (72.2%) | 59 (27.8%) |
| 4+ Person Household | 161 (100.0%) | 0 (0.0%) |
| Total Housing Units | 848 (87.6%) | 120 (12.4%) |
Occupancy by Educational Attainment in Argentine
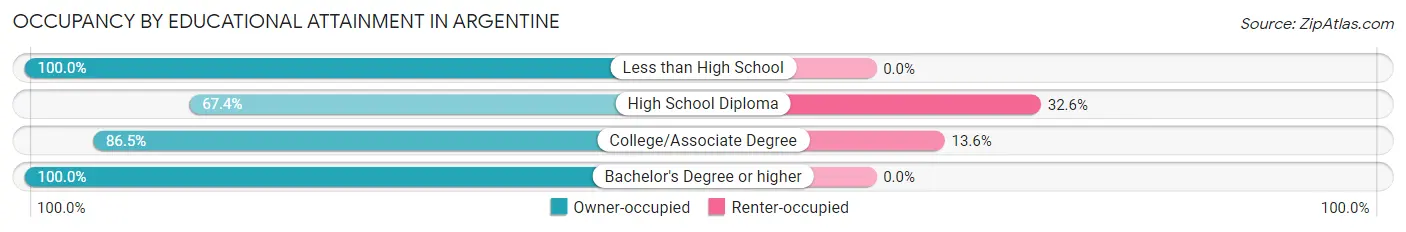
| Household Size | Owner-occupied | Renter-occupied |
| Less than High School | 37 (100.0%) | 0 (0.0%) |
| High School Diploma | 161 (67.4%) | 78 (32.6%) |
| College/Associate Degree | 268 (86.5%) | 42 (13.6%) |
| Bachelor's Degree or higher | 382 (100.0%) | 0 (0.0%) |
Occupancy by Age of Householder in Argentine
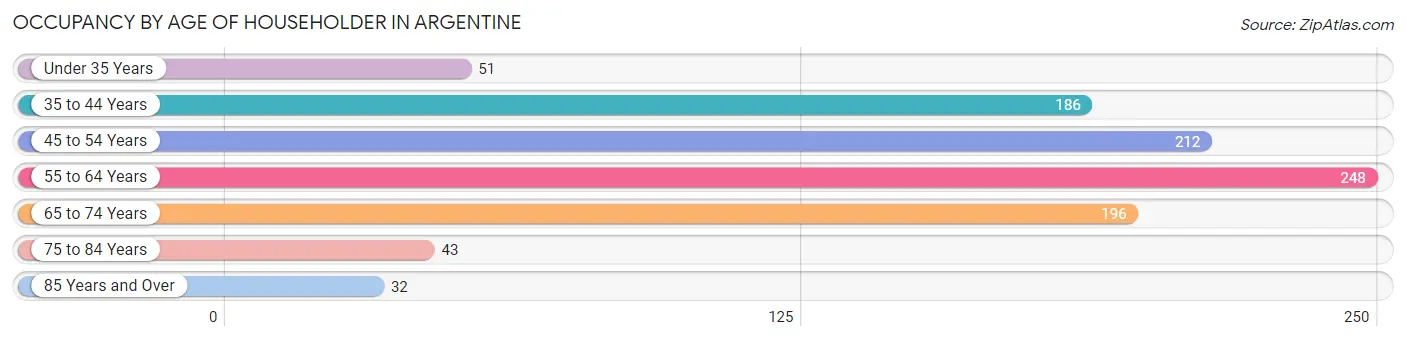
| Age Bracket | # Households | % Households |
| Under 35 Years | 51 | 5.3% |
| 35 to 44 Years | 186 | 19.2% |
| 45 to 54 Years | 212 | 21.9% |
| 55 to 64 Years | 248 | 25.6% |
| 65 to 74 Years | 196 | 20.3% |
| 75 to 84 Years | 43 | 4.4% |
| 85 Years and Over | 32 | 3.3% |
| Total | 968 | 100.0% |
Housing Finances in Argentine
Median Income by Occupancy in Argentine
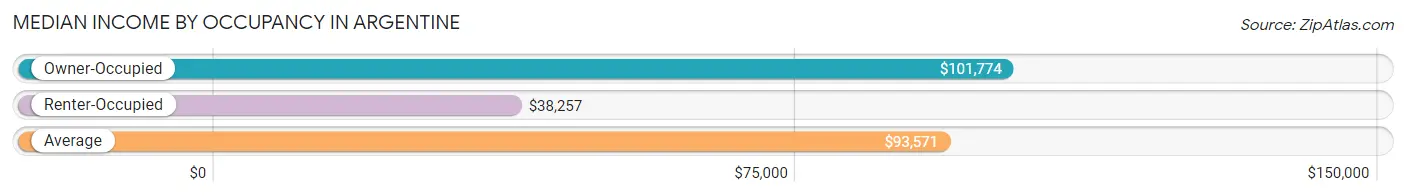
| Occupancy Type | # Households | Median Income |
| Owner-Occupied | 848 (87.6%) | $101,774 |
| Renter-Occupied | 120 (12.4%) | $38,257 |
| Average | 968 (100.0%) | $93,571 |
Occupancy by Householder Income Bracket in Argentine
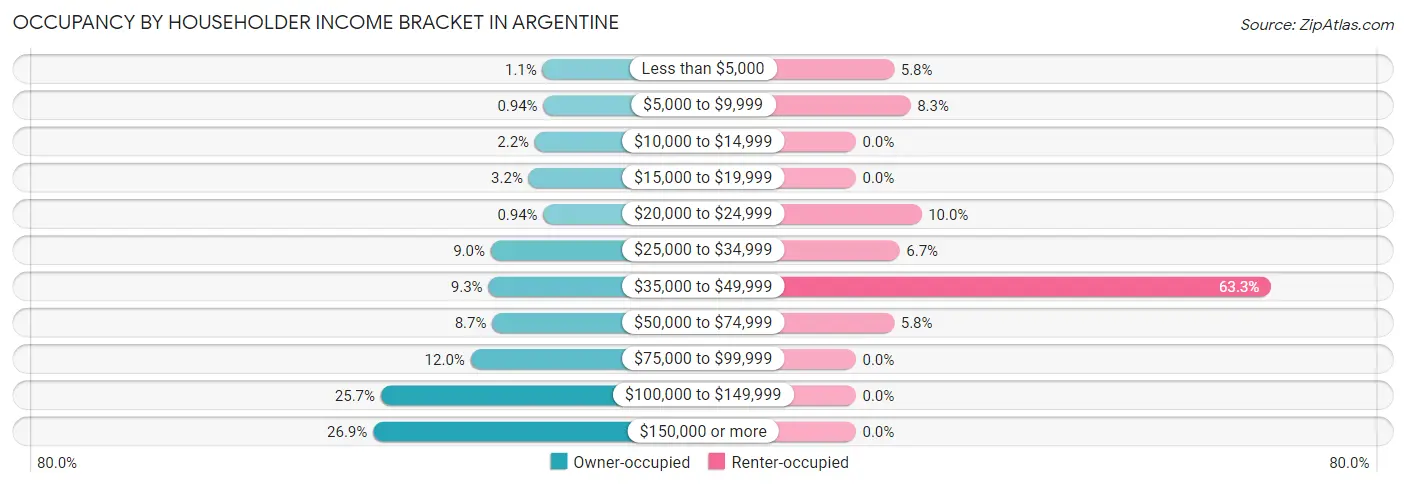
| Income Bracket | Owner-occupied | Renter-occupied |
| Less than $5,000 | 9 (1.1%) | 7 (5.8%) |
| $5,000 to $9,999 | 8 (0.9%) | 10 (8.3%) |
| $10,000 to $14,999 | 19 (2.2%) | 0 (0.0%) |
| $15,000 to $19,999 | 27 (3.2%) | 0 (0.0%) |
| $20,000 to $24,999 | 8 (0.9%) | 12 (10.0%) |
| $25,000 to $34,999 | 76 (9.0%) | 8 (6.7%) |
| $35,000 to $49,999 | 79 (9.3%) | 76 (63.3%) |
| $50,000 to $74,999 | 74 (8.7%) | 7 (5.8%) |
| $75,000 to $99,999 | 102 (12.0%) | 0 (0.0%) |
| $100,000 to $149,999 | 218 (25.7%) | 0 (0.0%) |
| $150,000 or more | 228 (26.9%) | 0 (0.0%) |
| Total | 848 (100.0%) | 120 (100.0%) |
Monthly Housing Cost Tiers in Argentine
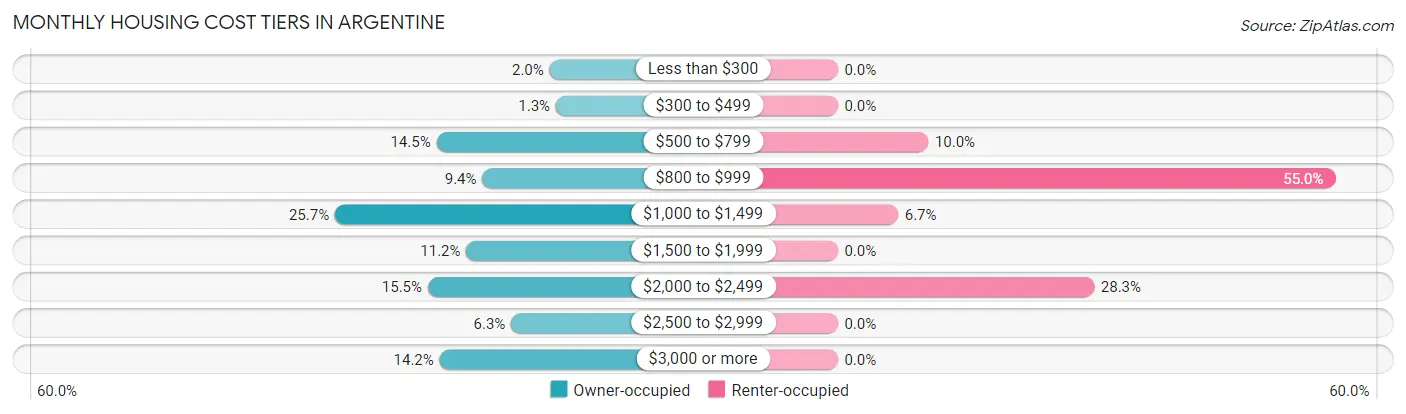
| Monthly Cost | Owner-occupied | Renter-occupied |
| Less than $300 | 17 (2.0%) | 0 (0.0%) |
| $300 to $499 | 11 (1.3%) | 0 (0.0%) |
| $500 to $799 | 123 (14.5%) | 12 (10.0%) |
| $800 to $999 | 80 (9.4%) | 66 (55.0%) |
| $1,000 to $1,499 | 218 (25.7%) | 8 (6.7%) |
| $1,500 to $1,999 | 95 (11.2%) | 0 (0.0%) |
| $2,000 to $2,499 | 131 (15.4%) | 34 (28.3%) |
| $2,500 to $2,999 | 53 (6.2%) | 0 (0.0%) |
| $3,000 or more | 120 (14.1%) | 0 (0.0%) |
| Total | 848 (100.0%) | 120 (100.0%) |
Physical Housing Characteristics in Argentine
Housing Structures in Argentine
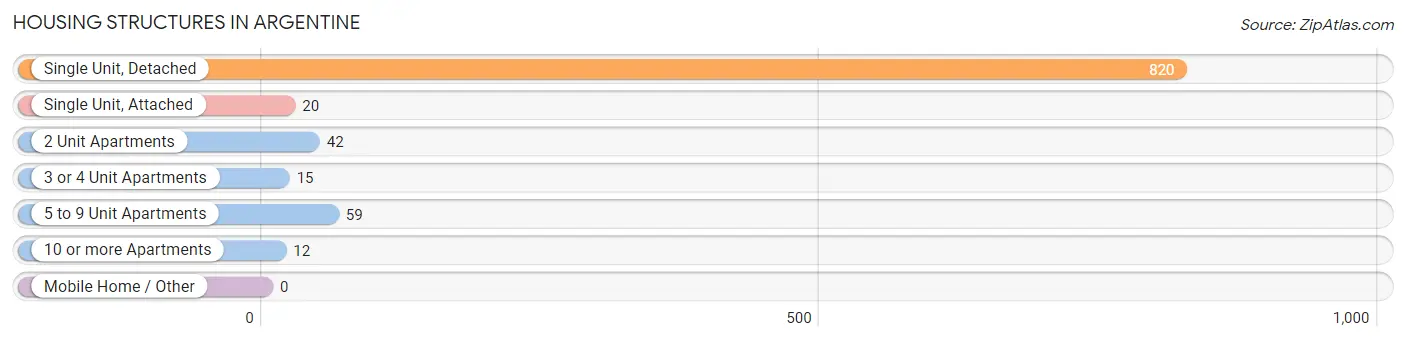
| Structure Type | # Housing Units | % Housing Units |
| Single Unit, Detached | 820 | 84.7% |
| Single Unit, Attached | 20 | 2.1% |
| 2 Unit Apartments | 42 | 4.3% |
| 3 or 4 Unit Apartments | 15 | 1.5% |
| 5 to 9 Unit Apartments | 59 | 6.1% |
| 10 or more Apartments | 12 | 1.2% |
| Mobile Home / Other | 0 | 0.0% |
| Total | 968 | 100.0% |
Housing Structures by Occupancy in Argentine
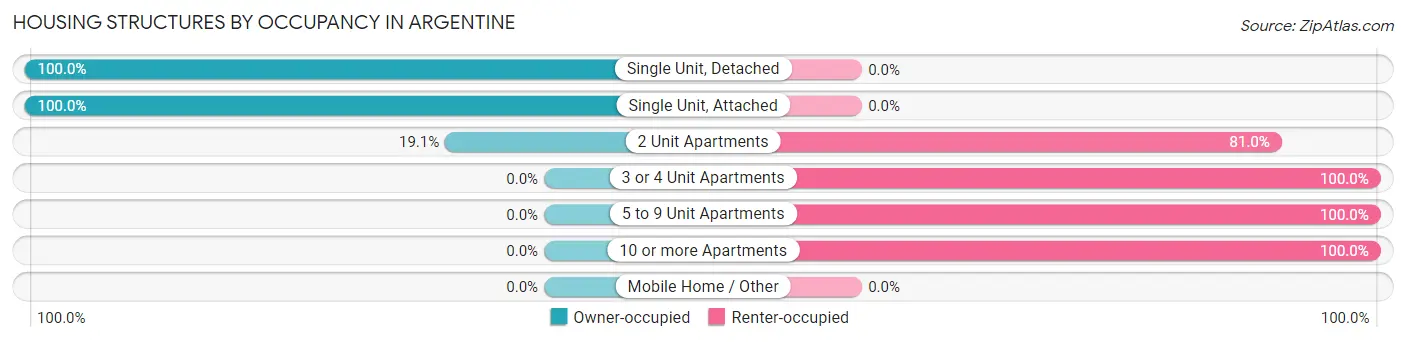
| Structure Type | Owner-occupied | Renter-occupied |
| Single Unit, Detached | 820 (100.0%) | 0 (0.0%) |
| Single Unit, Attached | 20 (100.0%) | 0 (0.0%) |
| 2 Unit Apartments | 8 (19.1%) | 34 (80.9%) |
| 3 or 4 Unit Apartments | 0 (0.0%) | 15 (100.0%) |
| 5 to 9 Unit Apartments | 0 (0.0%) | 59 (100.0%) |
| 10 or more Apartments | 0 (0.0%) | 12 (100.0%) |
| Mobile Home / Other | 0 (0.0%) | 0 (0.0%) |
| Total | 848 (87.6%) | 120 (12.4%) |
Housing Structures by Number of Rooms in Argentine
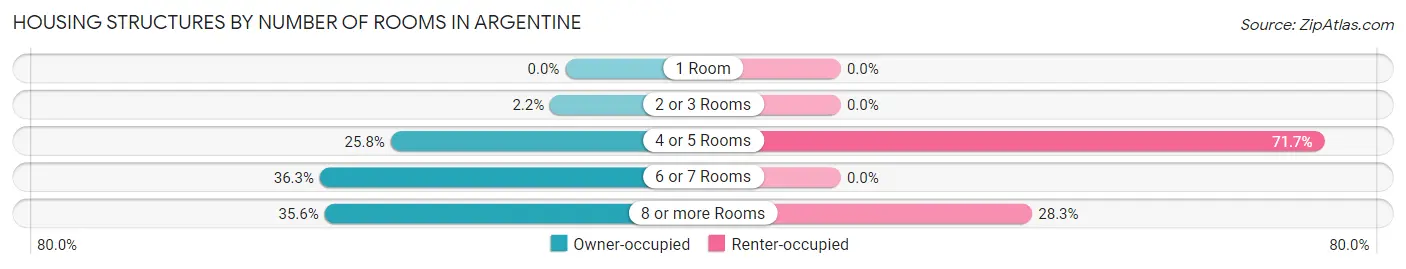
| Number of Rooms | Owner-occupied | Renter-occupied |
| 1 Room | 0 (0.0%) | 0 (0.0%) |
| 2 or 3 Rooms | 19 (2.2%) | 0 (0.0%) |
| 4 or 5 Rooms | 219 (25.8%) | 86 (71.7%) |
| 6 or 7 Rooms | 308 (36.3%) | 0 (0.0%) |
| 8 or more Rooms | 302 (35.6%) | 34 (28.3%) |
| Total | 848 (100.0%) | 120 (100.0%) |
Housing Structure by Heating Type in Argentine
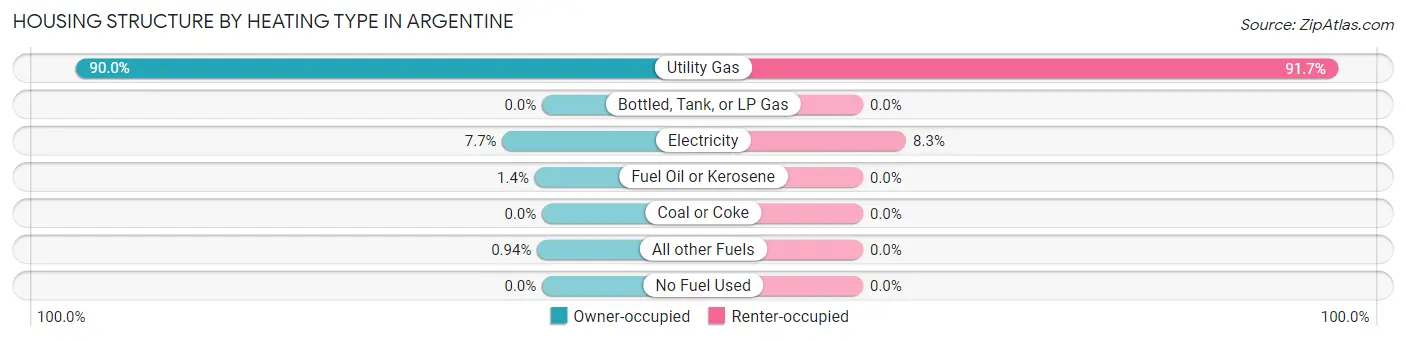
| Heating Type | Owner-occupied | Renter-occupied |
| Utility Gas | 763 (90.0%) | 110 (91.7%) |
| Bottled, Tank, or LP Gas | 0 (0.0%) | 0 (0.0%) |
| Electricity | 65 (7.7%) | 10 (8.3%) |
| Fuel Oil or Kerosene | 12 (1.4%) | 0 (0.0%) |
| Coal or Coke | 0 (0.0%) | 0 (0.0%) |
| All other Fuels | 8 (0.9%) | 0 (0.0%) |
| No Fuel Used | 0 (0.0%) | 0 (0.0%) |
| Total | 848 (100.0%) | 120 (100.0%) |
Household Vehicle Usage in Argentine
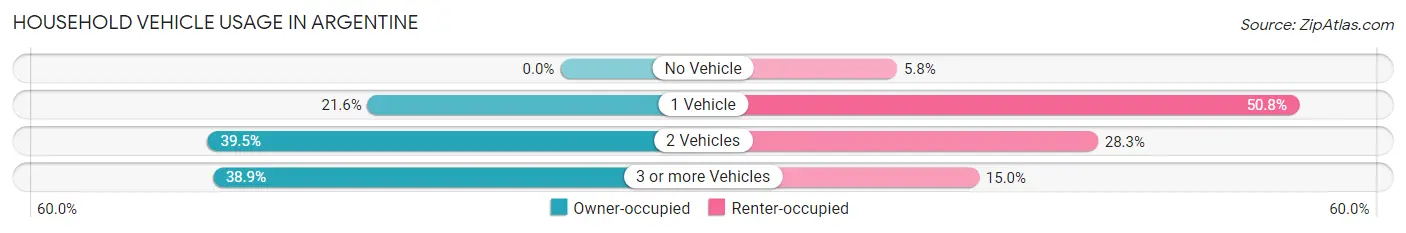
| Vehicles per Household | Owner-occupied | Renter-occupied |
| No Vehicle | 0 (0.0%) | 7 (5.8%) |
| 1 Vehicle | 183 (21.6%) | 61 (50.8%) |
| 2 Vehicles | 335 (39.5%) | 34 (28.3%) |
| 3 or more Vehicles | 330 (38.9%) | 18 (15.0%) |
| Total | 848 (100.0%) | 120 (100.0%) |
Real Estate & Mortgages in Argentine
Real Estate and Mortgage Overview in Argentine
| Characteristic | Without Mortgage | With Mortgage |
| Housing Units | 226 | 622 |
| Median Property Value | $330,000 | $314,600 |
| Median Household Income | - | - |
| Monthly Housing Costs | $712 | $120 |
| Real Estate Taxes | $3,973 | $0 |
Property Value by Mortgage Status in Argentine
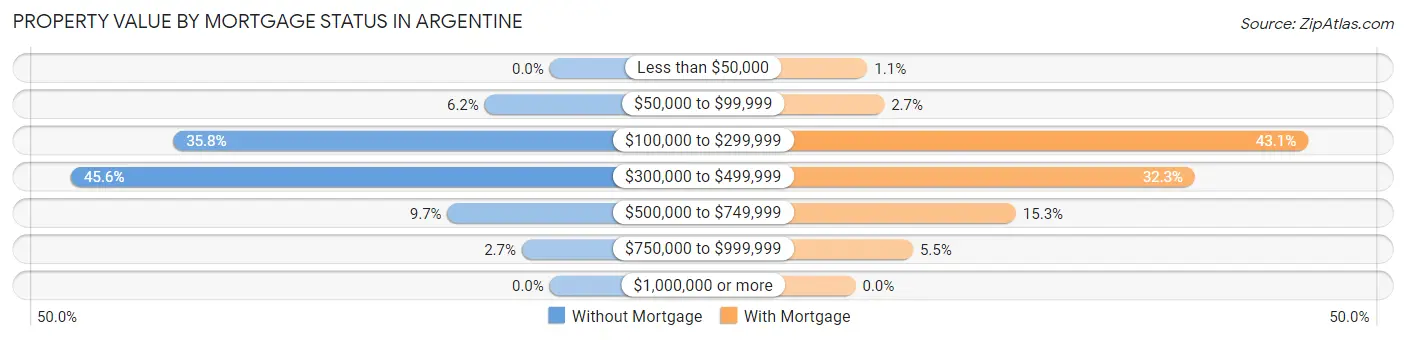
| Property Value | Without Mortgage | With Mortgage |
| Less than $50,000 | 0 (0.0%) | 7 (1.1%) |
| $50,000 to $99,999 | 14 (6.2%) | 17 (2.7%) |
| $100,000 to $299,999 | 81 (35.8%) | 268 (43.1%) |
| $300,000 to $499,999 | 103 (45.6%) | 201 (32.3%) |
| $500,000 to $749,999 | 22 (9.7%) | 95 (15.3%) |
| $750,000 to $999,999 | 6 (2.6%) | 34 (5.5%) |
| $1,000,000 or more | 0 (0.0%) | 0 (0.0%) |
| Total | 226 (100.0%) | 622 (100.0%) |
Household Income by Mortgage Status in Argentine
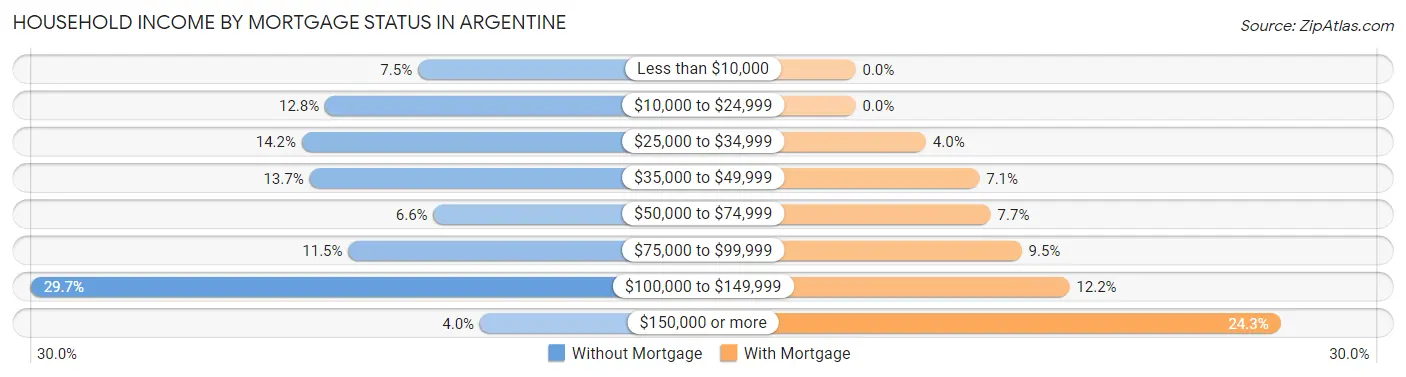
| Household Income | Without Mortgage | With Mortgage |
| Less than $10,000 | 17 (7.5%) | 0 (0.0%) |
| $10,000 to $24,999 | 29 (12.8%) | 0 (0.0%) |
| $25,000 to $34,999 | 32 (14.2%) | 25 (4.0%) |
| $35,000 to $49,999 | 31 (13.7%) | 44 (7.1%) |
| $50,000 to $74,999 | 15 (6.6%) | 48 (7.7%) |
| $75,000 to $99,999 | 26 (11.5%) | 59 (9.5%) |
| $100,000 to $149,999 | 67 (29.6%) | 76 (12.2%) |
| $150,000 or more | 9 (4.0%) | 151 (24.3%) |
| Total | 226 (100.0%) | 622 (100.0%) |
Property Value to Household Income Ratio in Argentine
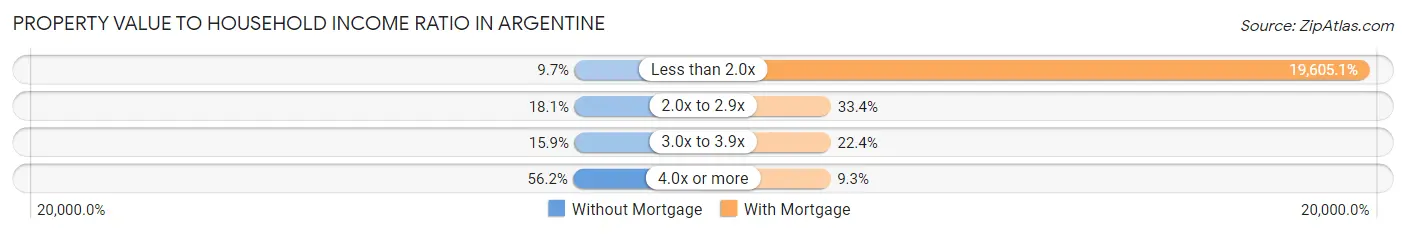
| Value-to-Income Ratio | Without Mortgage | With Mortgage |
| Less than 2.0x | 22 (9.7%) | 121,944 (19,605.1%) |
| 2.0x to 2.9x | 41 (18.1%) | 208 (33.4%) |
| 3.0x to 3.9x | 36 (15.9%) | 139 (22.4%) |
| 4.0x or more | 127 (56.2%) | 58 (9.3%) |
| Total | 226 (100.0%) | 622 (100.0%) |
Real Estate Taxes by Mortgage Status in Argentine
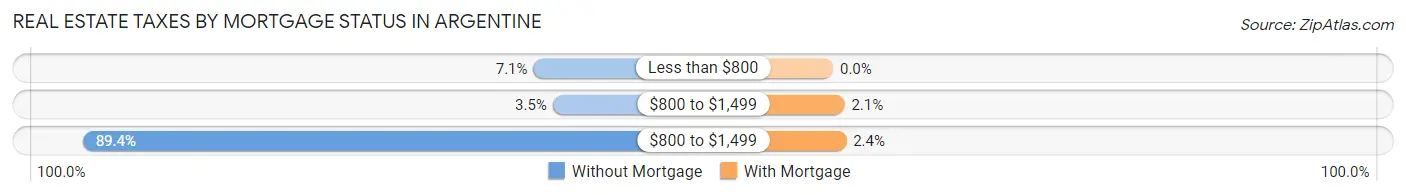
| Property Taxes | Without Mortgage | With Mortgage |
| Less than $800 | 16 (7.1%) | 0 (0.0%) |
| $800 to $1,499 | 8 (3.5%) | 13 (2.1%) |
| $800 to $1,499 | 202 (89.4%) | 15 (2.4%) |
| Total | 226 (100.0%) | 622 (100.0%) |
Health & Disability in Argentine
Health Insurance Coverage by Age in Argentine
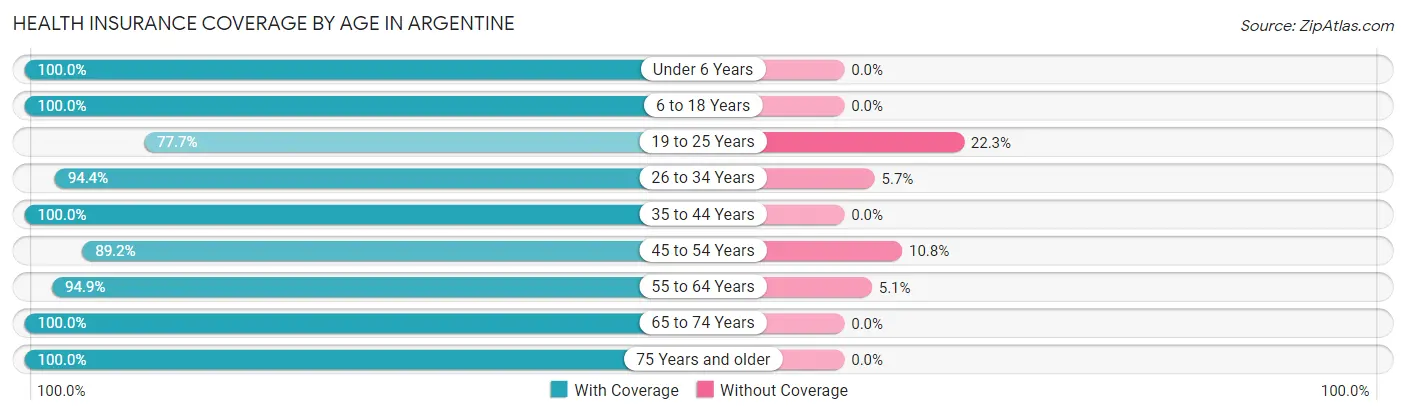
| Age Bracket | With Coverage | Without Coverage |
| Under 6 Years | 102 (100.0%) | 0 (0.0%) |
| 6 to 18 Years | 402 (100.0%) | 0 (0.0%) |
| 19 to 25 Years | 108 (77.7%) | 31 (22.3%) |
| 26 to 34 Years | 167 (94.4%) | 10 (5.7%) |
| 35 to 44 Years | 316 (100.0%) | 0 (0.0%) |
| 45 to 54 Years | 323 (89.2%) | 39 (10.8%) |
| 55 to 64 Years | 388 (94.9%) | 21 (5.1%) |
| 65 to 74 Years | 349 (100.0%) | 0 (0.0%) |
| 75 Years and older | 150 (100.0%) | 0 (0.0%) |
| Total | 2,305 (95.8%) | 101 (4.2%) |
Health Insurance Coverage by Citizenship Status in Argentine
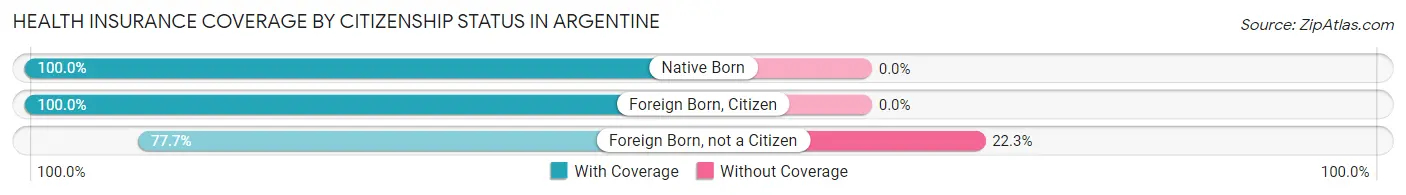
| Citizenship Status | With Coverage | Without Coverage |
| Native Born | 102 (100.0%) | 0 (0.0%) |
| Foreign Born, Citizen | 402 (100.0%) | 0 (0.0%) |
| Foreign Born, not a Citizen | 108 (77.7%) | 31 (22.3%) |
Health Insurance Coverage by Household Income in Argentine
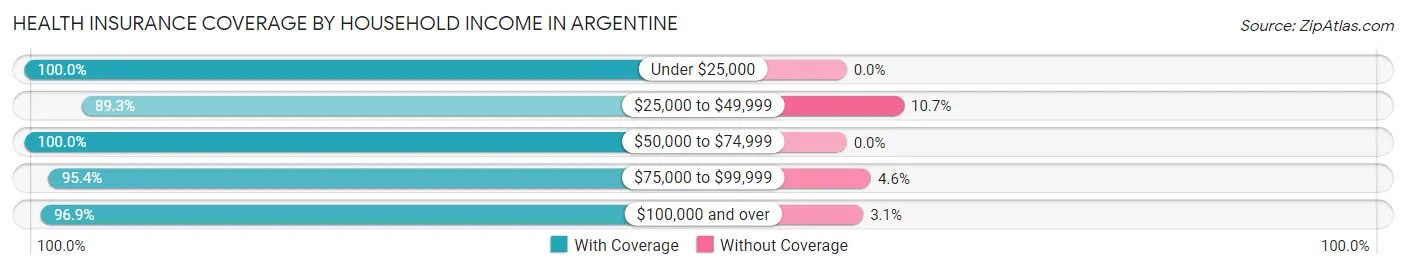
| Household Income | With Coverage | Without Coverage |
| Under $25,000 | 164 (100.0%) | 0 (0.0%) |
| $25,000 to $49,999 | 408 (89.3%) | 49 (10.7%) |
| $50,000 to $74,999 | 212 (100.0%) | 0 (0.0%) |
| $75,000 to $99,999 | 230 (95.4%) | 11 (4.6%) |
| $100,000 and over | 1,291 (96.9%) | 41 (3.1%) |
Public vs Private Health Insurance Coverage by Age in Argentine
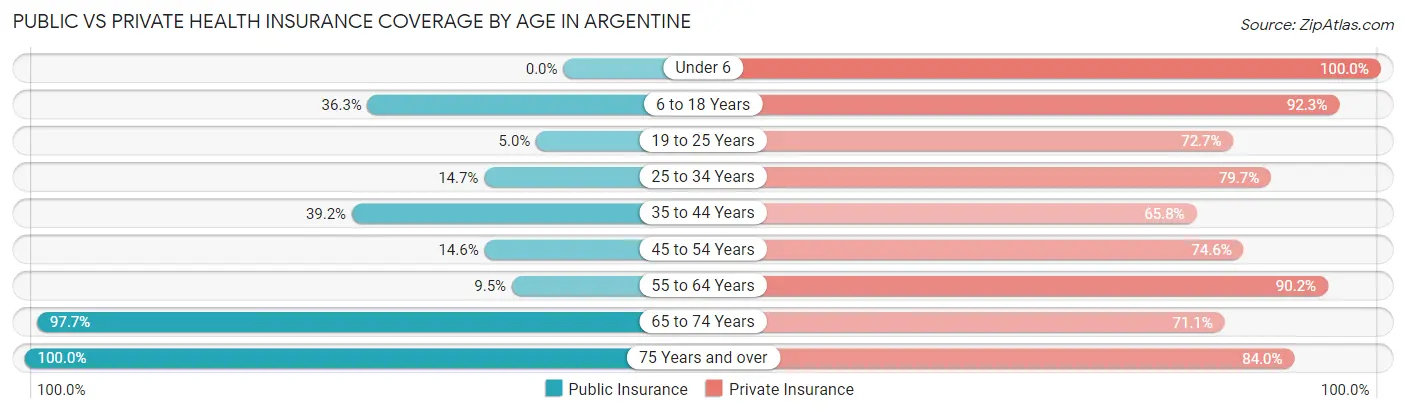
| Age Bracket | Public Insurance | Private Insurance |
| Under 6 | 0 (0.0%) | 102 (100.0%) |
| 6 to 18 Years | 146 (36.3%) | 371 (92.3%) |
| 19 to 25 Years | 7 (5.0%) | 101 (72.7%) |
| 25 to 34 Years | 26 (14.7%) | 141 (79.7%) |
| 35 to 44 Years | 124 (39.2%) | 208 (65.8%) |
| 45 to 54 Years | 53 (14.6%) | 270 (74.6%) |
| 55 to 64 Years | 39 (9.5%) | 369 (90.2%) |
| 65 to 74 Years | 341 (97.7%) | 248 (71.1%) |
| 75 Years and over | 150 (100.0%) | 126 (84.0%) |
| Total | 886 (36.8%) | 1,936 (80.5%) |
Disability Status by Sex by Age in Argentine
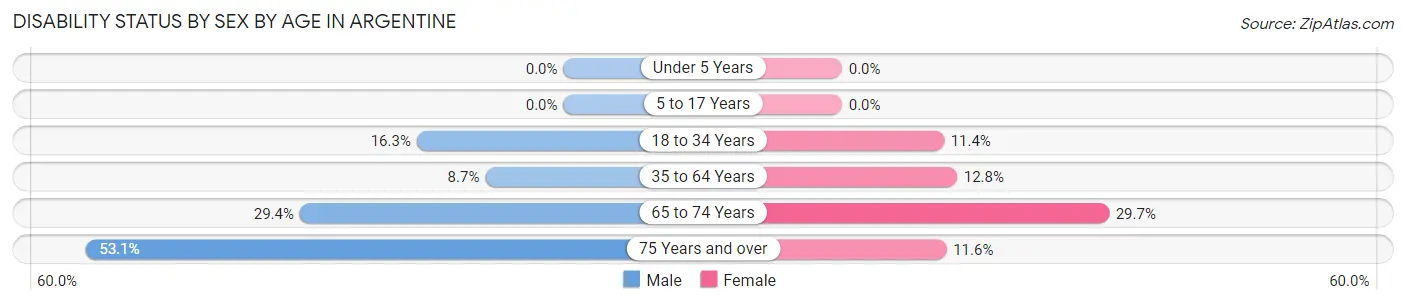
| Age Bracket | Male | Female |
| Under 5 Years | 0 (0.0%) | 0 (0.0%) |
| 5 to 17 Years | 0 (0.0%) | 0 (0.0%) |
| 18 to 34 Years | 32 (16.3%) | 16 (11.4%) |
| 35 to 64 Years | 45 (8.7%) | 73 (12.8%) |
| 65 to 74 Years | 59 (29.3%) | 44 (29.7%) |
| 75 Years and over | 34 (53.1%) | 10 (11.6%) |
Disability Class by Sex by Age in Argentine
Disability Class: Hearing Difficulty
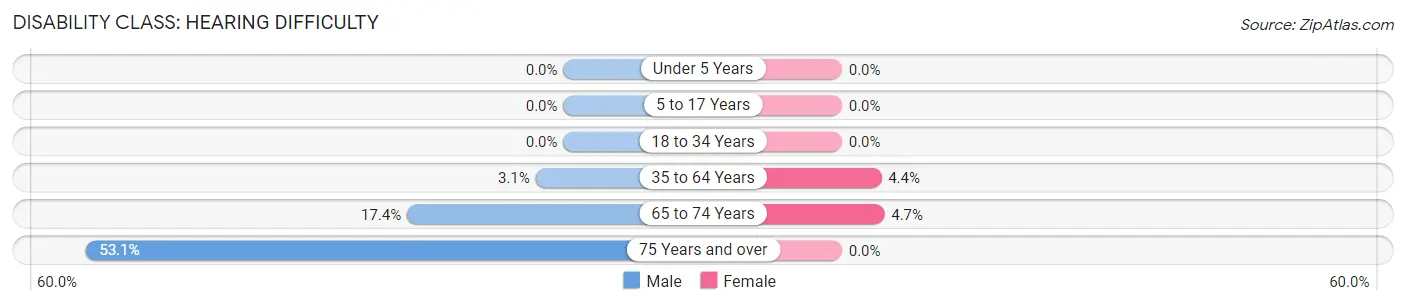
| Age Bracket | Male | Female |
| Under 5 Years | 0 (0.0%) | 0 (0.0%) |
| 5 to 17 Years | 0 (0.0%) | 0 (0.0%) |
| 18 to 34 Years | 0 (0.0%) | 0 (0.0%) |
| 35 to 64 Years | 16 (3.1%) | 25 (4.4%) |
| 65 to 74 Years | 35 (17.4%) | 7 (4.7%) |
| 75 Years and over | 34 (53.1%) | 0 (0.0%) |
Disability Class: Vision Difficulty
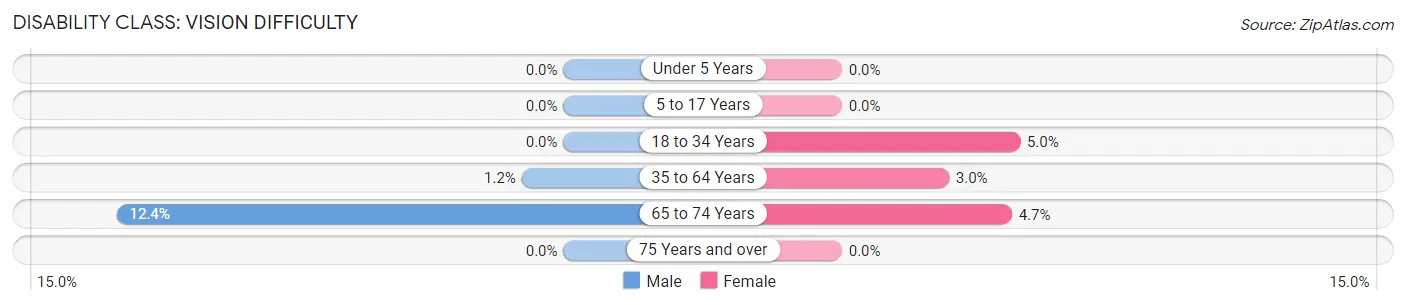
| Age Bracket | Male | Female |
| Under 5 Years | 0 (0.0%) | 0 (0.0%) |
| 5 to 17 Years | 0 (0.0%) | 0 (0.0%) |
| 18 to 34 Years | 0 (0.0%) | 7 (5.0%) |
| 35 to 64 Years | 6 (1.2%) | 17 (3.0%) |
| 65 to 74 Years | 25 (12.4%) | 7 (4.7%) |
| 75 Years and over | 0 (0.0%) | 0 (0.0%) |
Disability Class: Cognitive Difficulty
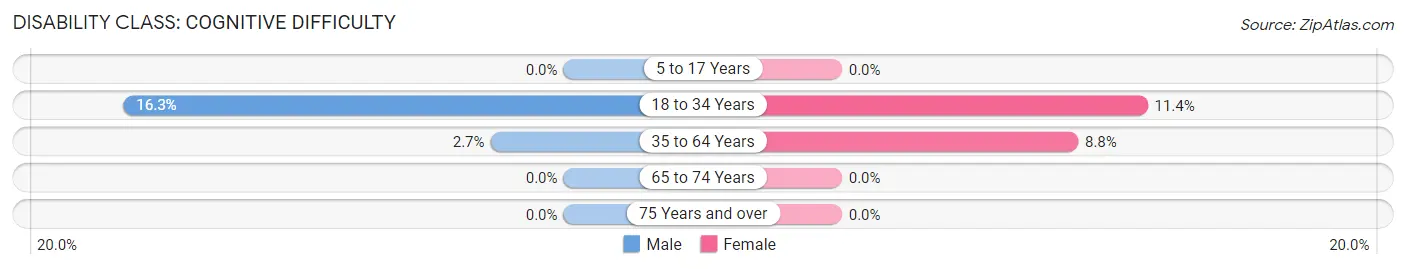
| Age Bracket | Male | Female |
| 5 to 17 Years | 0 (0.0%) | 0 (0.0%) |
| 18 to 34 Years | 32 (16.3%) | 16 (11.4%) |
| 35 to 64 Years | 14 (2.7%) | 50 (8.8%) |
| 65 to 74 Years | 0 (0.0%) | 0 (0.0%) |
| 75 Years and over | 0 (0.0%) | 0 (0.0%) |
Disability Class: Ambulatory Difficulty
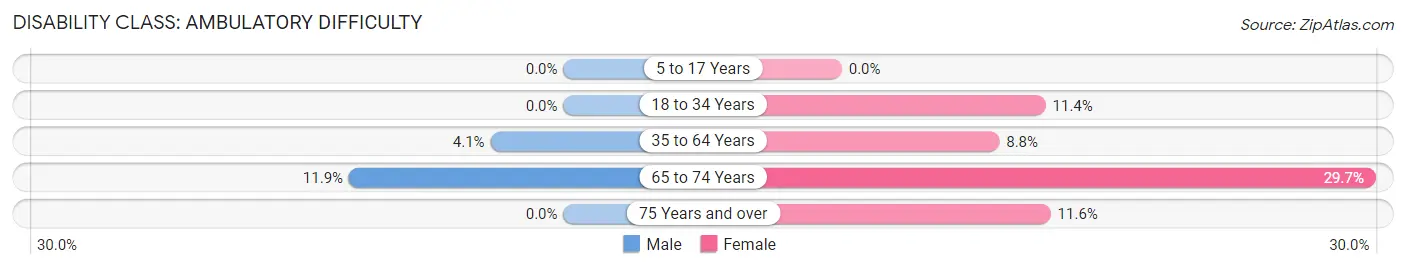
| Age Bracket | Male | Female |
| 5 to 17 Years | 0 (0.0%) | 0 (0.0%) |
| 18 to 34 Years | 0 (0.0%) | 16 (11.4%) |
| 35 to 64 Years | 21 (4.1%) | 50 (8.8%) |
| 65 to 74 Years | 24 (11.9%) | 44 (29.7%) |
| 75 Years and over | 0 (0.0%) | 10 (11.6%) |
Disability Class: Self-Care Difficulty
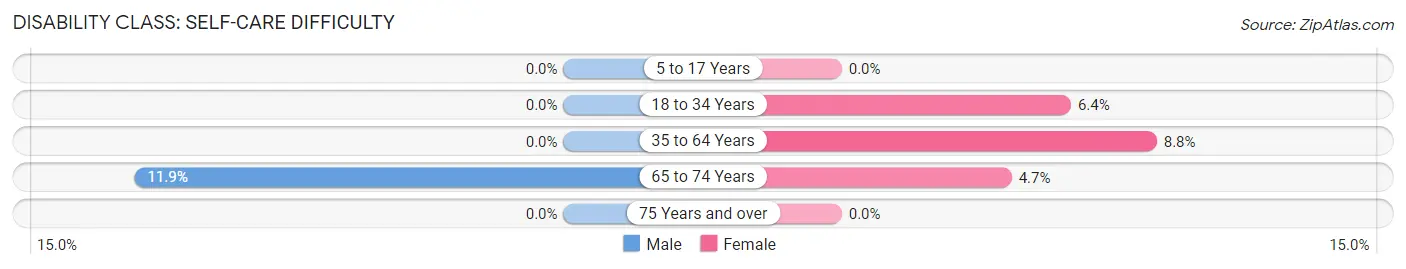
| Age Bracket | Male | Female |
| 5 to 17 Years | 0 (0.0%) | 0 (0.0%) |
| 18 to 34 Years | 0 (0.0%) | 9 (6.4%) |
| 35 to 64 Years | 0 (0.0%) | 50 (8.8%) |
| 65 to 74 Years | 24 (11.9%) | 7 (4.7%) |
| 75 Years and over | 0 (0.0%) | 0 (0.0%) |
Technology Access in Argentine
Computing Device Access in Argentine
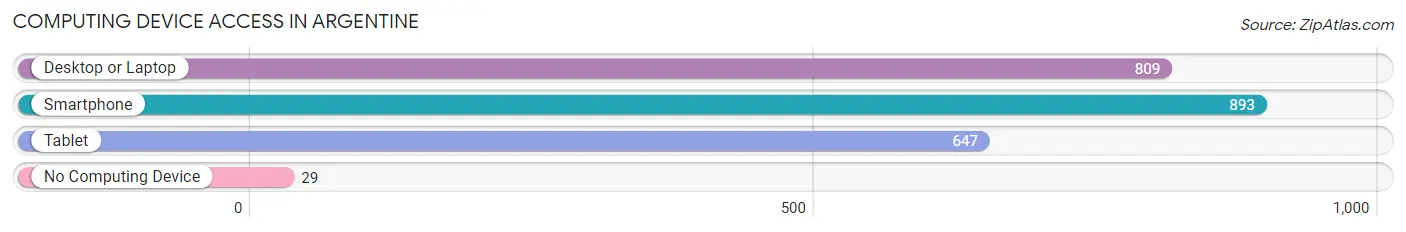
| Device Type | # Households | % Households |
| Desktop or Laptop | 809 | 83.6% |
| Smartphone | 893 | 92.2% |
| Tablet | 647 | 66.8% |
| No Computing Device | 29 | 3.0% |
| Total | 968 | 100.0% |
Internet Access in Argentine
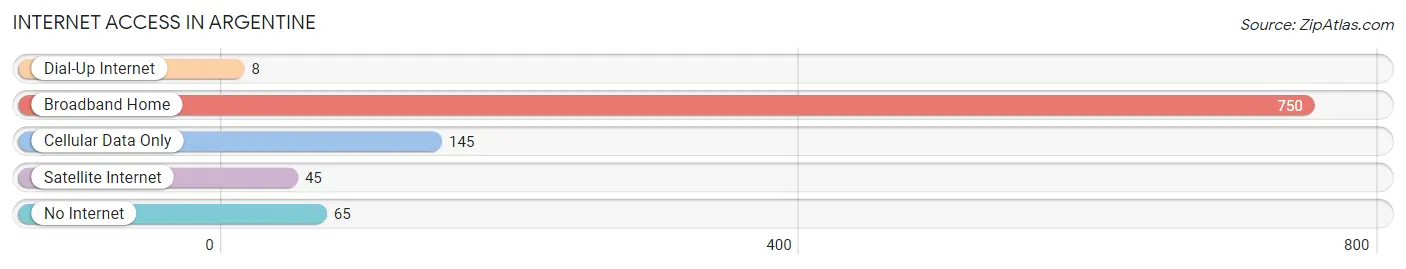
| Internet Type | # Households | % Households |
| Dial-Up Internet | 8 | 0.8% |
| Broadband Home | 750 | 77.5% |
| Cellular Data Only | 145 | 15.0% |
| Satellite Internet | 45 | 4.6% |
| No Internet | 65 | 6.7% |
| Total | 968 | 100.0% |
Argentine Summary
Argentine is a small unincorporated community located in Genesee County, Michigan. It is situated in the northeast corner of the county, just south of the city of Flint. The community is bordered by the cities of Grand Blanc and Burton, as well as the townships of Mundy and Atlas.
History
Argentine was first settled in 1836 by a group of settlers from New York. The settlement was originally known as "New York Corners" due to the large number of New Yorkers who had moved to the area. The name was changed to Argentine in 1845, after the Argentine Republic, which had recently declared its independence from Spain.
The first post office in the area was established in 1848, and the first school was built in 1851. The first church was built in 1853, and the first newspaper, the Argentine Gazette, was established in 1854.
The community grew steadily throughout the 19th century, and by the turn of the century, it had become a thriving agricultural and industrial center. The population peaked in 1910, when it reached 1,845.
Geography
Argentine is located in the northeast corner of Genesee County, just south of the city of Flint. It is bordered by the cities of Grand Blanc and Burton, as well as the townships of Mundy and Atlas.
The community is situated on the banks of the Flint River, which flows through the area. The terrain is mostly flat, with some rolling hills in the northern part of the community.
Economy
Argentine has a diverse economy, with a mix of agricultural, industrial, and commercial businesses. The largest employers in the area are the local school district, the Genesee County government, and the Genesee County Health Department.
Agriculture is still an important part of the local economy, with many local farms producing corn, soybeans, wheat, and other crops. There are also several small businesses in the area, including restaurants, retail stores, and auto repair shops.
Demographics
As of the 2010 census, the population of Argentine was 1,717. The racial makeup of the community was 94.3% White, 2.2% African American, 0.7% Native American, 0.3% Asian, 0.1% Pacific Islander, 0.7% from other races, and 1.7% from two or more races. Hispanic or Latino of any race were 2.2% of the population.
The median household income in Argentine was $45,938, and the median family income was $51,938. The per capita income was $20,938. About 8.3% of families and 10.2% of the population were below the poverty line, including 14.3% of those under age 18 and 5.2% of those age 65 or over.
Common Questions
What is Per Capita Income in Argentine?
Per Capita income in Argentine is $41,228.
What is the Median Family Income in Argentine?
Median Family Income in Argentine is $113,702.
What is the Median Household income in Argentine?
Median Household Income in Argentine is $93,571.
What is Income or Wage Gap in Argentine?
Income or Wage Gap in Argentine is 27.0%.
Women in Argentine earn 73.0 cents for every dollar earned by a man.
What is Inequality or Gini Index in Argentine?
Inequality or Gini Index in Argentine is 0.39.
What is the Total Population of Argentine?
Total Population of Argentine is 2,451.
What is the Total Male Population of Argentine?
Total Male Population of Argentine is 1,224.
What is the Total Female Population of Argentine?
Total Female Population of Argentine is 1,227.
What is the Ratio of Males per 100 Females in Argentine?
There are 99.76 Males per 100 Females in Argentine.
What is the Ratio of Females per 100 Males in Argentine?
There are 100.25 Females per 100 Males in Argentine.
What is the Median Population Age in Argentine?
Median Population Age in Argentine is 46.7 Years.
What is the Average Family Size in Argentine
Average Family Size in Argentine is 2.9 People.
What is the Average Household Size in Argentine
Average Household Size in Argentine is 2.5 People.
How Large is the Labor Force in Argentine?
There are 1,090 People in the Labor Forcein in Argentine.
What is the Percentage of People in the Labor Force in Argentine?
53.0% of People are in the Labor Force in Argentine.
What is the Unemployment Rate in Argentine?
Unemployment Rate in Argentine is 6.2%.