Lake Orion, MI Map & Demographics
Lake Orion Map
Lake Orion Overview
$49,695
PER CAPITA INCOME
$145,509
AVG FAMILY INCOME
$94,925
AVG HOUSEHOLD INCOME
45.6%
WAGE / INCOME GAP [ % ]
54.4¢/ $1
WAGE / INCOME GAP [ $ ]
0.46
INEQUALITY / GINI INDEX
2,915
TOTAL POPULATION
1,340
MALE POPULATION
1,575
FEMALE POPULATION
85.08
MALES / 100 FEMALES
117.54
FEMALES / 100 MALES
42.5
MEDIAN AGE
3.1
AVG FAMILY SIZE
2.3
AVG HOUSEHOLD SIZE
1,663
LABOR FORCE [ PEOPLE ]
67.5%
PERCENT IN LABOR FORCE
2.6%
UNEMPLOYMENT RATE
Lake Orion Area Codes
Income in Lake Orion
Income Overview in Lake Orion
Per Capita Income in Lake Orion is $49,695, while median incomes of families and households are $145,509 and $94,925 respectively.
| Characteristic | Number | Measure |
| Per Capita Income | 2,915 | $49,695 |
| Median Family Income | 677 | $145,509 |
| Mean Family Income | 677 | $163,140 |
| Median Household Income | 1,239 | $94,925 |
| Mean Household Income | 1,239 | $115,053 |
| Income Deficit | 677 | $0 |
| Wage / Income Gap (%) | 2,915 | 45.57% |
| Wage / Income Gap ($) | 2,915 | 54.43¢ per $1 |
| Gini / Inequality Index | 2,915 | 0.46 |
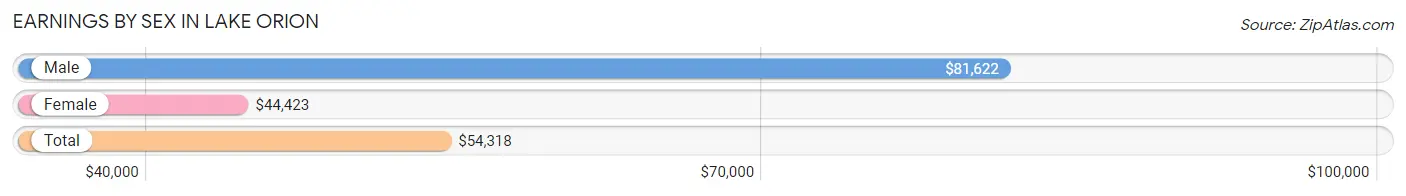
Earnings by Sex in Lake Orion
Average Earnings in Lake Orion are $54,318, $81,622 for men and $44,423 for women, a difference of 45.6%.
| Sex | Number | Average Earnings |
| Male | 798 (48.5%) | $81,622 |
| Female | 846 (51.5%) | $44,423 |
| Total | 1,644 (100.0%) | $54,318 |
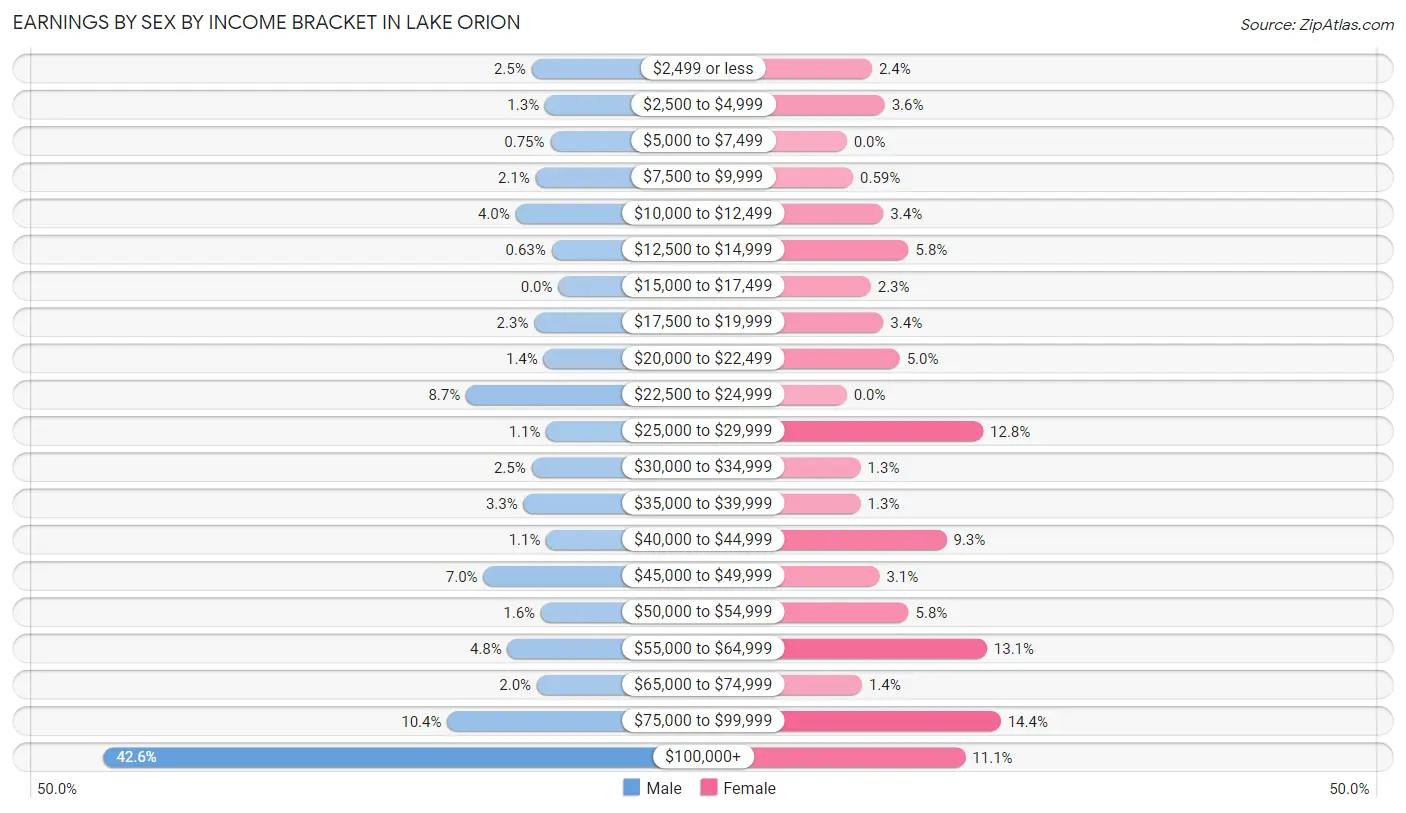
Earnings by Sex by Income Bracket in Lake Orion
The most common earnings brackets in Lake Orion are $100,000+ for men (340 | 42.6%) and $75,000 to $99,999 for women (122 | 14.4%).
| Income | Male | Female |
| $2,499 or less | 20 (2.5%) | 20 (2.4%) |
| $2,500 to $4,999 | 10 (1.3%) | 30 (3.5%) |
| $5,000 to $7,499 | 6 (0.7%) | 0 (0.0%) |
| $7,500 to $9,999 | 17 (2.1%) | 5 (0.6%) |
| $10,000 to $12,499 | 32 (4.0%) | 29 (3.4%) |
| $12,500 to $14,999 | 5 (0.6%) | 49 (5.8%) |
| $15,000 to $17,499 | 0 (0.0%) | 19 (2.2%) |
| $17,500 to $19,999 | 18 (2.3%) | 29 (3.4%) |
| $20,000 to $22,499 | 11 (1.4%) | 42 (5.0%) |
| $22,500 to $24,999 | 69 (8.6%) | 0 (0.0%) |
| $25,000 to $29,999 | 9 (1.1%) | 108 (12.8%) |
| $30,000 to $34,999 | 20 (2.5%) | 11 (1.3%) |
| $35,000 to $39,999 | 26 (3.3%) | 11 (1.3%) |
| $40,000 to $44,999 | 9 (1.1%) | 79 (9.3%) |
| $45,000 to $49,999 | 56 (7.0%) | 26 (3.1%) |
| $50,000 to $54,999 | 13 (1.6%) | 49 (5.8%) |
| $55,000 to $64,999 | 38 (4.8%) | 111 (13.1%) |
| $65,000 to $74,999 | 16 (2.0%) | 12 (1.4%) |
| $75,000 to $99,999 | 83 (10.4%) | 122 (14.4%) |
| $100,000+ | 340 (42.6%) | 94 (11.1%) |
| Total | 798 (100.0%) | 846 (100.0%) |
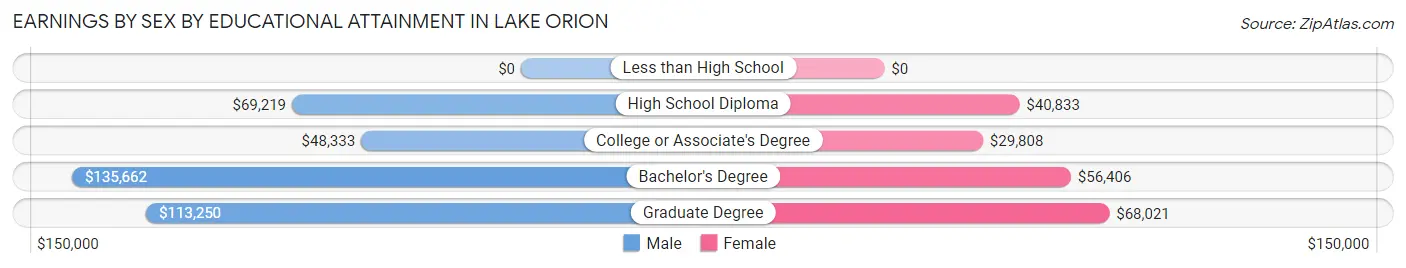
Earnings by Sex by Educational Attainment in Lake Orion
Average earnings in Lake Orion are $93,051 for men and $51,219 for women, a difference of 45.0%. Men with an educational attainment of bachelor's degree enjoy the highest average annual earnings of $135,662, while those with college or associate's degree education earn the least with $48,333. Women with an educational attainment of graduate degree earn the most with the average annual earnings of $68,021, while those with college or associate's degree education have the smallest earnings of $29,808.
| Educational Attainment | Male Income | Female Income |
| Less than High School | - | - |
| High School Diploma | $69,219 | $40,833 |
| College or Associate's Degree | $48,333 | $29,808 |
| Bachelor's Degree | $135,662 | $56,406 |
| Graduate Degree | $113,250 | $68,021 |
| Total | $93,051 | $51,219 |
Family Income in Lake Orion
Family Income Brackets in Lake Orion
According to the Lake Orion family income data, there are 217 families falling into the $200,000+ income range, which is the most common income bracket and makes up 32.1% of all families.
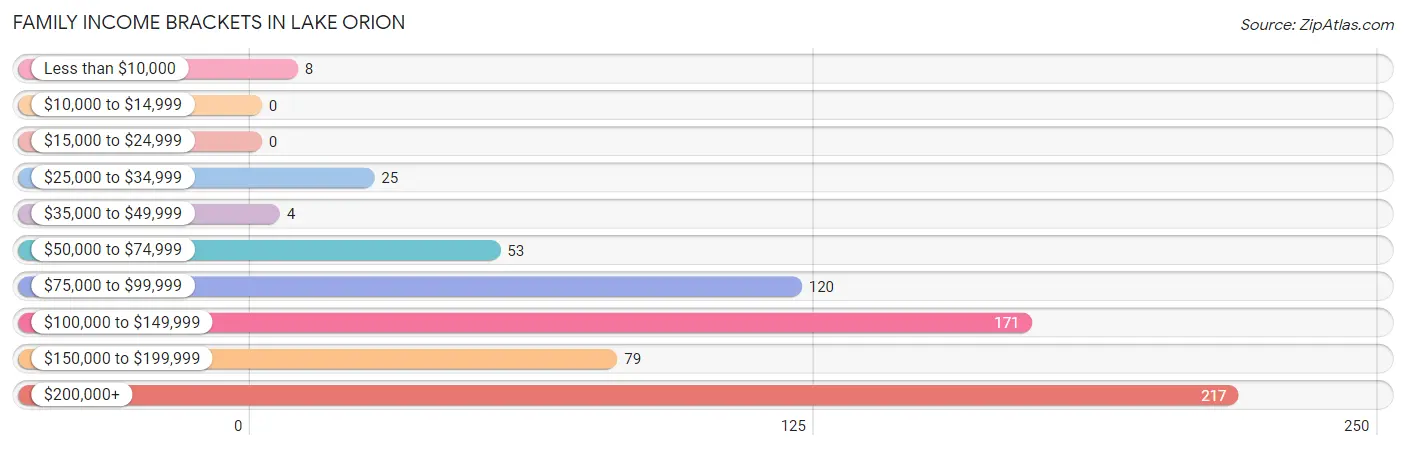
| Income Bracket | # Families | % Families |
| Less than $10,000 | 8 | 1.2% |
| $10,000 to $14,999 | 0 | 0.0% |
| $15,000 to $24,999 | 0 | 0.0% |
| $25,000 to $34,999 | 25 | 3.7% |
| $35,000 to $49,999 | 4 | 0.6% |
| $50,000 to $74,999 | 53 | 7.8% |
| $75,000 to $99,999 | 120 | 17.7% |
| $100,000 to $149,999 | 171 | 25.3% |
| $150,000 to $199,999 | 79 | 11.7% |
| $200,000+ | 217 | 32.1% |
Family Income by Famaliy Size in Lake Orion
5-person families (42 | 6.2%) account for the highest median family income in Lake Orion with $250,001 per family, while 2-person families (216 | 31.9%) have the highest median income of $75,416 per family member.
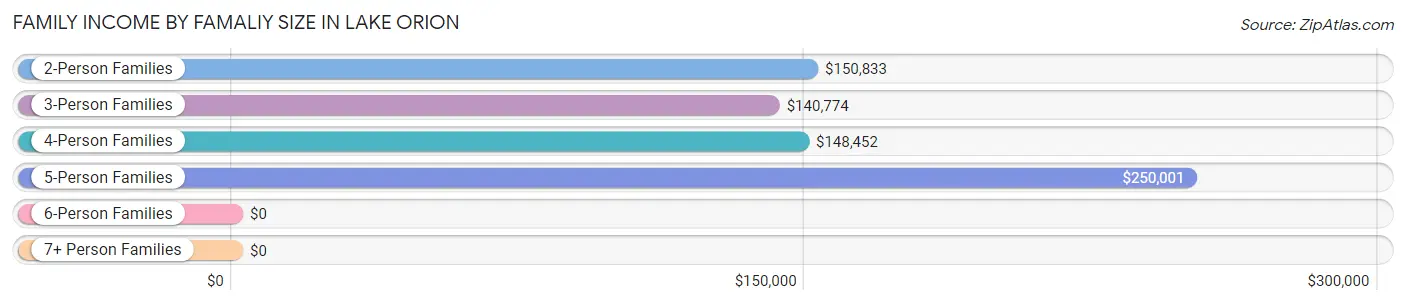
| Income Bracket | # Families | Median Income |
| 2-Person Families | 216 (31.9%) | $150,833 |
| 3-Person Families | 243 (35.9%) | $140,774 |
| 4-Person Families | 164 (24.2%) | $148,452 |
| 5-Person Families | 42 (6.2%) | $250,001 |
| 6-Person Families | 12 (1.8%) | $0 |
| 7+ Person Families | 0 (0.0%) | $0 |
| Total | 677 (100.0%) | $145,509 |
Family Income by Number of Earners in Lake Orion
The median family income in Lake Orion is $145,509, with families comprising 3+ earners (102) having the highest median family income of $178,889, while families with 1 earner (185) have the lowest median family income of $93,068, accounting for 15.1% and 27.3% of families, respectively.
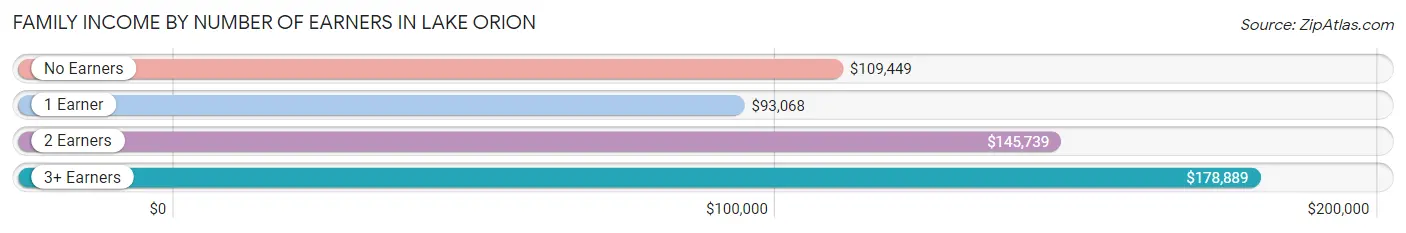
| Number of Earners | # Families | Median Income |
| No Earners | 53 (7.8%) | $109,449 |
| 1 Earner | 185 (27.3%) | $93,068 |
| 2 Earners | 337 (49.8%) | $145,739 |
| 3+ Earners | 102 (15.1%) | $178,889 |
| Total | 677 (100.0%) | $145,509 |
Household Income in Lake Orion
Household Income Brackets in Lake Orion
With 224 households falling in the category, the $200,000+ income range is the most frequent in Lake Orion, accounting for 18.1% of all households. In contrast, only 55 households (4.4%) fall into the less than $10,000 income bracket, making it the least populous group.
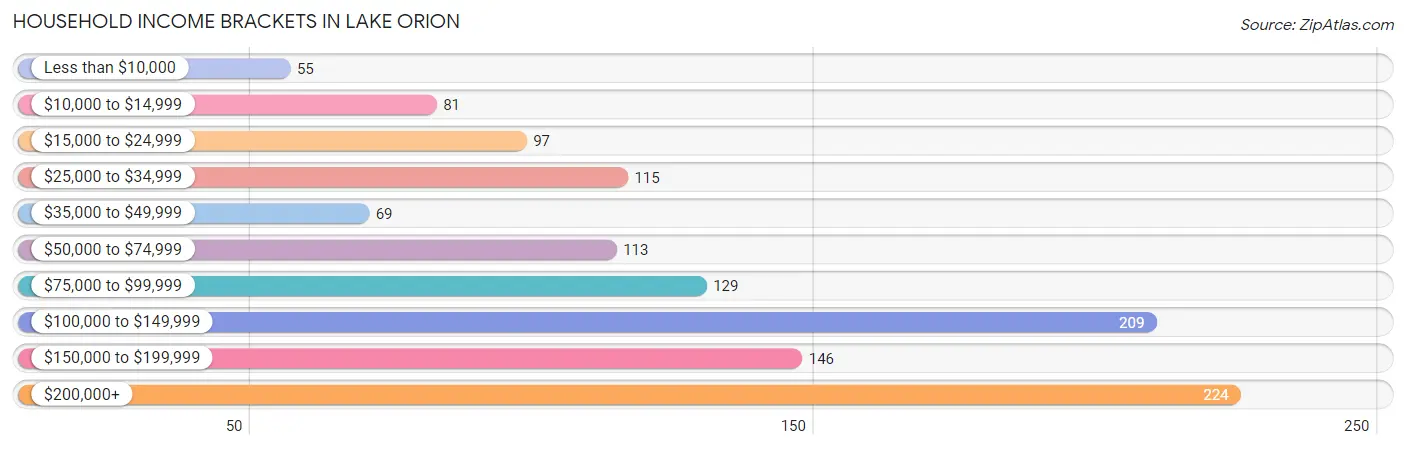
| Income Bracket | # Households | % Households |
| Less than $10,000 | 55 | 4.4% |
| $10,000 to $14,999 | 81 | 6.5% |
| $15,000 to $24,999 | 97 | 7.8% |
| $25,000 to $34,999 | 115 | 9.3% |
| $35,000 to $49,999 | 69 | 5.6% |
| $50,000 to $74,999 | 113 | 9.1% |
| $75,000 to $99,999 | 129 | 10.4% |
| $100,000 to $149,999 | 209 | 16.9% |
| $150,000 to $199,999 | 146 | 11.8% |
| $200,000+ | 224 | 18.1% |
Household Income by Householder Age in Lake Orion
The median household income in Lake Orion is $94,925, with the highest median household income of $111,250 found in the 45 to 64 years age bracket for the primary householder. A total of 432 households (34.9%) fall into this category. Meanwhile, the 15 to 24 years age bracket for the primary householder has the lowest median household income of $0, with 16 households (1.3%) in this group.
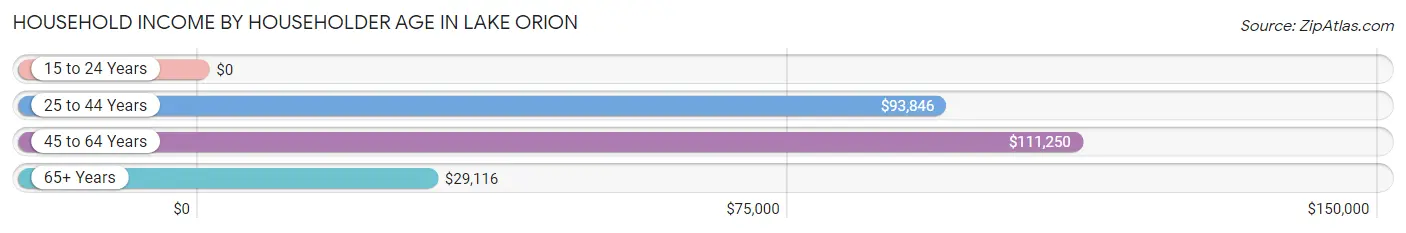
| Income Bracket | # Households | Median Income |
| 15 to 24 Years | 16 (1.3%) | $0 |
| 25 to 44 Years | 428 (34.5%) | $93,846 |
| 45 to 64 Years | 432 (34.9%) | $111,250 |
| 65+ Years | 363 (29.3%) | $29,116 |
| Total | 1,239 (100.0%) | $94,925 |
Poverty in Lake Orion
Income Below Poverty by Sex and Age in Lake Orion
With 4.6% poverty level for males and 9.5% for females among the residents of Lake Orion, 75 year old and over males and 65 to 74 year old females are the most vulnerable to poverty, with 17 males (39.5%) and 65 females (51.6%) in their respective age groups living below the poverty level.
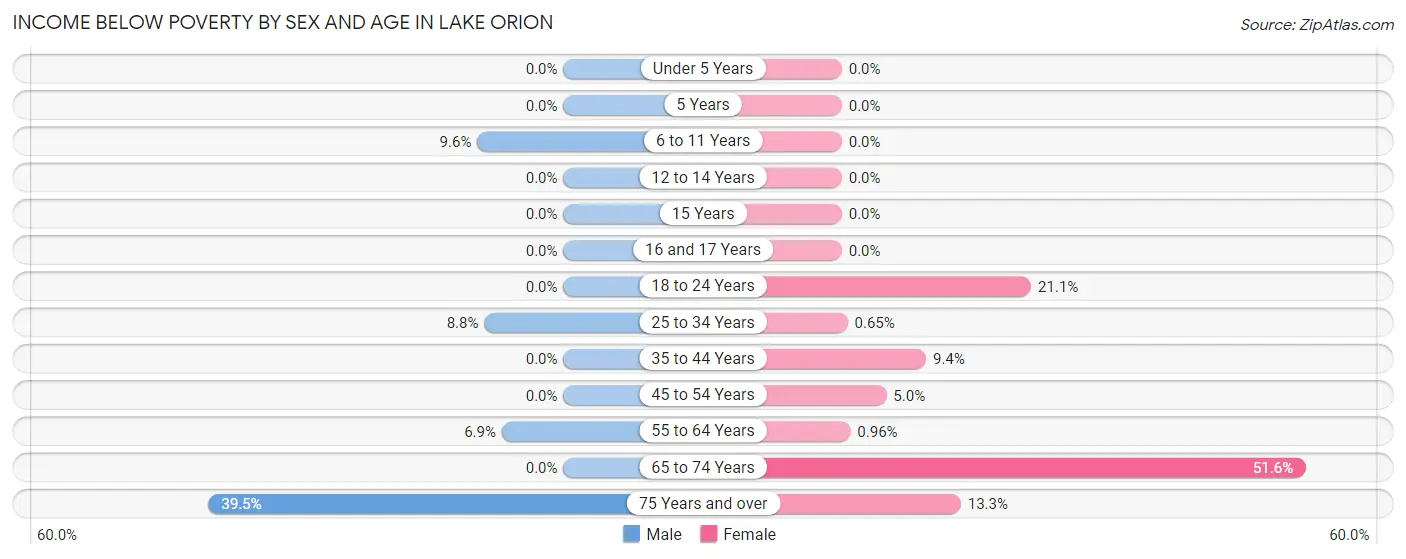
| Age Bracket | Male | Female |
| Under 5 Years | 0 (0.0%) | 0 (0.0%) |
| 5 Years | 0 (0.0%) | 0 (0.0%) |
| 6 to 11 Years | 7 (9.6%) | 0 (0.0%) |
| 12 to 14 Years | 0 (0.0%) | 0 (0.0%) |
| 15 Years | 0 (0.0%) | 0 (0.0%) |
| 16 and 17 Years | 0 (0.0%) | 0 (0.0%) |
| 18 to 24 Years | 0 (0.0%) | 27 (21.1%) |
| 25 to 34 Years | 19 (8.8%) | 2 (0.6%) |
| 35 to 44 Years | 0 (0.0%) | 18 (9.4%) |
| 45 to 54 Years | 0 (0.0%) | 8 (5.0%) |
| 55 to 64 Years | 17 (6.9%) | 2 (1.0%) |
| 65 to 74 Years | 0 (0.0%) | 65 (51.6%) |
| 75 Years and over | 17 (39.5%) | 22 (13.3%) |
| Total | 60 (4.6%) | 144 (9.5%) |
Income Above Poverty by Sex and Age in Lake Orion
According to the poverty statistics in Lake Orion, males aged under 5 years and females aged under 5 years are the age groups that are most secure financially, with 100.0% of males and 100.0% of females in these age groups living above the poverty line.
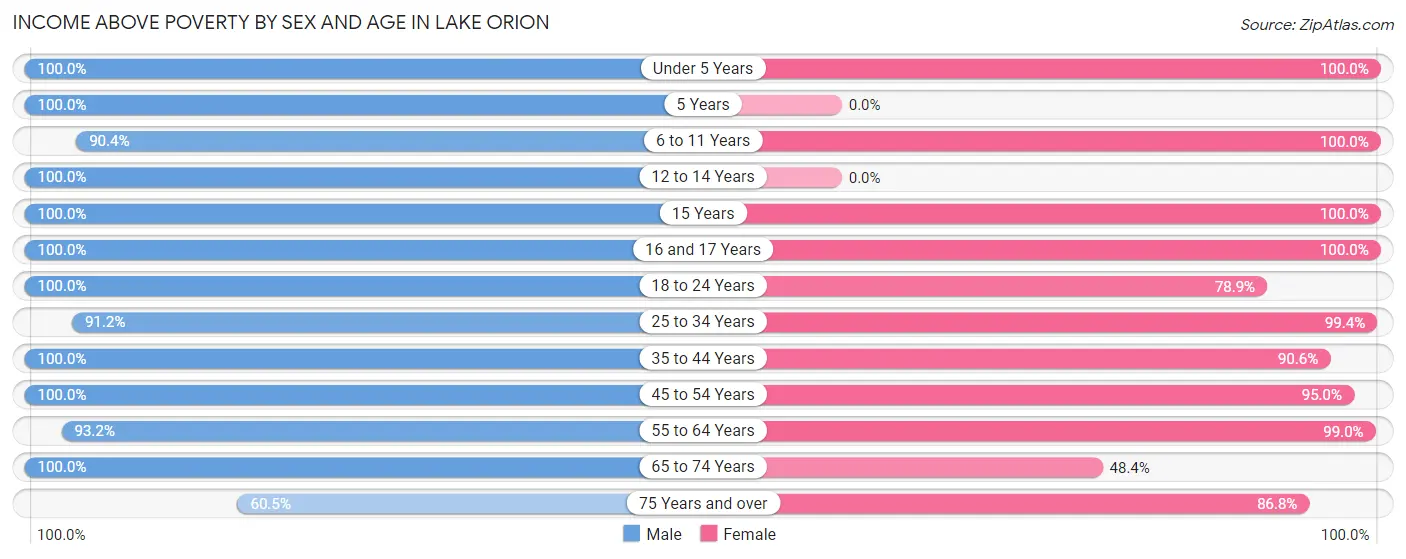
| Age Bracket | Male | Female |
| Under 5 Years | 118 (100.0%) | 105 (100.0%) |
| 5 Years | 34 (100.0%) | 0 (0.0%) |
| 6 to 11 Years | 66 (90.4%) | 90 (100.0%) |
| 12 to 14 Years | 1 (100.0%) | 0 (0.0%) |
| 15 Years | 15 (100.0%) | 16 (100.0%) |
| 16 and 17 Years | 28 (100.0%) | 9 (100.0%) |
| 18 to 24 Years | 59 (100.0%) | 101 (78.9%) |
| 25 to 34 Years | 197 (91.2%) | 306 (99.4%) |
| 35 to 44 Years | 180 (100.0%) | 174 (90.6%) |
| 45 to 54 Years | 107 (100.0%) | 153 (95.0%) |
| 55 to 64 Years | 231 (93.1%) | 207 (99.0%) |
| 65 to 74 Years | 176 (100.0%) | 61 (48.4%) |
| 75 Years and over | 26 (60.5%) | 144 (86.8%) |
| Total | 1,238 (95.4%) | 1,366 (90.5%) |
Income Below Poverty Among Married-Couple Families in Lake Orion
The poverty statistics for married-couple families in Lake Orion show that 1.3% or 8 of the total 638 families live below the poverty line. Families with 1 or 2 children have the highest poverty rate of 2.9%, comprising of 8 families. On the other hand, families with no children have the lowest poverty rate of 0.0%, which includes 0 families.
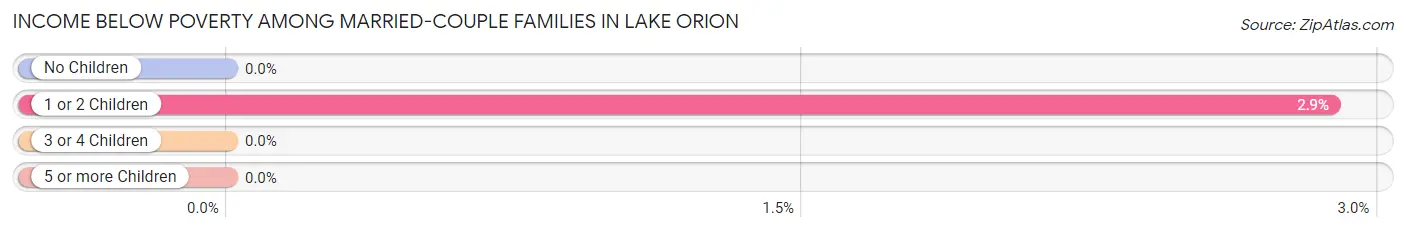
| Children | Above Poverty | Below Poverty |
| No Children | 332 (100.0%) | 0 (0.0%) |
| 1 or 2 Children | 270 (97.1%) | 8 (2.9%) |
| 3 or 4 Children | 28 (100.0%) | 0 (0.0%) |
| 5 or more Children | 0 (0.0%) | 0 (0.0%) |
| Total | 630 (98.8%) | 8 (1.3%) |
Income Below Poverty Among Single-Parent Households in Lake Orion
| Children | Single Father | Single Mother |
| No Children | 0 (0.0%) | 0 (0.0%) |
| 1 or 2 Children | 0 (0.0%) | 0 (0.0%) |
| 3 or 4 Children | 0 (0.0%) | 0 (0.0%) |
| 5 or more Children | 0 (0.0%) | 0 (0.0%) |
| Total | 0 (0.0%) | 0 (0.0%) |
Income Below Poverty Among Married-Couple vs Single-Parent Households in Lake Orion
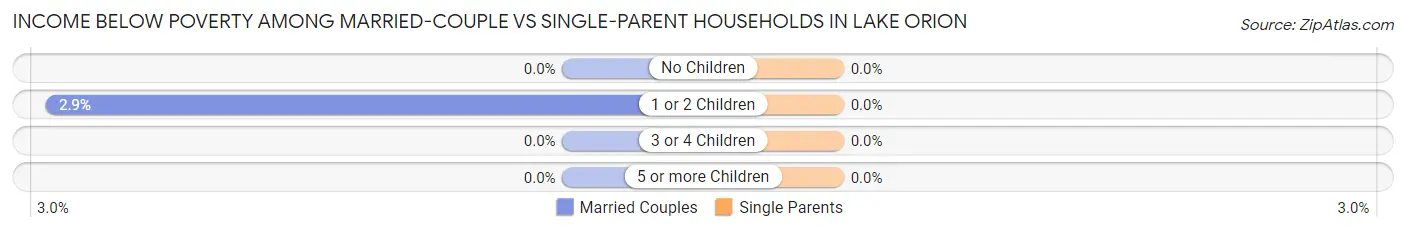
| Children | Married-Couple Families | Single-Parent Households |
| No Children | 0 (0.0%) | 0 (0.0%) |
| 1 or 2 Children | 8 (2.9%) | 0 (0.0%) |
| 3 or 4 Children | 0 (0.0%) | 0 (0.0%) |
| 5 or more Children | 0 (0.0%) | 0 (0.0%) |
| Total | 8 (1.3%) | 0 (0.0%) |
Race in Lake Orion
The most populous races in Lake Orion are White / Caucasian (2,674 | 91.7%), Asian (125 | 4.3%), and Hispanic or Latino (125 | 4.3%).
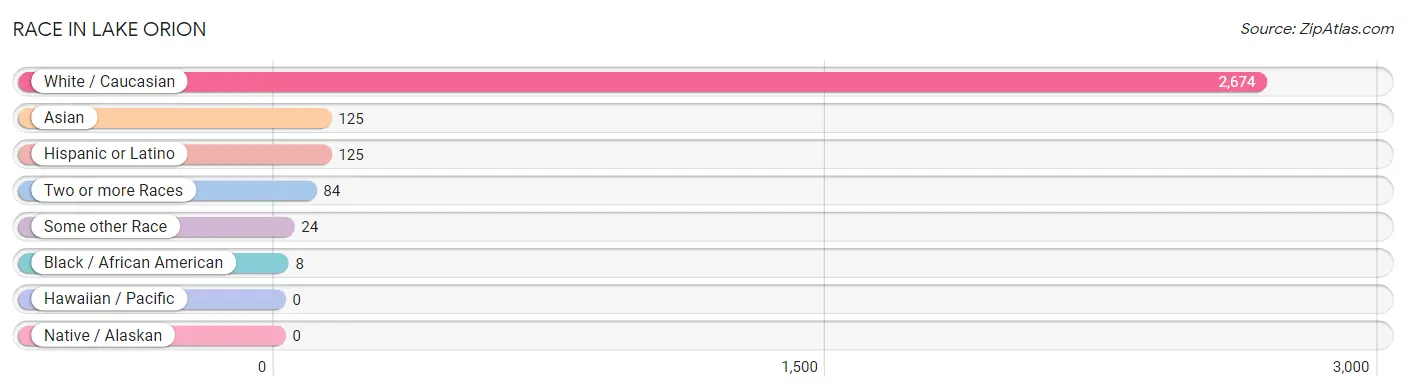
| Race | # Population | % Population |
| Asian | 125 | 4.3% |
| Black / African American | 8 | 0.3% |
| Hawaiian / Pacific | 0 | 0.0% |
| Hispanic or Latino | 125 | 4.3% |
| Native / Alaskan | 0 | 0.0% |
| White / Caucasian | 2,674 | 91.7% |
| Two or more Races | 84 | 2.9% |
| Some other Race | 24 | 0.8% |
| Total | 2,915 | 100.0% |
Ancestry in Lake Orion
The most populous ancestries reported in Lake Orion are German (1,002 | 34.4%), Irish (637 | 21.8%), English (321 | 11.0%), Italian (290 | 10.0%), and Polish (226 | 7.7%), together accounting for 84.9% of all Lake Orion residents.
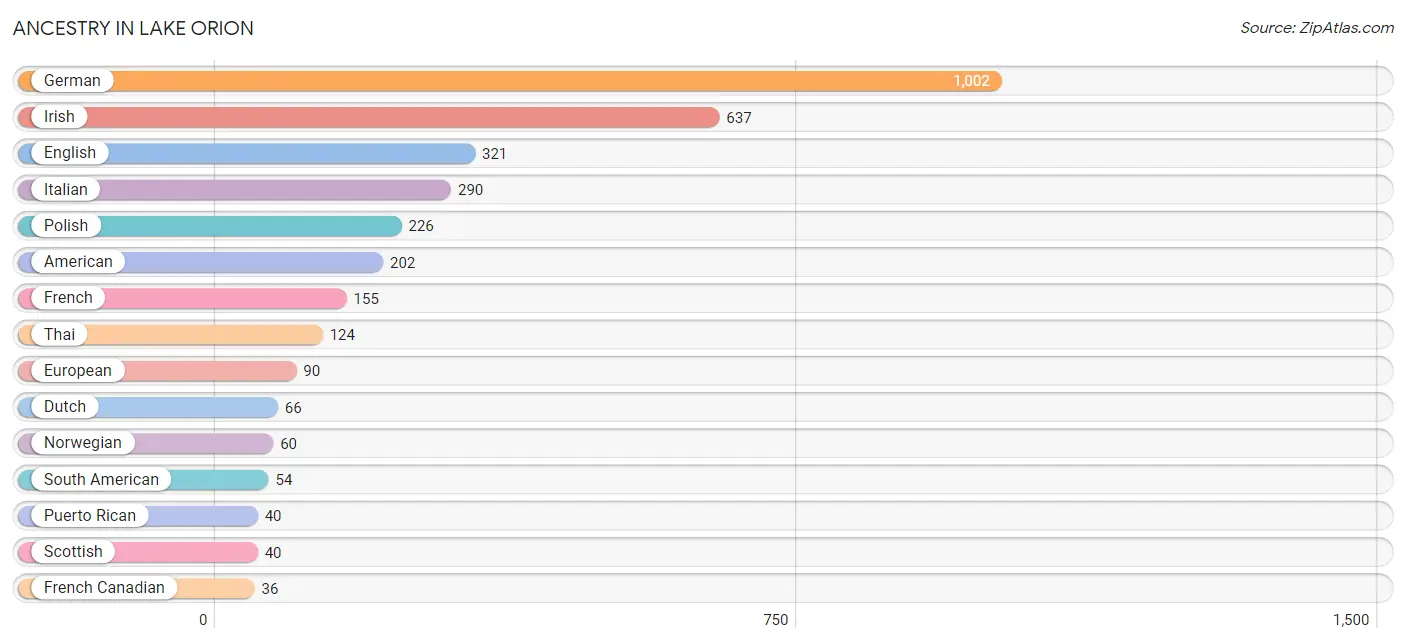
| Ancestry | # Population | % Population |
| American | 202 | 6.9% |
| Argentinean | 30 | 1.0% |
| Australian | 11 | 0.4% |
| Colombian | 24 | 0.8% |
| Croatian | 14 | 0.5% |
| Czech | 27 | 0.9% |
| Danish | 5 | 0.2% |
| Dutch | 66 | 2.3% |
| Eastern European | 9 | 0.3% |
| English | 321 | 11.0% |
| European | 90 | 3.1% |
| French | 155 | 5.3% |
| French Canadian | 36 | 1.2% |
| German | 1,002 | 34.4% |
| Greek | 9 | 0.3% |
| Hungarian | 12 | 0.4% |
| Irish | 637 | 21.8% |
| Italian | 290 | 10.0% |
| Maltese | 24 | 0.8% |
| Mexican | 18 | 0.6% |
| Northern European | 6 | 0.2% |
| Norwegian | 60 | 2.1% |
| Pakistani | 1 | 0.0% |
| Polish | 226 | 7.7% |
| Puerto Rican | 40 | 1.4% |
| Scottish | 40 | 1.4% |
| South American | 54 | 1.8% |
| South American Indian | 24 | 0.8% |
| Spanish | 13 | 0.4% |
| Swiss | 36 | 1.2% |
| Thai | 124 | 4.3% |
| Ukrainian | 17 | 0.6% |
| Welsh | 9 | 0.3% |
| Yaqui | 10 | 0.3% | View All 34 Rows |
Immigrants in Lake Orion
The most numerous immigrant groups reported in Lake Orion came from Asia (75 | 2.6%), India (55 | 1.9%), South Central Asia (55 | 1.9%), Latin America (47 | 1.6%), and South America (39 | 1.3%), together accounting for 9.3% of all Lake Orion residents.
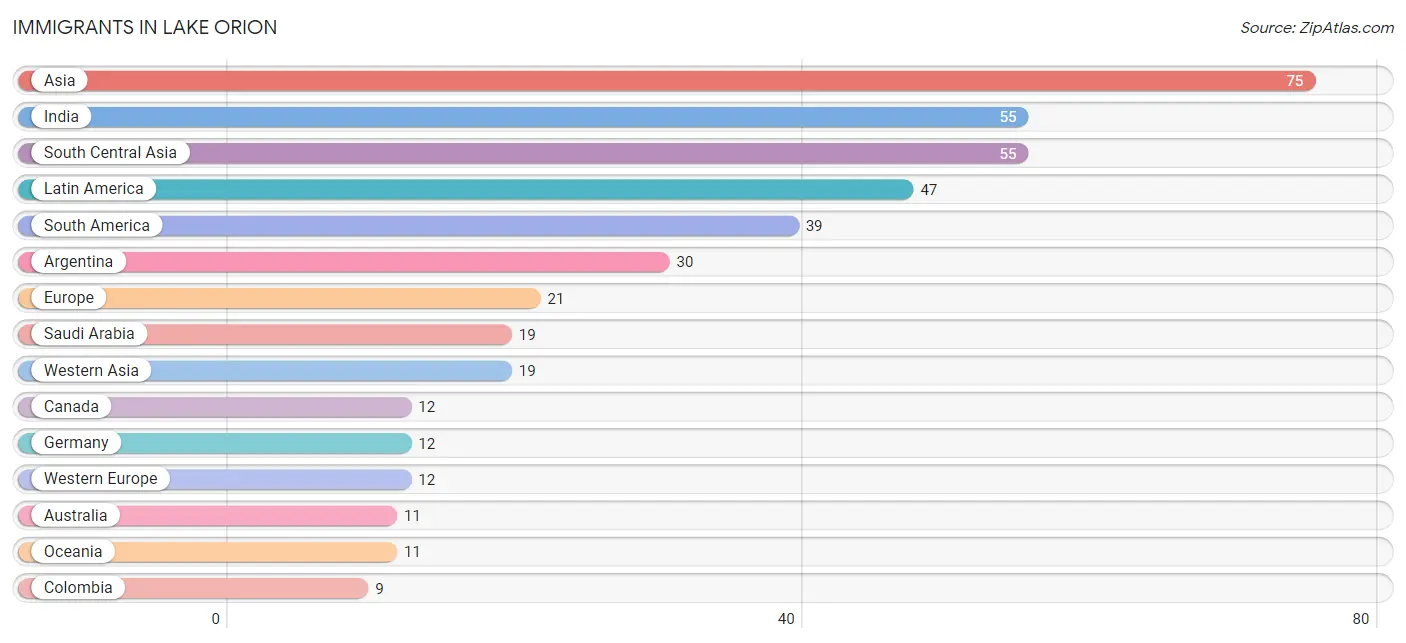
| Immigration Origin | # Population | % Population |
| Argentina | 30 | 1.0% |
| Asia | 75 | 2.6% |
| Australia | 11 | 0.4% |
| Canada | 12 | 0.4% |
| Central America | 8 | 0.3% |
| Colombia | 9 | 0.3% |
| Europe | 21 | 0.7% |
| Germany | 12 | 0.4% |
| Greece | 9 | 0.3% |
| India | 55 | 1.9% |
| Latin America | 47 | 1.6% |
| Mexico | 8 | 0.3% |
| Oceania | 11 | 0.4% |
| Saudi Arabia | 19 | 0.6% |
| South America | 39 | 1.3% |
| South Central Asia | 55 | 1.9% |
| South Eastern Asia | 1 | 0.0% |
| Southern Europe | 9 | 0.3% |
| Thailand | 1 | 0.0% |
| Western Asia | 19 | 0.6% |
| Western Europe | 12 | 0.4% | View All 21 Rows |
Sex and Age in Lake Orion
Sex and Age in Lake Orion
The most populous age groups in Lake Orion are 60 to 64 Years (155 | 11.6%) for men and 25 to 29 Years (192 | 12.2%) for women.
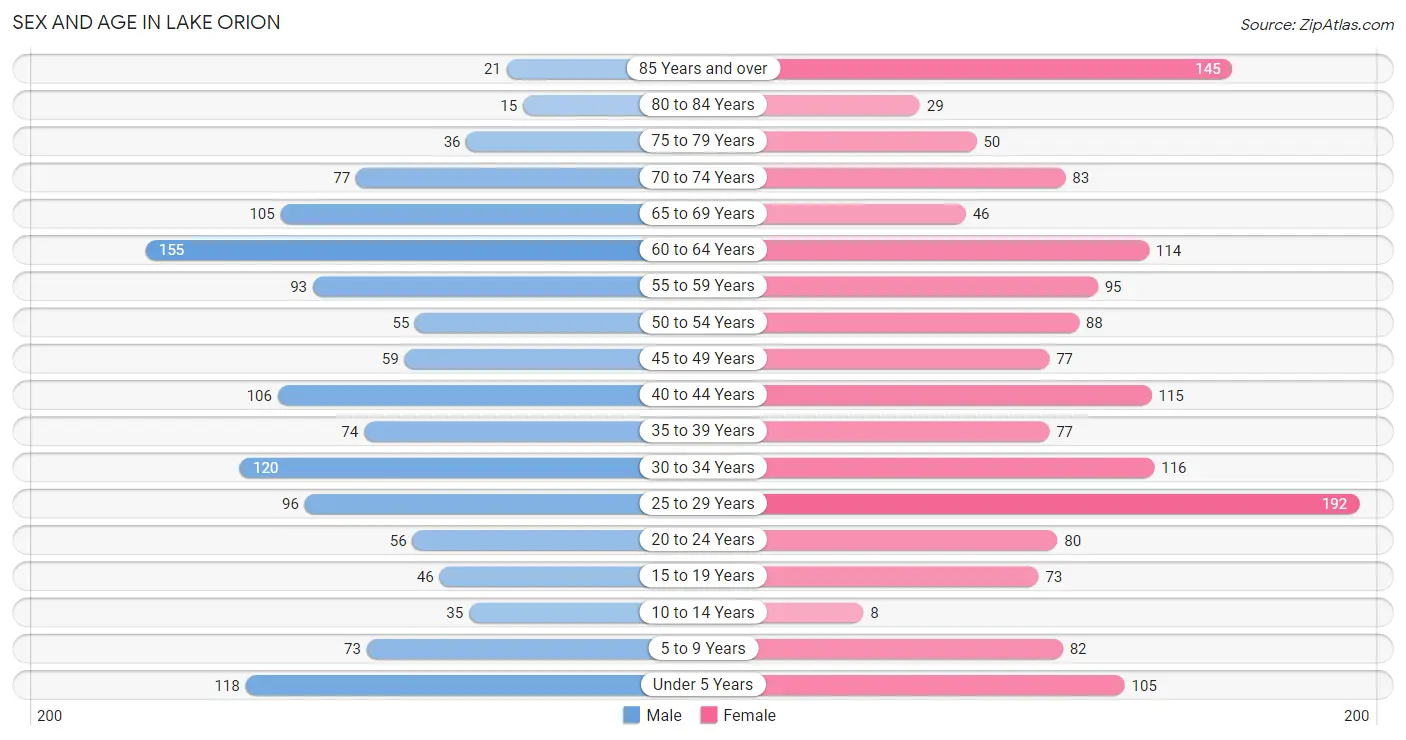
| Age Bracket | Male | Female |
| Under 5 Years | 118 (8.8%) | 105 (6.7%) |
| 5 to 9 Years | 73 (5.4%) | 82 (5.2%) |
| 10 to 14 Years | 35 (2.6%) | 8 (0.5%) |
| 15 to 19 Years | 46 (3.4%) | 73 (4.6%) |
| 20 to 24 Years | 56 (4.2%) | 80 (5.1%) |
| 25 to 29 Years | 96 (7.2%) | 192 (12.2%) |
| 30 to 34 Years | 120 (9.0%) | 116 (7.4%) |
| 35 to 39 Years | 74 (5.5%) | 77 (4.9%) |
| 40 to 44 Years | 106 (7.9%) | 115 (7.3%) |
| 45 to 49 Years | 59 (4.4%) | 77 (4.9%) |
| 50 to 54 Years | 55 (4.1%) | 88 (5.6%) |
| 55 to 59 Years | 93 (6.9%) | 95 (6.0%) |
| 60 to 64 Years | 155 (11.6%) | 114 (7.2%) |
| 65 to 69 Years | 105 (7.8%) | 46 (2.9%) |
| 70 to 74 Years | 77 (5.8%) | 83 (5.3%) |
| 75 to 79 Years | 36 (2.7%) | 50 (3.2%) |
| 80 to 84 Years | 15 (1.1%) | 29 (1.8%) |
| 85 Years and over | 21 (1.6%) | 145 (9.2%) |
| Total | 1,340 (100.0%) | 1,575 (100.0%) |
Families and Households in Lake Orion
Median Family Size in Lake Orion
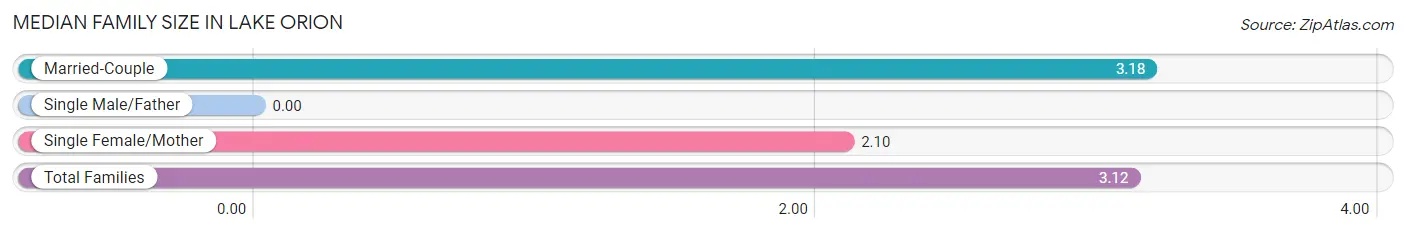
| Family Type | # Families | Family Size |
| Married-Couple | 638 (94.2%) | 3.18 |
| Single Male/Father | 0 (0.0%) | - |
| Single Female/Mother | 39 (5.8%) | 2.10 |
| Total Families | 677 (100.0%) | 3.12 |
Median Household Size in Lake Orion
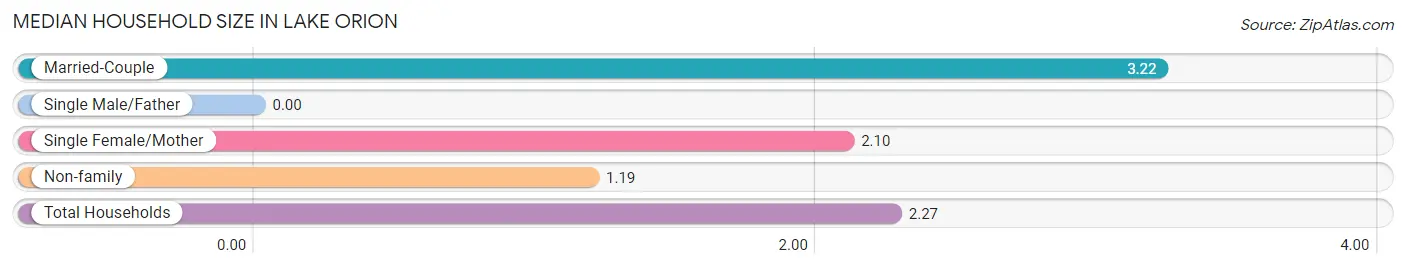
| Household Type | # Households | Household Size |
| Married-Couple | 638 (51.5%) | 3.22 |
| Single Male/Father | 0 (0.0%) | - |
| Single Female/Mother | 39 (3.2%) | 2.10 |
| Non-family | 562 (45.4%) | 1.19 |
| Total Households | 1,239 (100.0%) | 2.27 |
Household Size by Marriage Status in Lake Orion
Out of a total of 1,239 households in Lake Orion, 677 (54.6%) are family households, while 562 (45.4%) are nonfamily households. The most numerous type of family households are 3-person households, comprising 243, and the most common type of nonfamily households are 1-person households, comprising 489.
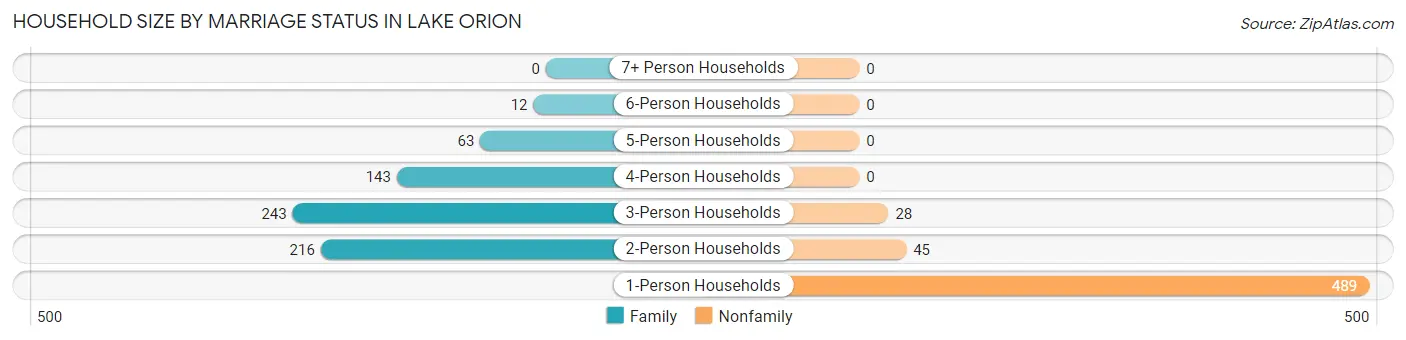
| Household Size | Family Households | Nonfamily Households |
| 1-Person Households | - | 489 (39.5%) |
| 2-Person Households | 216 (17.4%) | 45 (3.6%) |
| 3-Person Households | 243 (19.6%) | 28 (2.3%) |
| 4-Person Households | 143 (11.5%) | 0 (0.0%) |
| 5-Person Households | 63 (5.1%) | 0 (0.0%) |
| 6-Person Households | 12 (1.0%) | 0 (0.0%) |
| 7+ Person Households | 0 (0.0%) | 0 (0.0%) |
| Total | 677 (54.6%) | 562 (45.4%) |
Female Fertility in Lake Orion
Fertility by Age in Lake Orion
Average fertility rate in Lake Orion is 88.0 births per 1,000 women. Women in the age bracket of 20 to 34 years have the highest fertility rate with 173.0 births per 1,000 women. Women in the age bracket of 20 to 34 years acount for 100.0% of all women with births.
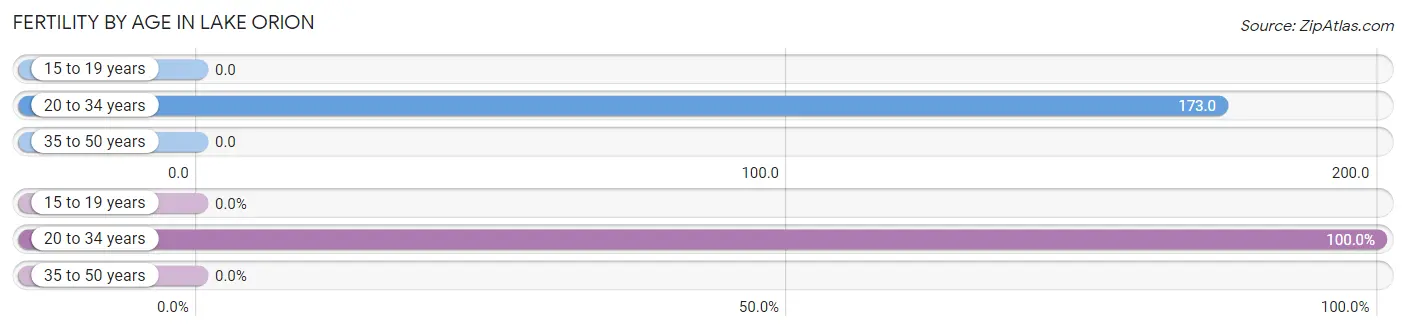
| Age Bracket | Women with Births | Births / 1,000 Women |
| 15 to 19 years | 0 (0.0%) | 0.0 |
| 20 to 34 years | 67 (100.0%) | 173.0 |
| 35 to 50 years | 0 (0.0%) | 0.0 |
| Total | 67 (100.0%) | 88.0 |
Fertility by Age by Marriage Status in Lake Orion
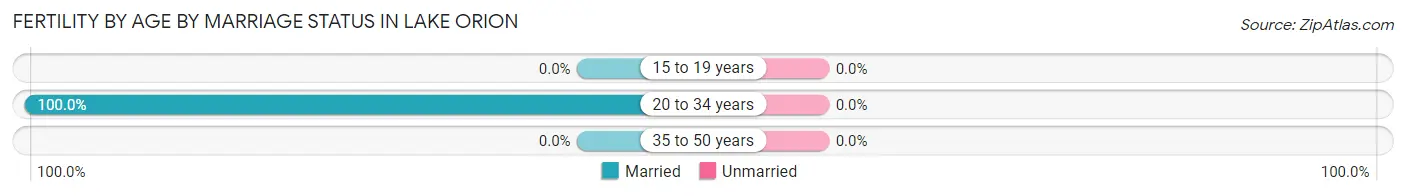
| Age Bracket | Married | Unmarried |
| 15 to 19 years | 0 (0.0%) | 0 (0.0%) |
| 20 to 34 years | 67 (100.0%) | 0 (0.0%) |
| 35 to 50 years | 0 (0.0%) | 0 (0.0%) |
| Total | 67 (100.0%) | 0 (0.0%) |
Fertility by Education in Lake Orion
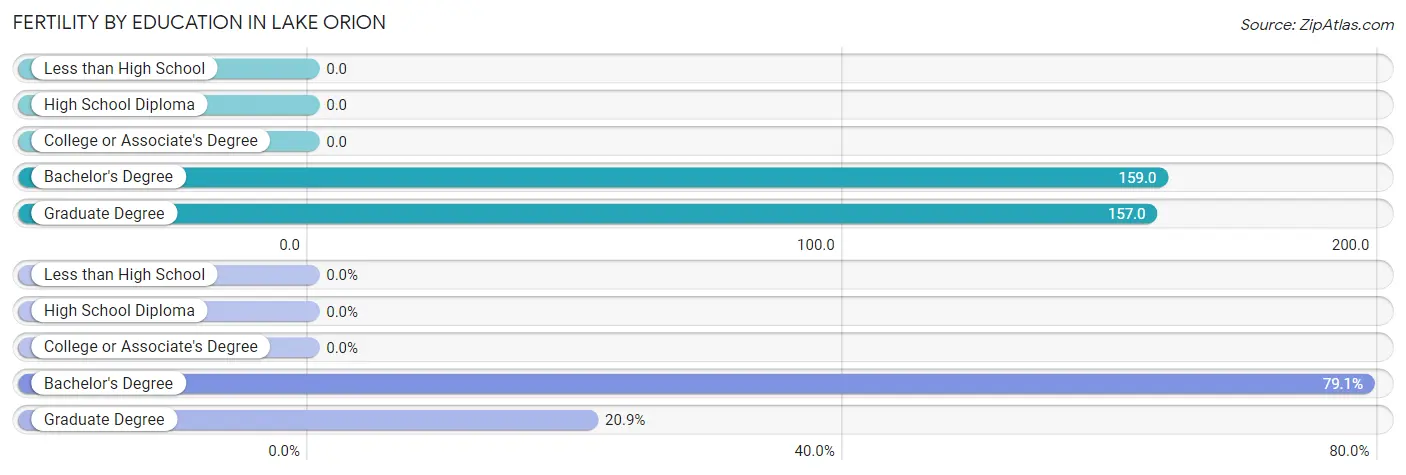
| Educational Attainment | Women with Births | Births / 1,000 Women |
| Less than High School | 0 (0.0%) | 0.0 |
| High School Diploma | 0 (0.0%) | 0.0 |
| College or Associate's Degree | 0 (0.0%) | 0.0 |
| Bachelor's Degree | 53 (79.1%) | 159.0 |
| Graduate Degree | 14 (20.9%) | 157.0 |
| Total | 67 (100.0%) | 88.0 |
Fertility by Education by Marriage Status in Lake Orion
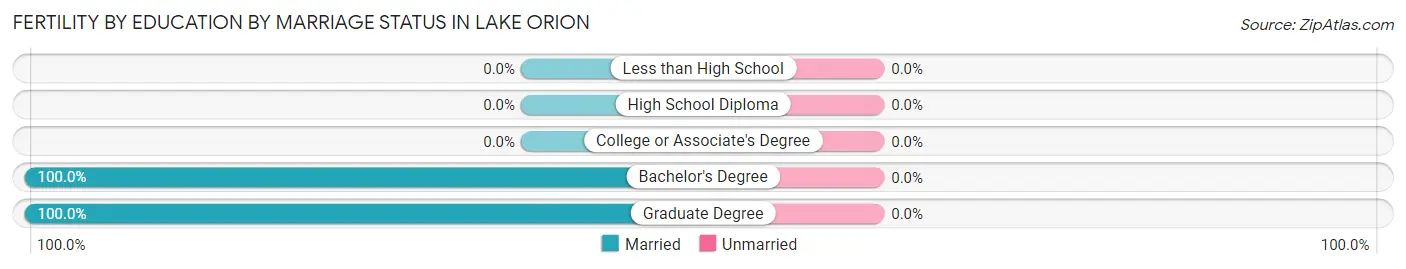
| Educational Attainment | Married | Unmarried |
| Less than High School | 0 (0.0%) | 0 (0.0%) |
| High School Diploma | 0 (0.0%) | 0 (0.0%) |
| College or Associate's Degree | 0 (0.0%) | 0 (0.0%) |
| Bachelor's Degree | 53 (100.0%) | 0 (0.0%) |
| Graduate Degree | 14 (100.0%) | 0 (0.0%) |
| Total | 67 (100.0%) | 0 (0.0%) |
Employment Characteristics in Lake Orion
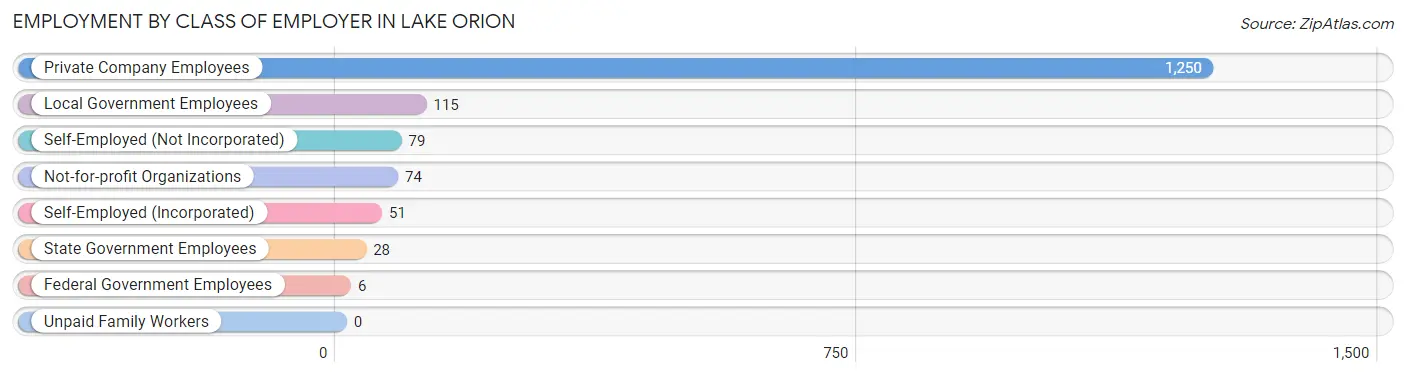
Employment by Class of Employer in Lake Orion
Among the 1,603 employed individuals in Lake Orion, private company employees (1,250 | 78.0%), local government employees (115 | 7.2%), and self-employed (not incorporated) (79 | 4.9%) make up the most common classes of employment.
| Employer Class | # Employees | % Employees |
| Private Company Employees | 1,250 | 78.0% |
| Self-Employed (Incorporated) | 51 | 3.2% |
| Self-Employed (Not Incorporated) | 79 | 4.9% |
| Not-for-profit Organizations | 74 | 4.6% |
| Local Government Employees | 115 | 7.2% |
| State Government Employees | 28 | 1.8% |
| Federal Government Employees | 6 | 0.4% |
| Unpaid Family Workers | 0 | 0.0% |
| Total | 1,603 | 100.0% |
Employment Status by Age in Lake Orion
According to the labor force statistics for Lake Orion, out of the total population over 16 years of age (2,463), 67.5% or 1,663 individuals are in the labor force, with 2.6% or 43 of them unemployed. The age group with the highest labor force participation rate is 30 to 34 years, with 95.3% or 225 individuals in the labor force. Within the labor force, the 20 to 24 years age range has the highest percentage of unemployed individuals, with 21.6% or 27 of them being unemployed.
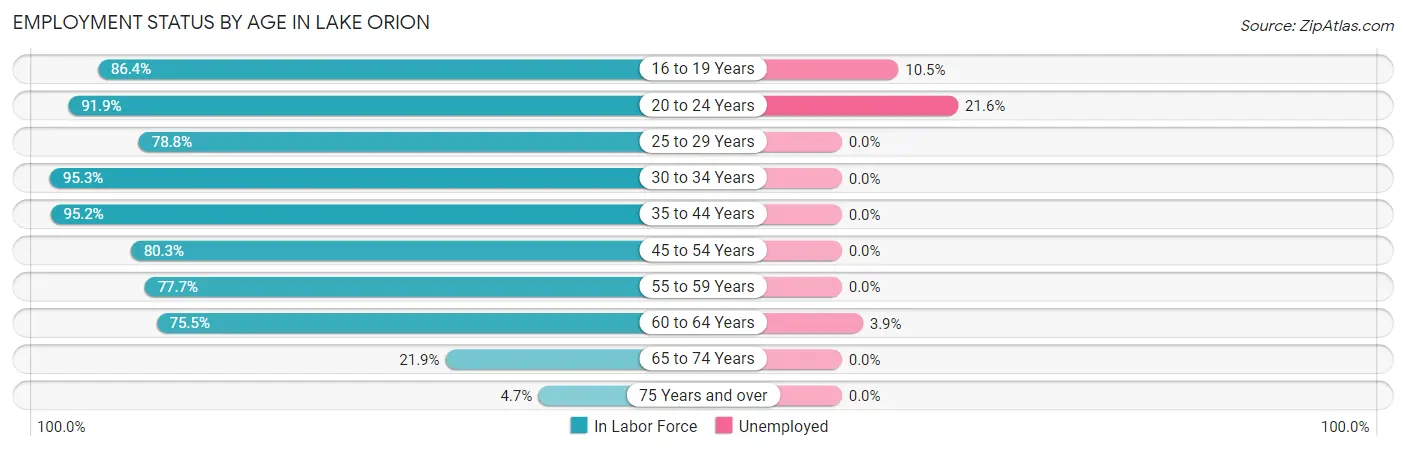
| Age Bracket | In Labor Force | Unemployed |
| 16 to 19 Years | 76 (86.4%) | 8 (10.5%) |
| 20 to 24 Years | 125 (91.9%) | 27 (21.6%) |
| 25 to 29 Years | 227 (78.8%) | 0 (0.0%) |
| 30 to 34 Years | 225 (95.3%) | 0 (0.0%) |
| 35 to 44 Years | 354 (95.2%) | 0 (0.0%) |
| 45 to 54 Years | 224 (80.3%) | 0 (0.0%) |
| 55 to 59 Years | 146 (77.7%) | 0 (0.0%) |
| 60 to 64 Years | 203 (75.5%) | 8 (3.9%) |
| 65 to 74 Years | 68 (21.9%) | 0 (0.0%) |
| 75 Years and over | 14 (4.7%) | 0 (0.0%) |
| Total | 1,663 (67.5%) | 43 (2.6%) |
Employment Status by Educational Attainment in Lake Orion
According to labor force statistics for Lake Orion, 84.5% of individuals (1,379) out of the total population between 25 and 64 years of age (1,632) are in the labor force, with 0.6% or 8 of them being unemployed. The group with the highest labor force participation rate are those with the educational attainment of bachelor's degree or higher, with 97.6% or 721 individuals in the labor force. Within the labor force, individuals with bachelor's degree or higher education have the highest percentage of unemployment, with 1.1% or 8 of them being unemployed.
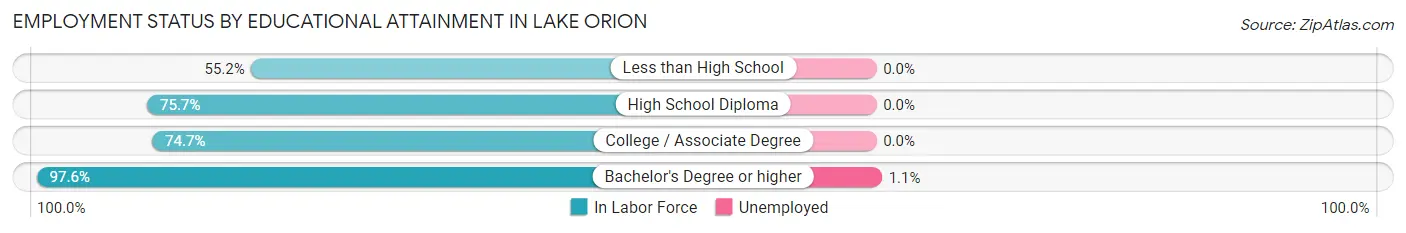
| Educational Attainment | In Labor Force | Unemployed |
| Less than High School | 32 (55.2%) | 0 (0.0%) |
| High School Diploma | 199 (75.7%) | 0 (0.0%) |
| College / Associate Degree | 427 (74.7%) | 0 (0.0%) |
| Bachelor's Degree or higher | 721 (97.6%) | 8 (1.1%) |
| Total | 1,379 (84.5%) | 10 (0.6%) |
Employment Occupations by Sex in Lake Orion
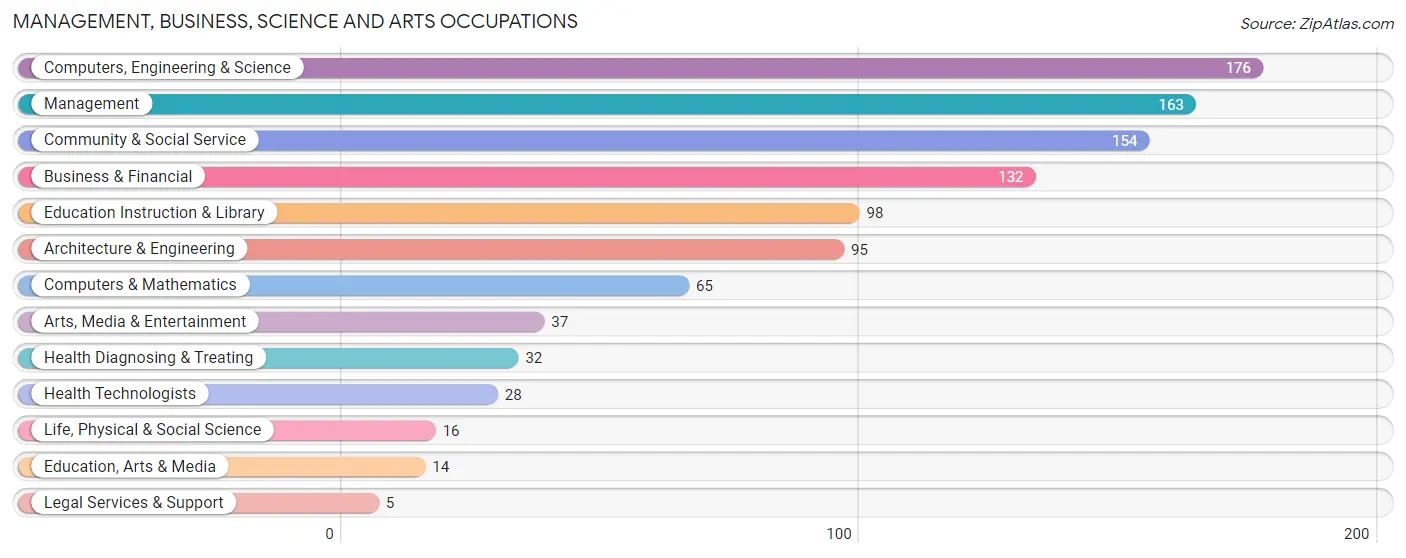
Management, Business, Science and Arts Occupations
The most common Management, Business, Science and Arts occupations in Lake Orion are Computers, Engineering & Science (176 | 10.9%), Management (163 | 10.1%), Community & Social Service (154 | 9.5%), Business & Financial (132 | 8.2%), and Education Instruction & Library (98 | 6.0%).
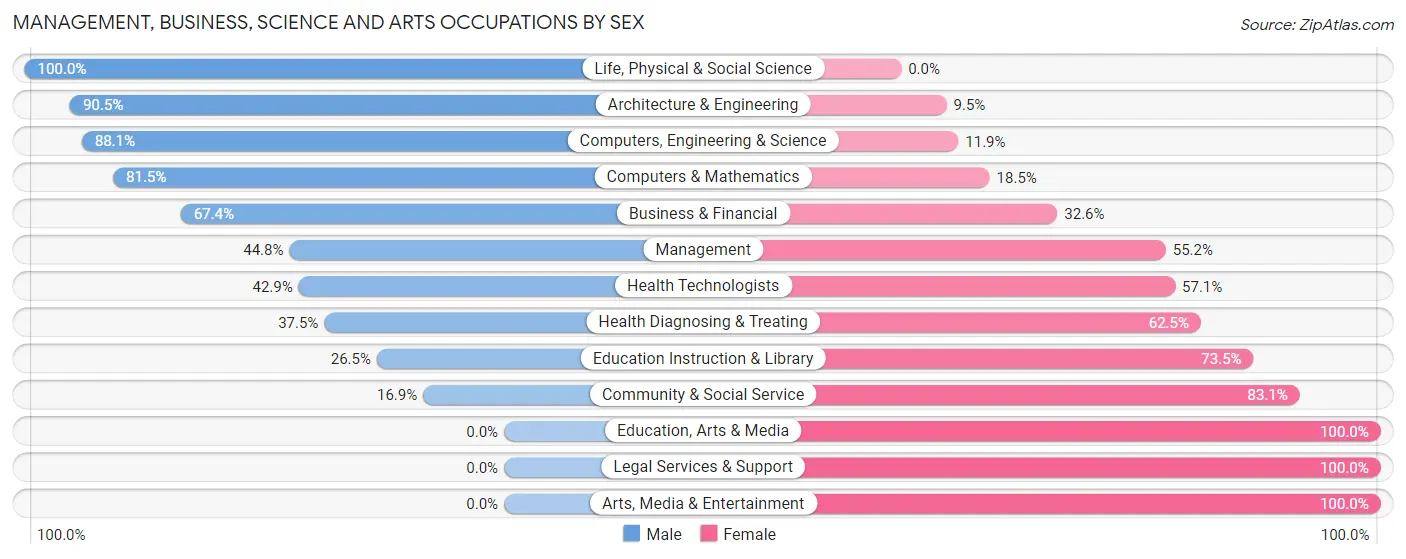
Management, Business, Science and Arts Occupations by Sex
Within the Management, Business, Science and Arts occupations in Lake Orion, the most male-oriented occupations are Life, Physical & Social Science (100.0%), Architecture & Engineering (90.5%), and Computers, Engineering & Science (88.1%), while the most female-oriented occupations are Education, Arts & Media (100.0%), Legal Services & Support (100.0%), and Arts, Media & Entertainment (100.0%).
| Occupation | Male | Female |
| Management | 73 (44.8%) | 90 (55.2%) |
| Business & Financial | 89 (67.4%) | 43 (32.6%) |
| Computers, Engineering & Science | 155 (88.1%) | 21 (11.9%) |
| Computers & Mathematics | 53 (81.5%) | 12 (18.5%) |
| Architecture & Engineering | 86 (90.5%) | 9 (9.5%) |
| Life, Physical & Social Science | 16 (100.0%) | 0 (0.0%) |
| Community & Social Service | 26 (16.9%) | 128 (83.1%) |
| Education, Arts & Media | 0 (0.0%) | 14 (100.0%) |
| Legal Services & Support | 0 (0.0%) | 5 (100.0%) |
| Education Instruction & Library | 26 (26.5%) | 72 (73.5%) |
| Arts, Media & Entertainment | 0 (0.0%) | 37 (100.0%) |
| Health Diagnosing & Treating | 12 (37.5%) | 20 (62.5%) |
| Health Technologists | 12 (42.9%) | 16 (57.1%) |
| Total (Category) | 355 (54.0%) | 302 (46.0%) |
| Total (Overall) | 798 (49.3%) | 821 (50.7%) |
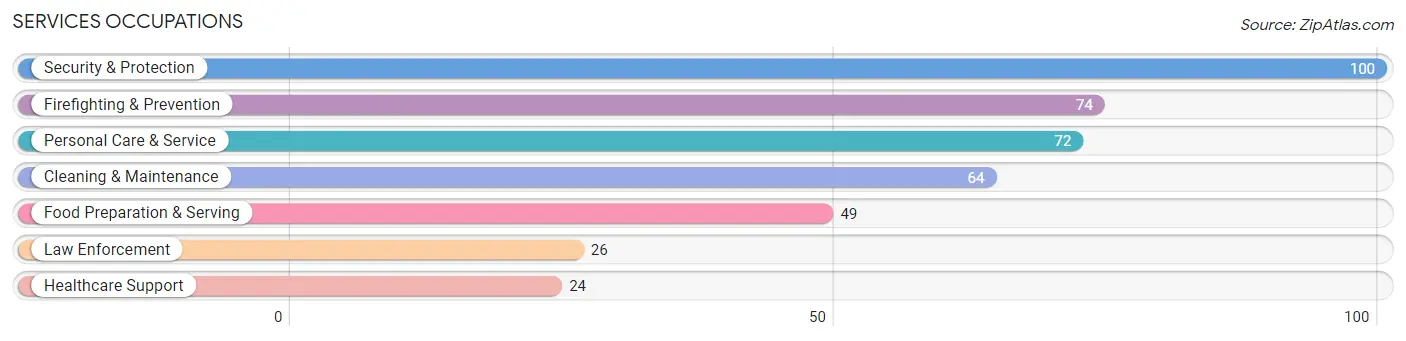
Services Occupations
The most common Services occupations in Lake Orion are Security & Protection (100 | 6.2%), Firefighting & Prevention (74 | 4.6%), Personal Care & Service (72 | 4.4%), Cleaning & Maintenance (64 | 4.0%), and Food Preparation & Serving (49 | 3.0%).
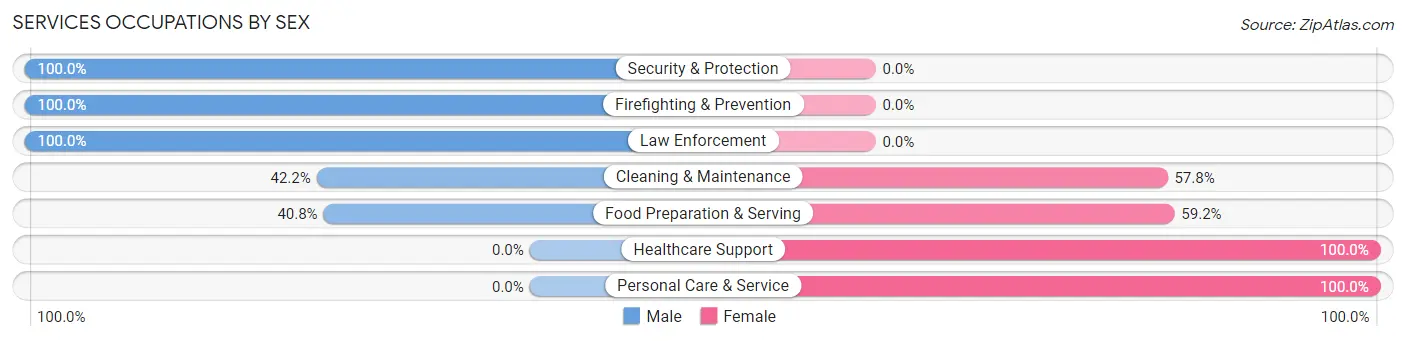
Services Occupations by Sex
Within the Services occupations in Lake Orion, the most male-oriented occupations are Security & Protection (100.0%), Firefighting & Prevention (100.0%), and Law Enforcement (100.0%), while the most female-oriented occupations are Healthcare Support (100.0%), Personal Care & Service (100.0%), and Food Preparation & Serving (59.2%).
| Occupation | Male | Female |
| Healthcare Support | 0 (0.0%) | 24 (100.0%) |
| Security & Protection | 100 (100.0%) | 0 (0.0%) |
| Firefighting & Prevention | 74 (100.0%) | 0 (0.0%) |
| Law Enforcement | 26 (100.0%) | 0 (0.0%) |
| Food Preparation & Serving | 20 (40.8%) | 29 (59.2%) |
| Cleaning & Maintenance | 27 (42.2%) | 37 (57.8%) |
| Personal Care & Service | 0 (0.0%) | 72 (100.0%) |
| Total (Category) | 147 (47.6%) | 162 (52.4%) |
| Total (Overall) | 798 (49.3%) | 821 (50.7%) |
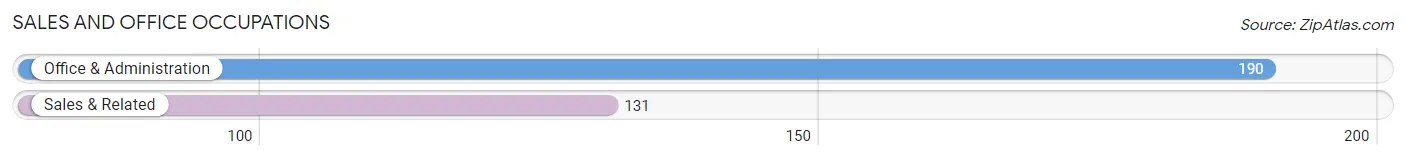
Sales and Office Occupations
The most common Sales and Office occupations in Lake Orion are Office & Administration (190 | 11.7%), and Sales & Related (131 | 8.1%).
Sales and Office Occupations by Sex
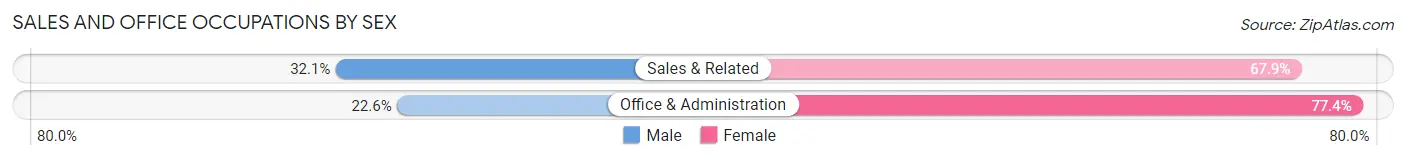
| Occupation | Male | Female |
| Sales & Related | 42 (32.1%) | 89 (67.9%) |
| Office & Administration | 43 (22.6%) | 147 (77.4%) |
| Total (Category) | 85 (26.5%) | 236 (73.5%) |
| Total (Overall) | 798 (49.3%) | 821 (50.7%) |
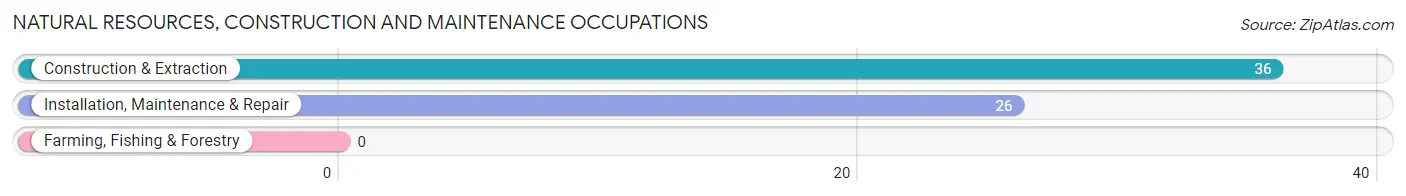
Natural Resources, Construction and Maintenance Occupations
The most common Natural Resources, Construction and Maintenance occupations in Lake Orion are Construction & Extraction (36 | 2.2%), and Installation, Maintenance & Repair (26 | 1.6%).
Natural Resources, Construction and Maintenance Occupations by Sex
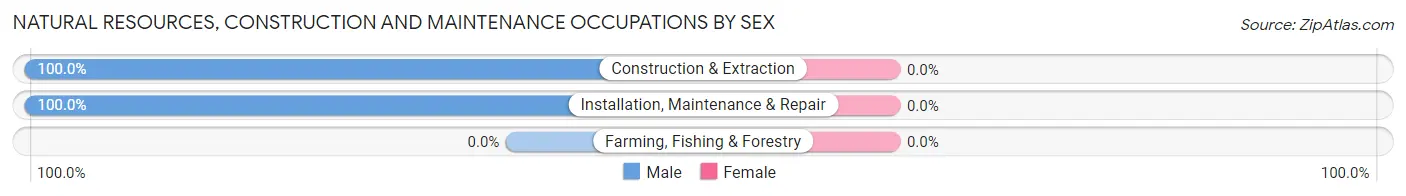
| Occupation | Male | Female |
| Farming, Fishing & Forestry | 0 (0.0%) | 0 (0.0%) |
| Construction & Extraction | 36 (100.0%) | 0 (0.0%) |
| Installation, Maintenance & Repair | 26 (100.0%) | 0 (0.0%) |
| Total (Category) | 62 (100.0%) | 0 (0.0%) |
| Total (Overall) | 798 (49.3%) | 821 (50.7%) |
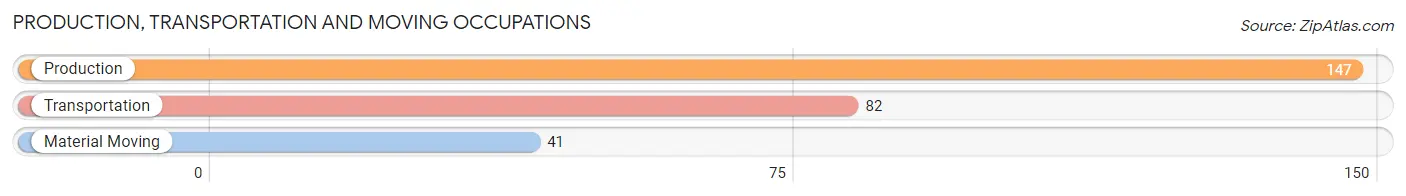
Production, Transportation and Moving Occupations
The most common Production, Transportation and Moving occupations in Lake Orion are Production (147 | 9.1%), Transportation (82 | 5.1%), and Material Moving (41 | 2.5%).
Production, Transportation and Moving Occupations by Sex
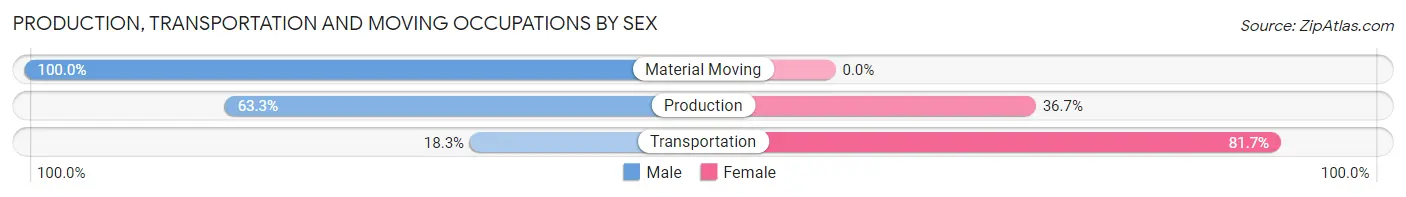
| Occupation | Male | Female |
| Production | 93 (63.3%) | 54 (36.7%) |
| Transportation | 15 (18.3%) | 67 (81.7%) |
| Material Moving | 41 (100.0%) | 0 (0.0%) |
| Total (Category) | 149 (55.2%) | 121 (44.8%) |
| Total (Overall) | 798 (49.3%) | 821 (50.7%) |
Employment Industries by Sex in Lake Orion
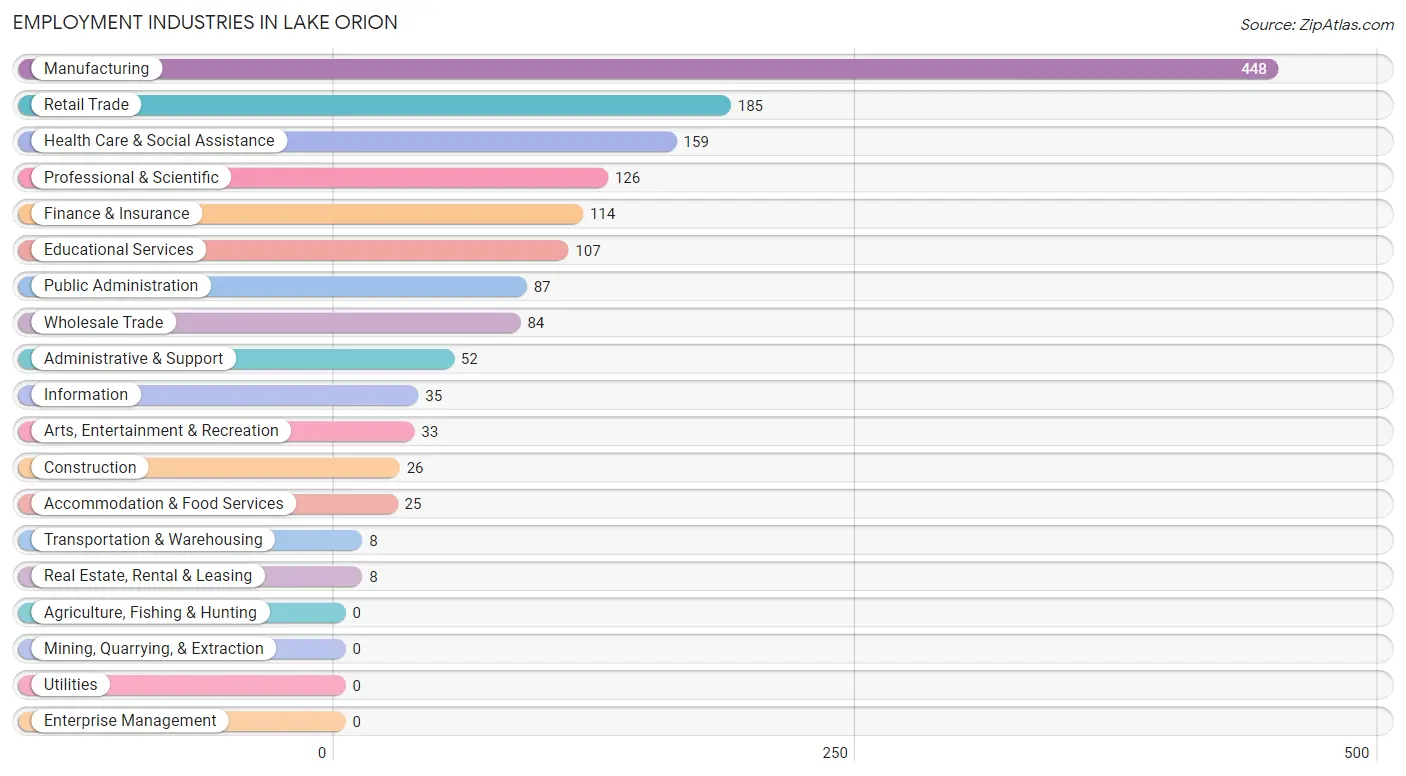
Employment Industries in Lake Orion
The major employment industries in Lake Orion include Manufacturing (448 | 27.7%), Retail Trade (185 | 11.4%), Health Care & Social Assistance (159 | 9.8%), Professional & Scientific (126 | 7.8%), and Finance & Insurance (114 | 7.0%).
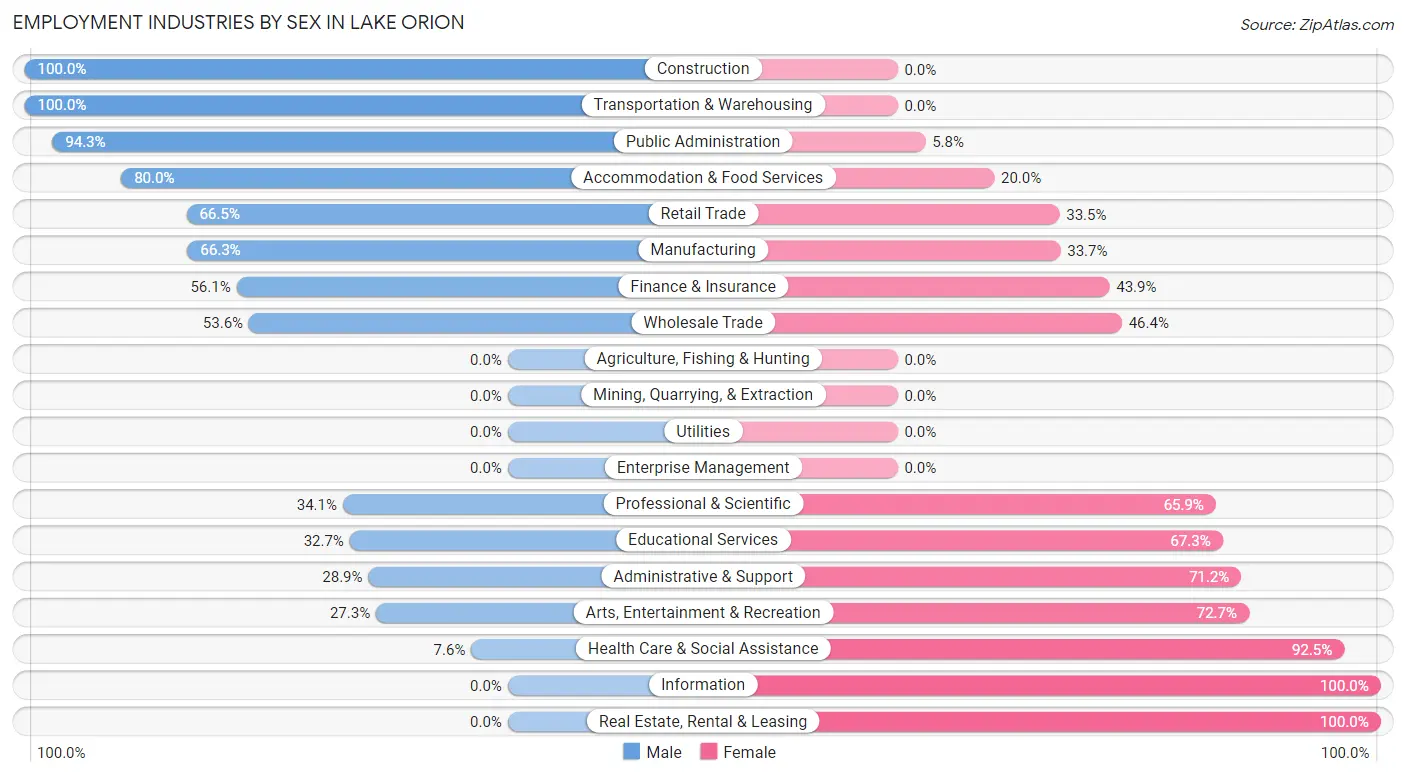
Employment Industries by Sex in Lake Orion
The Lake Orion industries that see more men than women are Construction (100.0%), Transportation & Warehousing (100.0%), and Public Administration (94.3%), whereas the industries that tend to have a higher number of women are Information (100.0%), Real Estate, Rental & Leasing (100.0%), and Health Care & Social Assistance (92.4%).
| Industry | Male | Female |
| Agriculture, Fishing & Hunting | 0 (0.0%) | 0 (0.0%) |
| Mining, Quarrying, & Extraction | 0 (0.0%) | 0 (0.0%) |
| Construction | 26 (100.0%) | 0 (0.0%) |
| Manufacturing | 297 (66.3%) | 151 (33.7%) |
| Wholesale Trade | 45 (53.6%) | 39 (46.4%) |
| Retail Trade | 123 (66.5%) | 62 (33.5%) |
| Transportation & Warehousing | 8 (100.0%) | 0 (0.0%) |
| Utilities | 0 (0.0%) | 0 (0.0%) |
| Information | 0 (0.0%) | 35 (100.0%) |
| Finance & Insurance | 64 (56.1%) | 50 (43.9%) |
| Real Estate, Rental & Leasing | 0 (0.0%) | 8 (100.0%) |
| Professional & Scientific | 43 (34.1%) | 83 (65.9%) |
| Enterprise Management | 0 (0.0%) | 0 (0.0%) |
| Administrative & Support | 15 (28.8%) | 37 (71.2%) |
| Educational Services | 35 (32.7%) | 72 (67.3%) |
| Health Care & Social Assistance | 12 (7.5%) | 147 (92.4%) |
| Arts, Entertainment & Recreation | 9 (27.3%) | 24 (72.7%) |
| Accommodation & Food Services | 20 (80.0%) | 5 (20.0%) |
| Public Administration | 82 (94.3%) | 5 (5.8%) |
| Total | 798 (49.3%) | 821 (50.7%) |
Education in Lake Orion
School Enrollment in Lake Orion
The most common levels of schooling among the 382 students in Lake Orion are elementary school (101 | 26.4%), high school (71 | 18.6%), and college / undergraduate (66 | 17.3%).
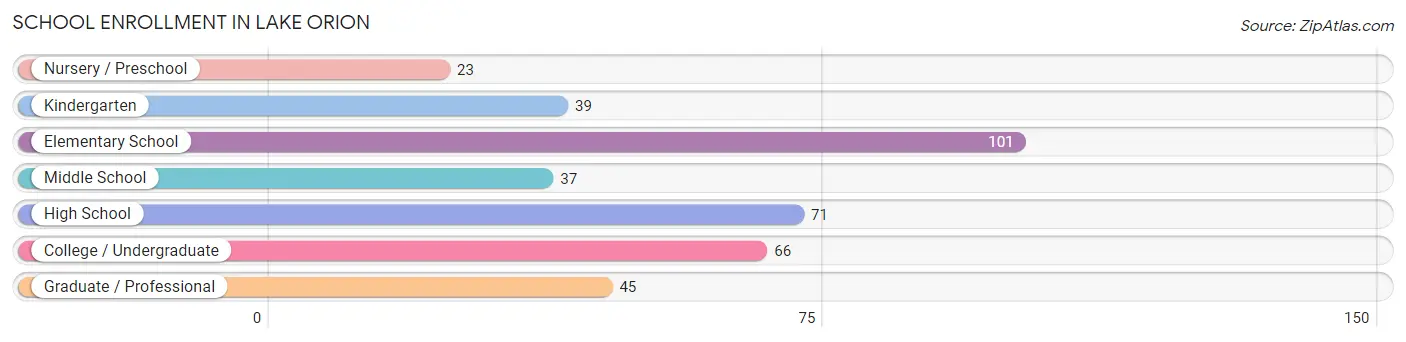
| School Level | # Students | % Students |
| Nursery / Preschool | 23 | 6.0% |
| Kindergarten | 39 | 10.2% |
| Elementary School | 101 | 26.4% |
| Middle School | 37 | 9.7% |
| High School | 71 | 18.6% |
| College / Undergraduate | 66 | 17.3% |
| Graduate / Professional | 45 | 11.8% |
| Total | 382 | 100.0% |
School Enrollment by Age by Funding Source in Lake Orion
Out of a total of 382 students who are enrolled in schools in Lake Orion, 32 (8.4%) attend a private institution, while the remaining 350 (91.6%) are enrolled in public schools. The age group of 3 to 4 year olds has the highest likelihood of being enrolled in private schools, with 14 (100.0% in the age bracket) enrolled. Conversely, the age group of 5 to 9 year old has the lowest likelihood of being enrolled in a private school, with 143 (100.0% in the age bracket) attending a public institution.
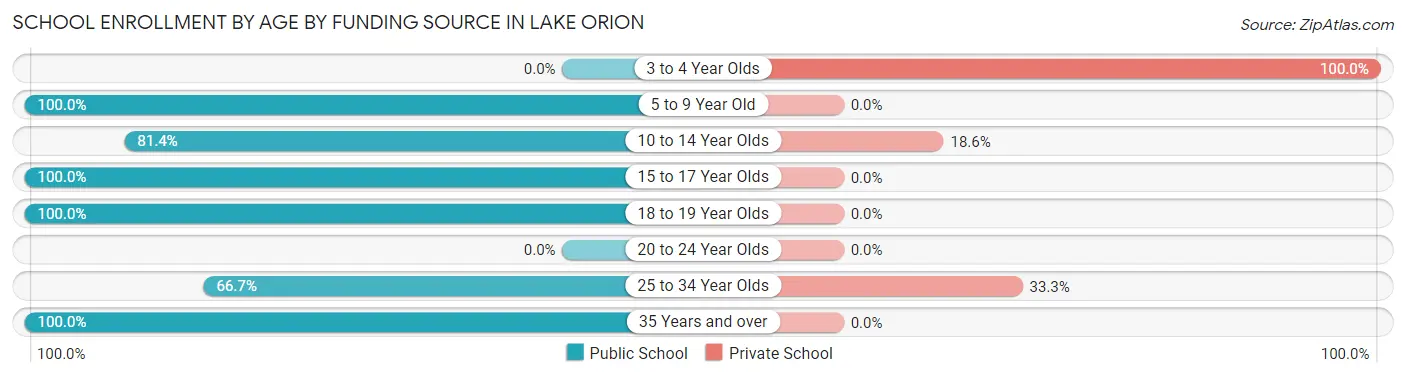
| Age Bracket | Public School | Private School |
| 3 to 4 Year Olds | 0 (0.0%) | 14 (100.0%) |
| 5 to 9 Year Old | 143 (100.0%) | 0 (0.0%) |
| 10 to 14 Year Olds | 35 (81.4%) | 8 (18.6%) |
| 15 to 17 Year Olds | 68 (100.0%) | 0 (0.0%) |
| 18 to 19 Year Olds | 51 (100.0%) | 0 (0.0%) |
| 20 to 24 Year Olds | 0 (0.0%) | 0 (0.0%) |
| 25 to 34 Year Olds | 20 (66.7%) | 10 (33.3%) |
| 35 Years and over | 33 (100.0%) | 0 (0.0%) |
| Total | 350 (91.6%) | 32 (8.4%) |
Educational Attainment by Field of Study in Lake Orion
Business (224 | 21.0%), communications (149 | 14.0%), engineering (117 | 11.0%), education (107 | 10.0%), and science & technology (78 | 7.3%) are the most common fields of study among 1,068 individuals in Lake Orion who have obtained a bachelor's degree or higher.
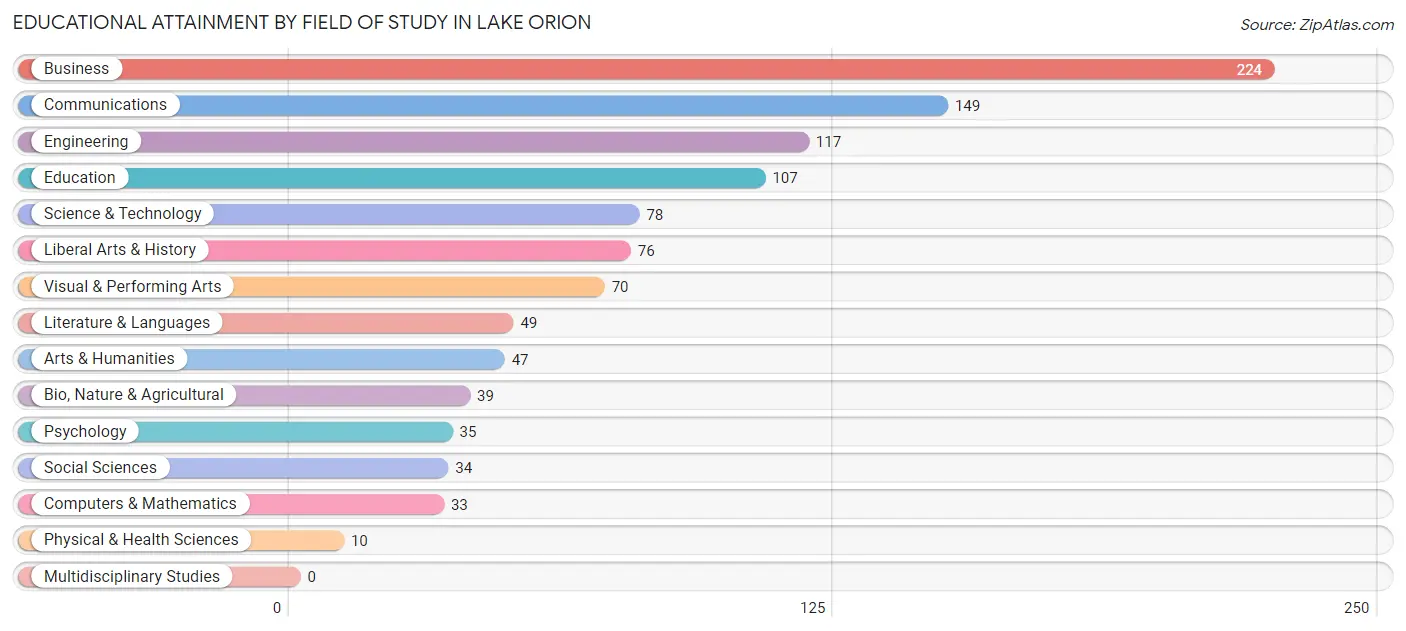
| Field of Study | # Graduates | % Graduates |
| Computers & Mathematics | 33 | 3.1% |
| Bio, Nature & Agricultural | 39 | 3.6% |
| Physical & Health Sciences | 10 | 0.9% |
| Psychology | 35 | 3.3% |
| Social Sciences | 34 | 3.2% |
| Engineering | 117 | 11.0% |
| Multidisciplinary Studies | 0 | 0.0% |
| Science & Technology | 78 | 7.3% |
| Business | 224 | 21.0% |
| Education | 107 | 10.0% |
| Literature & Languages | 49 | 4.6% |
| Liberal Arts & History | 76 | 7.1% |
| Visual & Performing Arts | 70 | 6.6% |
| Communications | 149 | 14.0% |
| Arts & Humanities | 47 | 4.4% |
| Total | 1,068 | 100.0% |
Transportation & Commute in Lake Orion
Vehicle Availability by Sex in Lake Orion
The most prevalent vehicle ownership categories in Lake Orion are males with 2 vehicles (397, accounting for 50.8%) and females with 2 vehicles (372, making up 48.4%).
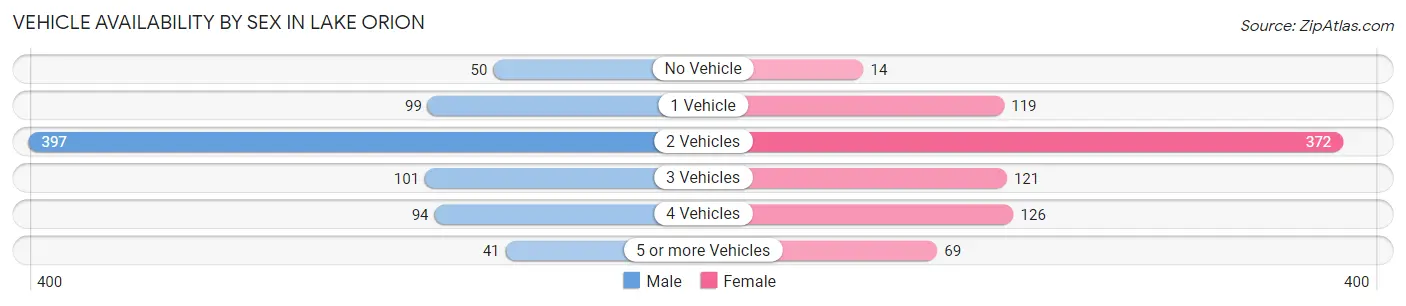
| Vehicles Available | Male | Female |
| No Vehicle | 50 (6.4%) | 14 (1.7%) |
| 1 Vehicle | 99 (12.7%) | 119 (14.5%) |
| 2 Vehicles | 397 (50.8%) | 372 (45.3%) |
| 3 Vehicles | 101 (12.9%) | 121 (14.7%) |
| 4 Vehicles | 94 (12.0%) | 126 (15.3%) |
| 5 or more Vehicles | 41 (5.2%) | 69 (8.4%) |
| Total | 782 (100.0%) | 821 (100.0%) |
Commute Time in Lake Orion
The most frequently occuring commute durations in Lake Orion are 30 to 34 minutes (343 commuters, 25.7%), 45 to 59 minutes (206 commuters, 15.4%), and 10 to 14 minutes (174 commuters, 13.0%).
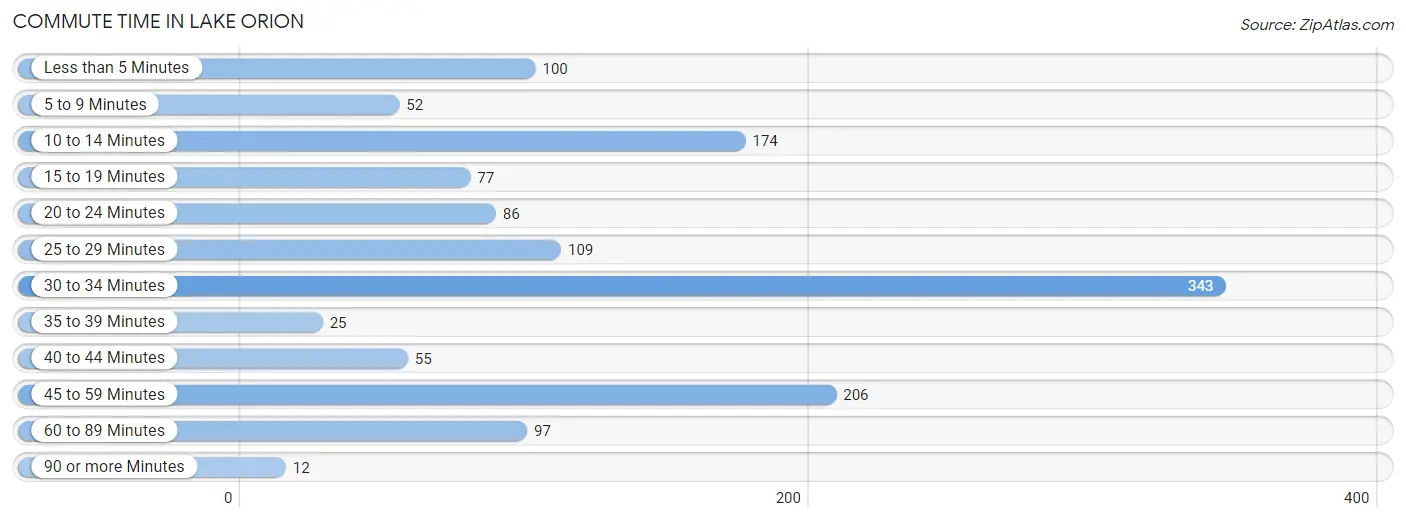
| Commute Time | # Commuters | % Commuters |
| Less than 5 Minutes | 100 | 7.5% |
| 5 to 9 Minutes | 52 | 3.9% |
| 10 to 14 Minutes | 174 | 13.0% |
| 15 to 19 Minutes | 77 | 5.8% |
| 20 to 24 Minutes | 86 | 6.4% |
| 25 to 29 Minutes | 109 | 8.2% |
| 30 to 34 Minutes | 343 | 25.7% |
| 35 to 39 Minutes | 25 | 1.9% |
| 40 to 44 Minutes | 55 | 4.1% |
| 45 to 59 Minutes | 206 | 15.4% |
| 60 to 89 Minutes | 97 | 7.3% |
| 90 or more Minutes | 12 | 0.9% |
Commute Time by Sex in Lake Orion
The most common commute times in Lake Orion are 30 to 34 minutes (201 commuters, 29.3%) for males and 30 to 34 minutes (142 commuters, 21.8%) for females.
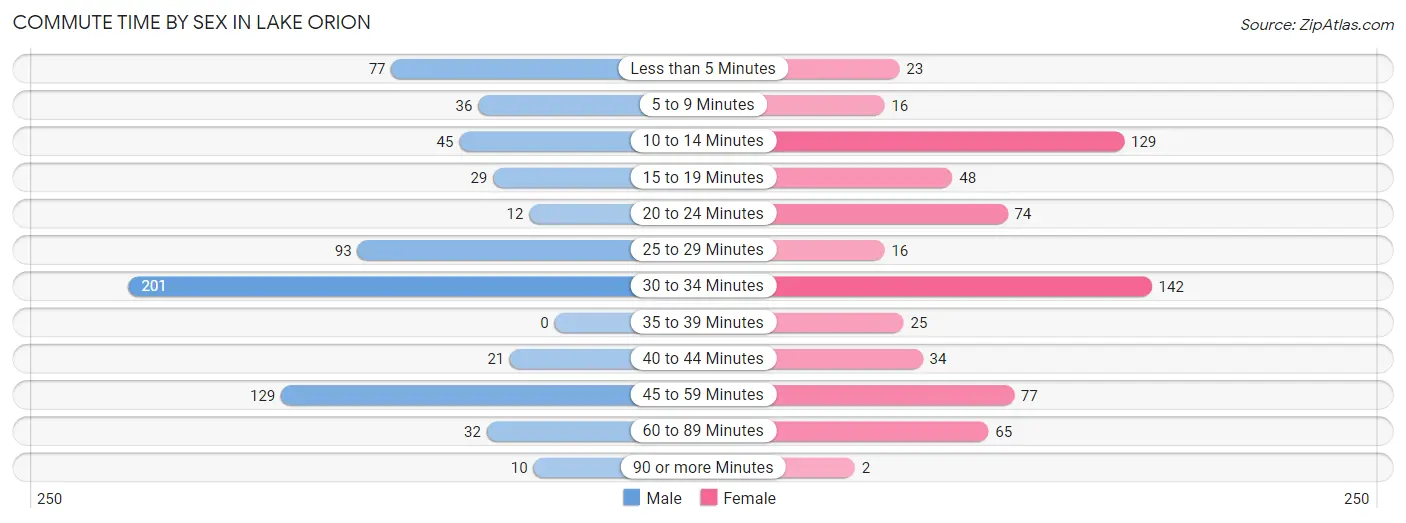
| Commute Time | Male | Female |
| Less than 5 Minutes | 77 (11.2%) | 23 (3.5%) |
| 5 to 9 Minutes | 36 (5.3%) | 16 (2.5%) |
| 10 to 14 Minutes | 45 (6.6%) | 129 (19.8%) |
| 15 to 19 Minutes | 29 (4.2%) | 48 (7.4%) |
| 20 to 24 Minutes | 12 (1.8%) | 74 (11.4%) |
| 25 to 29 Minutes | 93 (13.6%) | 16 (2.5%) |
| 30 to 34 Minutes | 201 (29.3%) | 142 (21.8%) |
| 35 to 39 Minutes | 0 (0.0%) | 25 (3.8%) |
| 40 to 44 Minutes | 21 (3.1%) | 34 (5.2%) |
| 45 to 59 Minutes | 129 (18.8%) | 77 (11.8%) |
| 60 to 89 Minutes | 32 (4.7%) | 65 (10.0%) |
| 90 or more Minutes | 10 (1.5%) | 2 (0.3%) |
Time of Departure to Work by Sex in Lake Orion
The most frequent times of departure to work in Lake Orion are 7:30 AM to 7:59 AM (130, 19.0%) for males and 7:30 AM to 7:59 AM (94, 14.4%) for females.
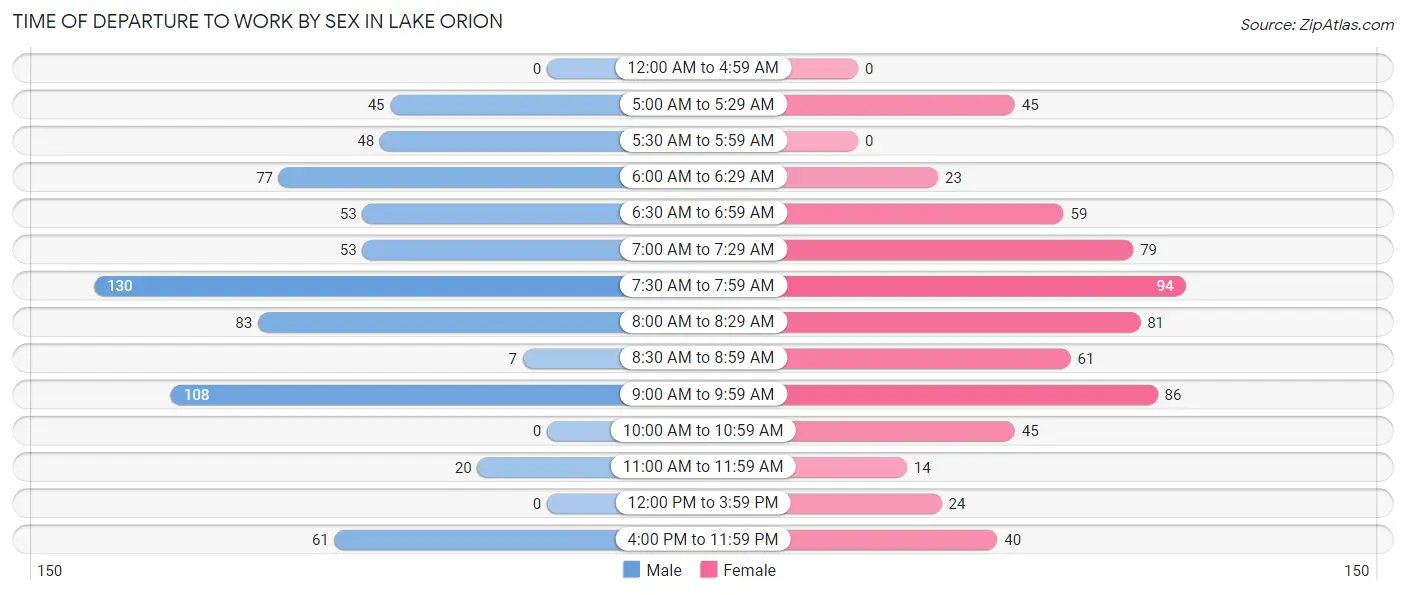
| Time of Departure | Male | Female |
| 12:00 AM to 4:59 AM | 0 (0.0%) | 0 (0.0%) |
| 5:00 AM to 5:29 AM | 45 (6.6%) | 45 (6.9%) |
| 5:30 AM to 5:59 AM | 48 (7.0%) | 0 (0.0%) |
| 6:00 AM to 6:29 AM | 77 (11.2%) | 23 (3.5%) |
| 6:30 AM to 6:59 AM | 53 (7.7%) | 59 (9.1%) |
| 7:00 AM to 7:29 AM | 53 (7.7%) | 79 (12.1%) |
| 7:30 AM to 7:59 AM | 130 (19.0%) | 94 (14.4%) |
| 8:00 AM to 8:29 AM | 83 (12.1%) | 81 (12.4%) |
| 8:30 AM to 8:59 AM | 7 (1.0%) | 61 (9.4%) |
| 9:00 AM to 9:59 AM | 108 (15.8%) | 86 (13.2%) |
| 10:00 AM to 10:59 AM | 0 (0.0%) | 45 (6.9%) |
| 11:00 AM to 11:59 AM | 20 (2.9%) | 14 (2.1%) |
| 12:00 PM to 3:59 PM | 0 (0.0%) | 24 (3.7%) |
| 4:00 PM to 11:59 PM | 61 (8.9%) | 40 (6.1%) |
| Total | 685 (100.0%) | 651 (100.0%) |
Housing Occupancy in Lake Orion
Occupancy by Ownership in Lake Orion
Of the total 1,239 dwellings in Lake Orion, owner-occupied units account for 889 (71.8%), while renter-occupied units make up 350 (28.2%).
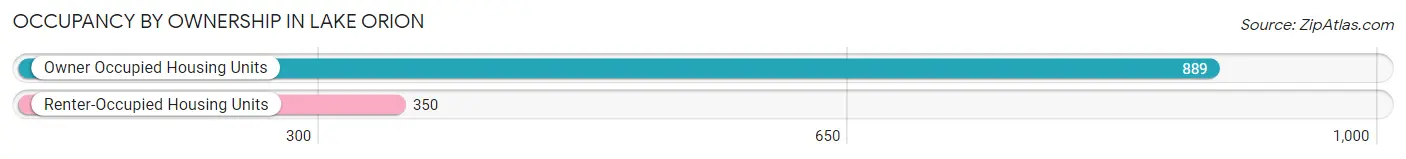
| Occupancy | # Housing Units | % Housing Units |
| Owner Occupied Housing Units | 889 | 71.8% |
| Renter-Occupied Housing Units | 350 | 28.2% |
| Total Occupied Housing Units | 1,239 | 100.0% |
Occupancy by Household Size in Lake Orion
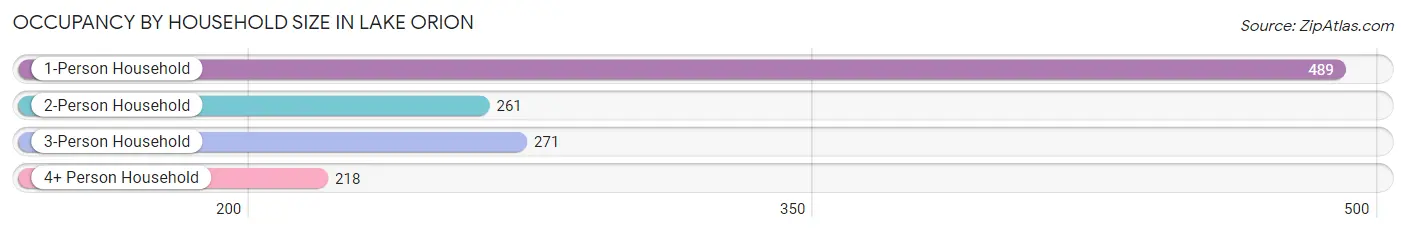
| Household Size | # Housing Units | % Housing Units |
| 1-Person Household | 489 | 39.5% |
| 2-Person Household | 261 | 21.1% |
| 3-Person Household | 271 | 21.9% |
| 4+ Person Household | 218 | 17.6% |
| Total Housing Units | 1,239 | 100.0% |
Occupancy by Ownership by Household Size in Lake Orion
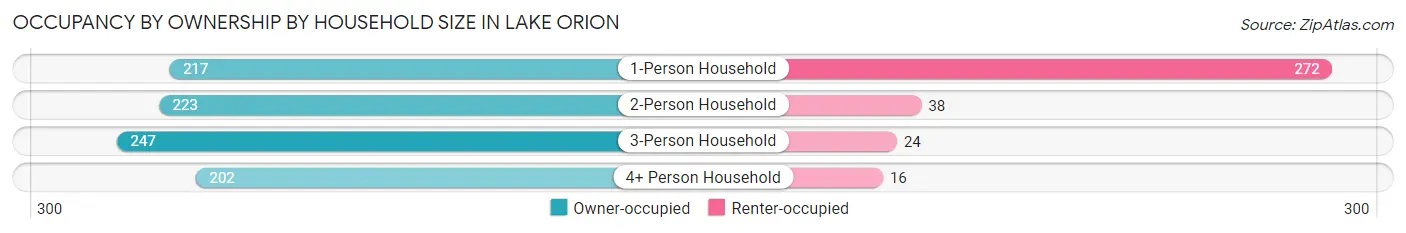
| Household Size | Owner-occupied | Renter-occupied |
| 1-Person Household | 217 (44.4%) | 272 (55.6%) |
| 2-Person Household | 223 (85.4%) | 38 (14.6%) |
| 3-Person Household | 247 (91.1%) | 24 (8.9%) |
| 4+ Person Household | 202 (92.7%) | 16 (7.3%) |
| Total Housing Units | 889 (71.8%) | 350 (28.2%) |
Occupancy by Educational Attainment in Lake Orion
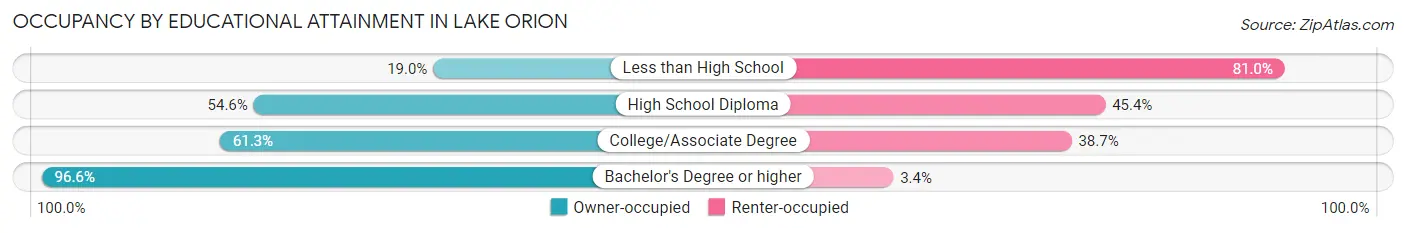
| Household Size | Owner-occupied | Renter-occupied |
| Less than High School | 15 (19.0%) | 64 (81.0%) |
| High School Diploma | 119 (54.6%) | 99 (45.4%) |
| College/Associate Degree | 269 (61.3%) | 170 (38.7%) |
| Bachelor's Degree or higher | 486 (96.6%) | 17 (3.4%) |
Occupancy by Age of Householder in Lake Orion
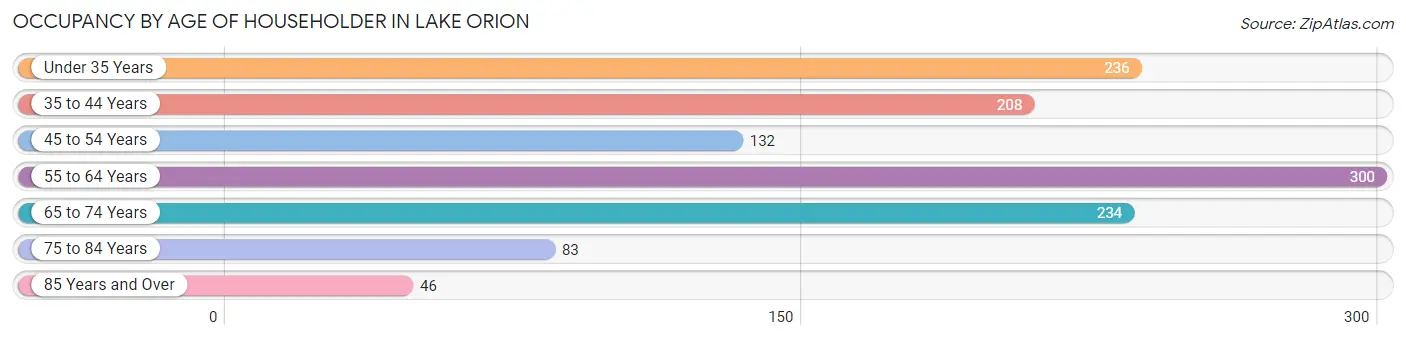
| Age Bracket | # Households | % Households |
| Under 35 Years | 236 | 19.1% |
| 35 to 44 Years | 208 | 16.8% |
| 45 to 54 Years | 132 | 10.6% |
| 55 to 64 Years | 300 | 24.2% |
| 65 to 74 Years | 234 | 18.9% |
| 75 to 84 Years | 83 | 6.7% |
| 85 Years and Over | 46 | 3.7% |
| Total | 1,239 | 100.0% |
Housing Finances in Lake Orion
Median Income by Occupancy in Lake Orion
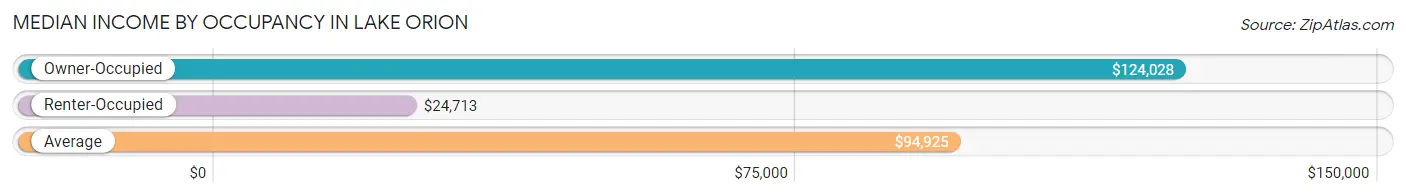
| Occupancy Type | # Households | Median Income |
| Owner-Occupied | 889 (71.8%) | $124,028 |
| Renter-Occupied | 350 (28.2%) | $24,713 |
| Average | 1,239 (100.0%) | $94,925 |
Occupancy by Householder Income Bracket in Lake Orion
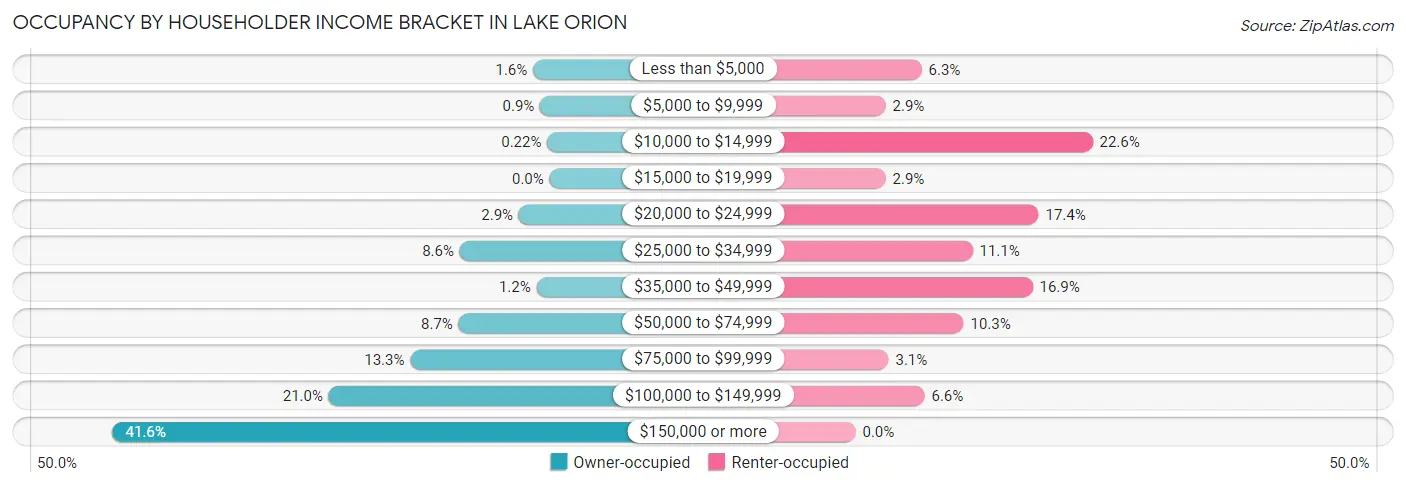
| Income Bracket | Owner-occupied | Renter-occupied |
| Less than $5,000 | 14 (1.6%) | 22 (6.3%) |
| $5,000 to $9,999 | 8 (0.9%) | 10 (2.9%) |
| $10,000 to $14,999 | 2 (0.2%) | 79 (22.6%) |
| $15,000 to $19,999 | 0 (0.0%) | 10 (2.9%) |
| $20,000 to $24,999 | 26 (2.9%) | 61 (17.4%) |
| $25,000 to $34,999 | 76 (8.6%) | 39 (11.1%) |
| $35,000 to $49,999 | 11 (1.2%) | 59 (16.9%) |
| $50,000 to $74,999 | 77 (8.7%) | 36 (10.3%) |
| $75,000 to $99,999 | 118 (13.3%) | 11 (3.1%) |
| $100,000 to $149,999 | 187 (21.0%) | 23 (6.6%) |
| $150,000 or more | 370 (41.6%) | 0 (0.0%) |
| Total | 889 (100.0%) | 350 (100.0%) |
Monthly Housing Cost Tiers in Lake Orion
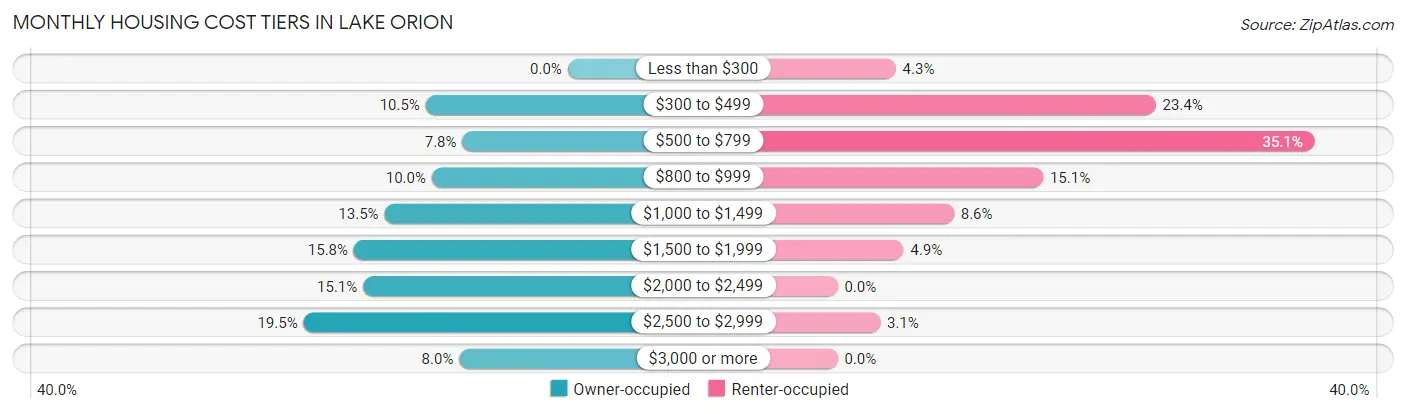
| Monthly Cost | Owner-occupied | Renter-occupied |
| Less than $300 | 0 (0.0%) | 15 (4.3%) |
| $300 to $499 | 93 (10.5%) | 82 (23.4%) |
| $500 to $799 | 69 (7.8%) | 123 (35.1%) |
| $800 to $999 | 89 (10.0%) | 53 (15.1%) |
| $1,000 to $1,499 | 120 (13.5%) | 30 (8.6%) |
| $1,500 to $1,999 | 140 (15.8%) | 17 (4.9%) |
| $2,000 to $2,499 | 134 (15.1%) | 0 (0.0%) |
| $2,500 to $2,999 | 173 (19.5%) | 11 (3.1%) |
| $3,000 or more | 71 (8.0%) | 0 (0.0%) |
| Total | 889 (100.0%) | 350 (100.0%) |
Physical Housing Characteristics in Lake Orion
Housing Structures in Lake Orion
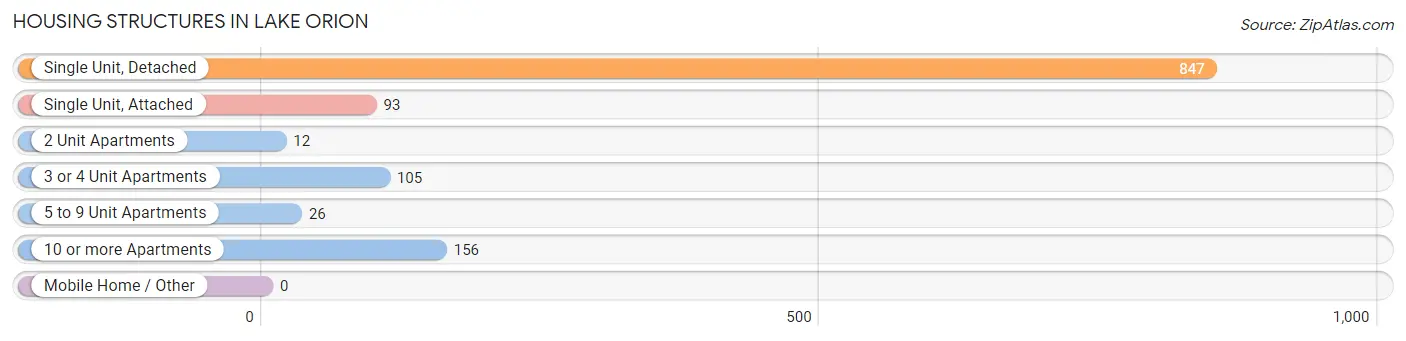
| Structure Type | # Housing Units | % Housing Units |
| Single Unit, Detached | 847 | 68.4% |
| Single Unit, Attached | 93 | 7.5% |
| 2 Unit Apartments | 12 | 1.0% |
| 3 or 4 Unit Apartments | 105 | 8.5% |
| 5 to 9 Unit Apartments | 26 | 2.1% |
| 10 or more Apartments | 156 | 12.6% |
| Mobile Home / Other | 0 | 0.0% |
| Total | 1,239 | 100.0% |
Housing Structures by Occupancy in Lake Orion
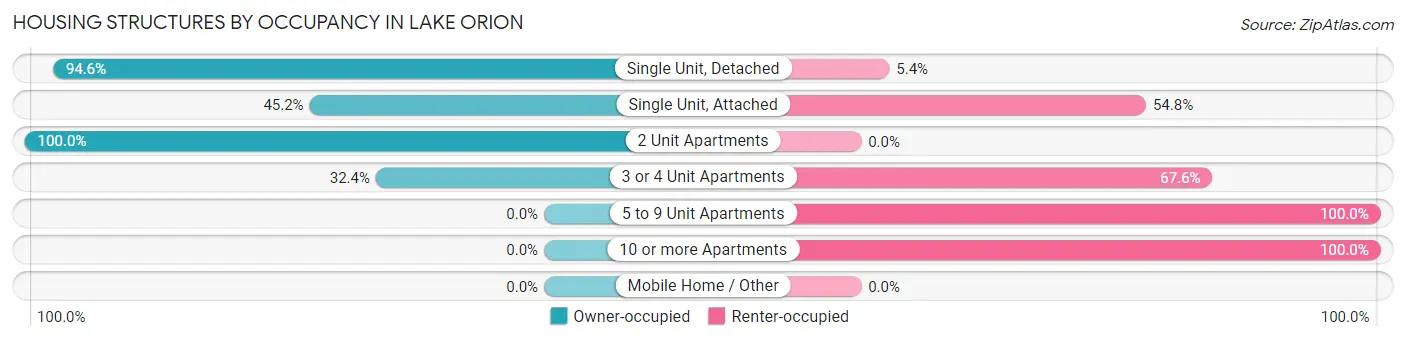
| Structure Type | Owner-occupied | Renter-occupied |
| Single Unit, Detached | 801 (94.6%) | 46 (5.4%) |
| Single Unit, Attached | 42 (45.2%) | 51 (54.8%) |
| 2 Unit Apartments | 12 (100.0%) | 0 (0.0%) |
| 3 or 4 Unit Apartments | 34 (32.4%) | 71 (67.6%) |
| 5 to 9 Unit Apartments | 0 (0.0%) | 26 (100.0%) |
| 10 or more Apartments | 0 (0.0%) | 156 (100.0%) |
| Mobile Home / Other | 0 (0.0%) | 0 (0.0%) |
| Total | 889 (71.8%) | 350 (28.2%) |
Housing Structures by Number of Rooms in Lake Orion
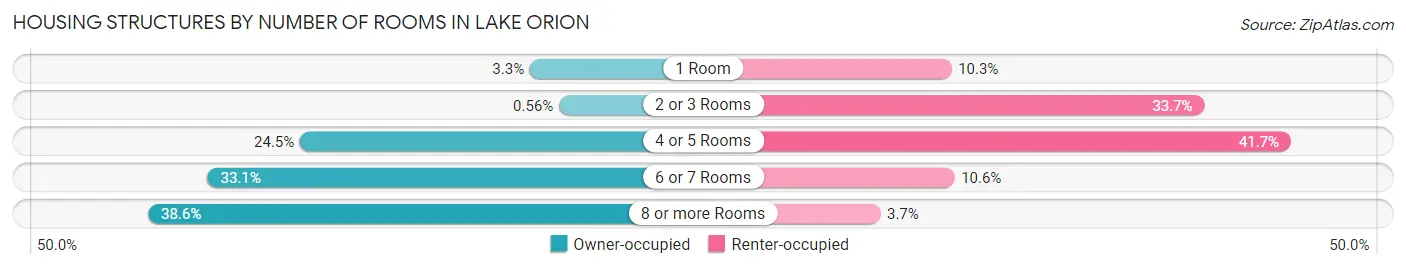
| Number of Rooms | Owner-occupied | Renter-occupied |
| 1 Room | 29 (3.3%) | 36 (10.3%) |
| 2 or 3 Rooms | 5 (0.6%) | 118 (33.7%) |
| 4 or 5 Rooms | 218 (24.5%) | 146 (41.7%) |
| 6 or 7 Rooms | 294 (33.1%) | 37 (10.6%) |
| 8 or more Rooms | 343 (38.6%) | 13 (3.7%) |
| Total | 889 (100.0%) | 350 (100.0%) |
Housing Structure by Heating Type in Lake Orion
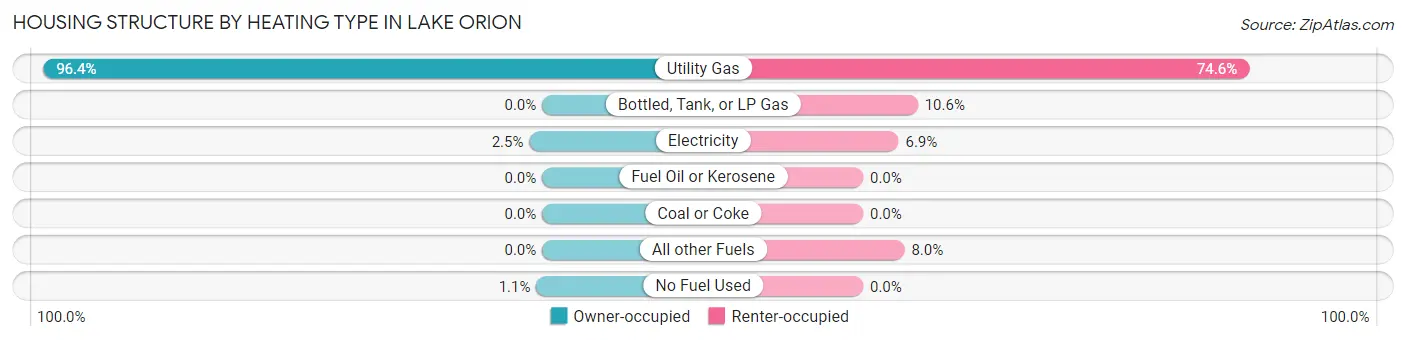
| Heating Type | Owner-occupied | Renter-occupied |
| Utility Gas | 857 (96.4%) | 261 (74.6%) |
| Bottled, Tank, or LP Gas | 0 (0.0%) | 37 (10.6%) |
| Electricity | 22 (2.5%) | 24 (6.9%) |
| Fuel Oil or Kerosene | 0 (0.0%) | 0 (0.0%) |
| Coal or Coke | 0 (0.0%) | 0 (0.0%) |
| All other Fuels | 0 (0.0%) | 28 (8.0%) |
| No Fuel Used | 10 (1.1%) | 0 (0.0%) |
| Total | 889 (100.0%) | 350 (100.0%) |
Household Vehicle Usage in Lake Orion
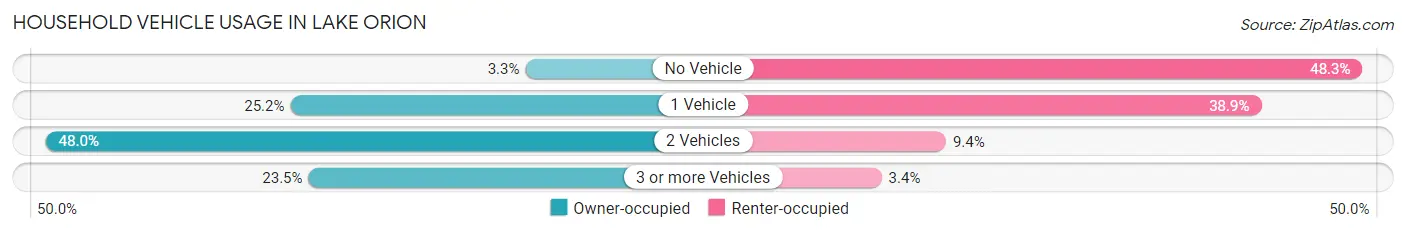
| Vehicles per Household | Owner-occupied | Renter-occupied |
| No Vehicle | 29 (3.3%) | 169 (48.3%) |
| 1 Vehicle | 224 (25.2%) | 136 (38.9%) |
| 2 Vehicles | 427 (48.0%) | 33 (9.4%) |
| 3 or more Vehicles | 209 (23.5%) | 12 (3.4%) |
| Total | 889 (100.0%) | 350 (100.0%) |
Real Estate & Mortgages in Lake Orion
Real Estate and Mortgage Overview in Lake Orion
| Characteristic | Without Mortgage | With Mortgage |
| Housing Units | 304 | 585 |
| Median Property Value | $259,300 | $375,300 |
| Median Household Income | $93,397 | $284 |
| Monthly Housing Costs | $738 | $71 |
| Real Estate Taxes | $4,111 | $26 |
Property Value by Mortgage Status in Lake Orion
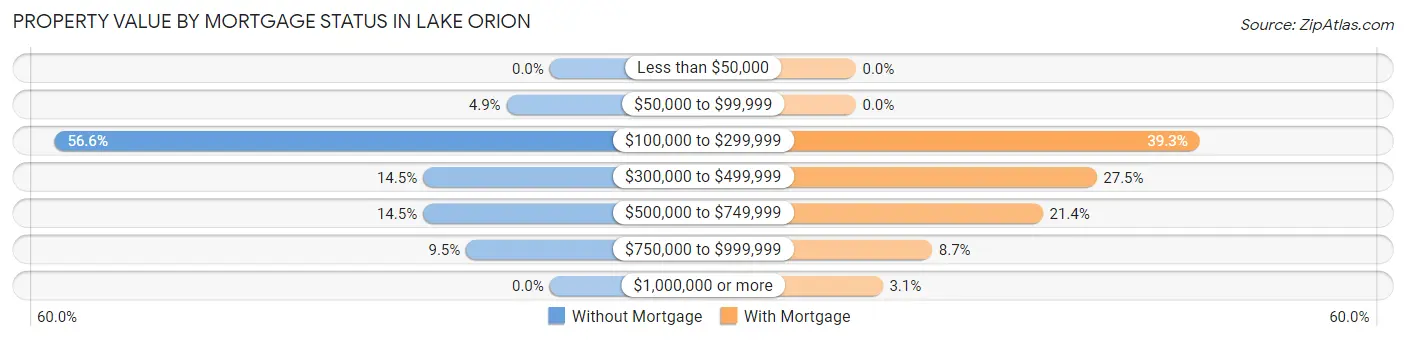
| Property Value | Without Mortgage | With Mortgage |
| Less than $50,000 | 0 (0.0%) | 0 (0.0%) |
| $50,000 to $99,999 | 15 (4.9%) | 0 (0.0%) |
| $100,000 to $299,999 | 172 (56.6%) | 230 (39.3%) |
| $300,000 to $499,999 | 44 (14.5%) | 161 (27.5%) |
| $500,000 to $749,999 | 44 (14.5%) | 125 (21.4%) |
| $750,000 to $999,999 | 29 (9.5%) | 51 (8.7%) |
| $1,000,000 or more | 0 (0.0%) | 18 (3.1%) |
| Total | 304 (100.0%) | 585 (100.0%) |
Household Income by Mortgage Status in Lake Orion
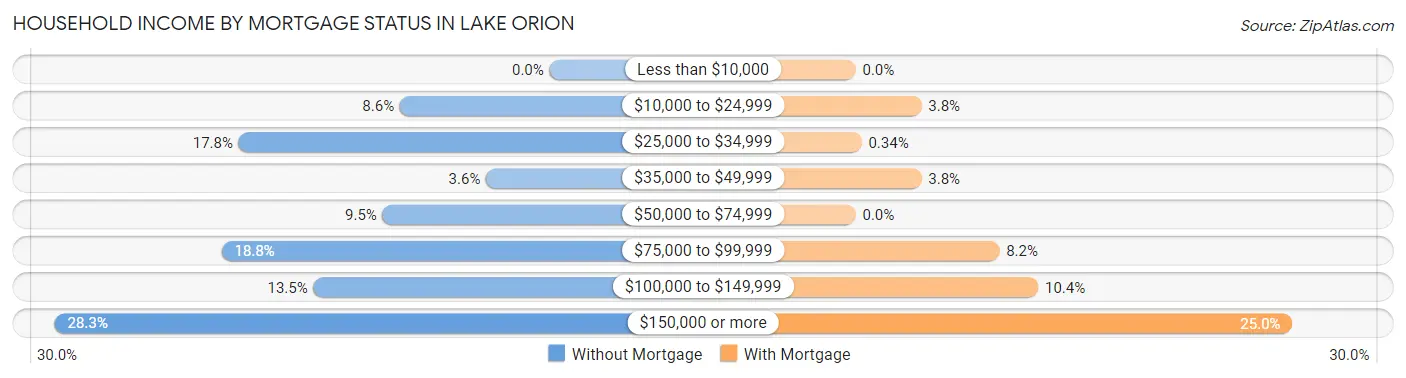
| Household Income | Without Mortgage | With Mortgage |
| Less than $10,000 | 0 (0.0%) | 0 (0.0%) |
| $10,000 to $24,999 | 26 (8.6%) | 22 (3.8%) |
| $25,000 to $34,999 | 54 (17.8%) | 2 (0.3%) |
| $35,000 to $49,999 | 11 (3.6%) | 22 (3.8%) |
| $50,000 to $74,999 | 29 (9.5%) | 0 (0.0%) |
| $75,000 to $99,999 | 57 (18.8%) | 48 (8.2%) |
| $100,000 to $149,999 | 41 (13.5%) | 61 (10.4%) |
| $150,000 or more | 86 (28.3%) | 146 (25.0%) |
| Total | 304 (100.0%) | 585 (100.0%) |
Property Value to Household Income Ratio in Lake Orion
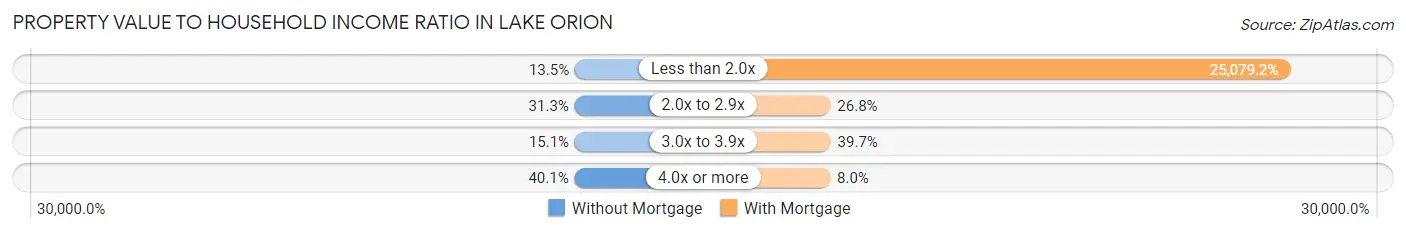
| Value-to-Income Ratio | Without Mortgage | With Mortgage |
| Less than 2.0x | 41 (13.5%) | 146,713 (25,079.2%) |
| 2.0x to 2.9x | 95 (31.2%) | 157 (26.8%) |
| 3.0x to 3.9x | 46 (15.1%) | 232 (39.7%) |
| 4.0x or more | 122 (40.1%) | 47 (8.0%) |
| Total | 304 (100.0%) | 585 (100.0%) |
Real Estate Taxes by Mortgage Status in Lake Orion
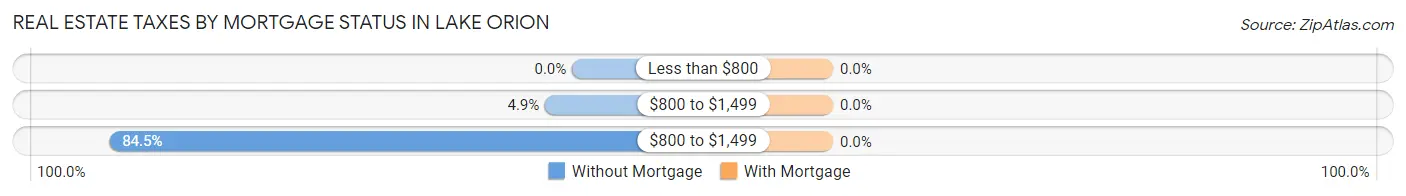
| Property Taxes | Without Mortgage | With Mortgage |
| Less than $800 | 0 (0.0%) | 0 (0.0%) |
| $800 to $1,499 | 15 (4.9%) | 0 (0.0%) |
| $800 to $1,499 | 257 (84.5%) | 0 (0.0%) |
| Total | 304 (100.0%) | 585 (100.0%) |
Health & Disability in Lake Orion
Health Insurance Coverage by Age in Lake Orion

| Age Bracket | With Coverage | Without Coverage |
| Under 6 Years | 245 (95.3%) | 12 (4.7%) |
| 6 to 18 Years | 236 (91.1%) | 23 (8.9%) |
| 19 to 25 Years | 298 (100.0%) | 0 (0.0%) |
| 26 to 34 Years | 378 (97.9%) | 8 (2.1%) |
| 35 to 44 Years | 329 (88.4%) | 43 (11.6%) |
| 45 to 54 Years | 268 (100.0%) | 0 (0.0%) |
| 55 to 64 Years | 446 (97.6%) | 11 (2.4%) |
| 65 to 74 Years | 302 (100.0%) | 0 (0.0%) |
| 75 Years and older | 209 (100.0%) | 0 (0.0%) |
| Total | 2,711 (96.6%) | 97 (3.5%) |
Health Insurance Coverage by Citizenship Status in Lake Orion
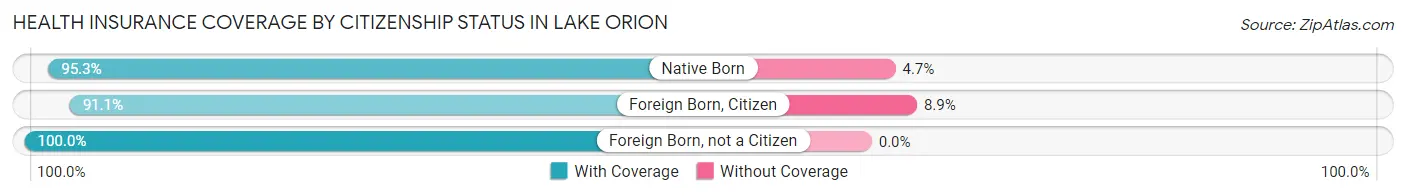
| Citizenship Status | With Coverage | Without Coverage |
| Native Born | 245 (95.3%) | 12 (4.7%) |
| Foreign Born, Citizen | 236 (91.1%) | 23 (8.9%) |
| Foreign Born, not a Citizen | 298 (100.0%) | 0 (0.0%) |
Health Insurance Coverage by Household Income in Lake Orion
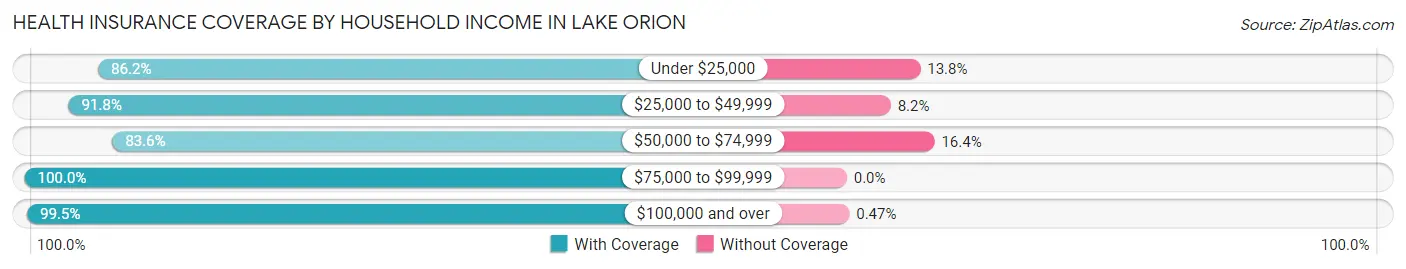
| Household Income | With Coverage | Without Coverage |
| Under $25,000 | 213 (86.2%) | 34 (13.8%) |
| $25,000 to $49,999 | 223 (91.8%) | 20 (8.2%) |
| $50,000 to $74,999 | 178 (83.6%) | 35 (16.4%) |
| $75,000 to $99,999 | 408 (100.0%) | 0 (0.0%) |
| $100,000 and over | 1,689 (99.5%) | 8 (0.5%) |
Public vs Private Health Insurance Coverage by Age in Lake Orion
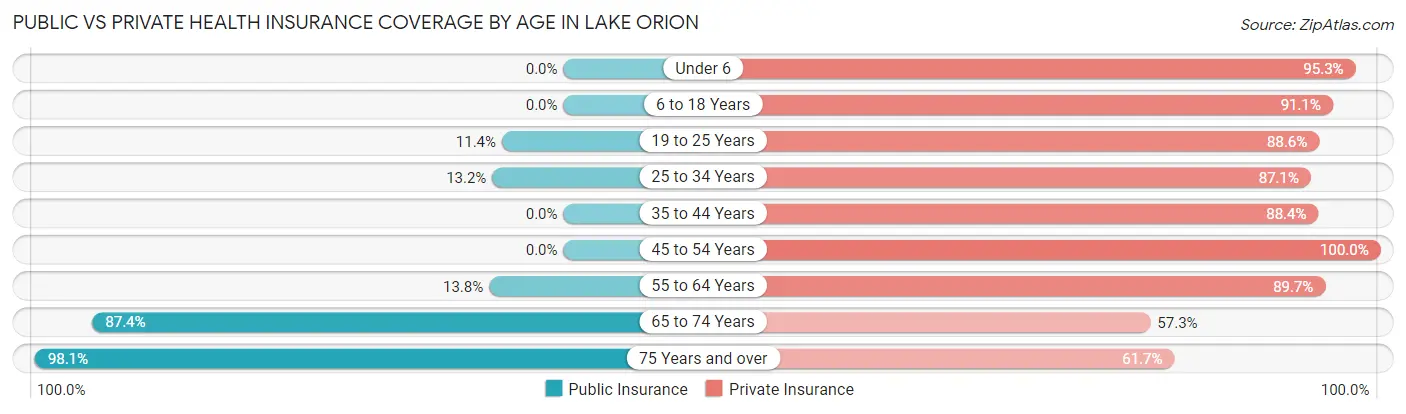
| Age Bracket | Public Insurance | Private Insurance |
| Under 6 | 0 (0.0%) | 245 (95.3%) |
| 6 to 18 Years | 0 (0.0%) | 236 (91.1%) |
| 19 to 25 Years | 34 (11.4%) | 264 (88.6%) |
| 25 to 34 Years | 51 (13.2%) | 336 (87.1%) |
| 35 to 44 Years | 0 (0.0%) | 329 (88.4%) |
| 45 to 54 Years | 0 (0.0%) | 268 (100.0%) |
| 55 to 64 Years | 63 (13.8%) | 410 (89.7%) |
| 65 to 74 Years | 264 (87.4%) | 173 (57.3%) |
| 75 Years and over | 205 (98.1%) | 129 (61.7%) |
| Total | 617 (22.0%) | 2,390 (85.1%) |
Disability Status by Sex by Age in Lake Orion
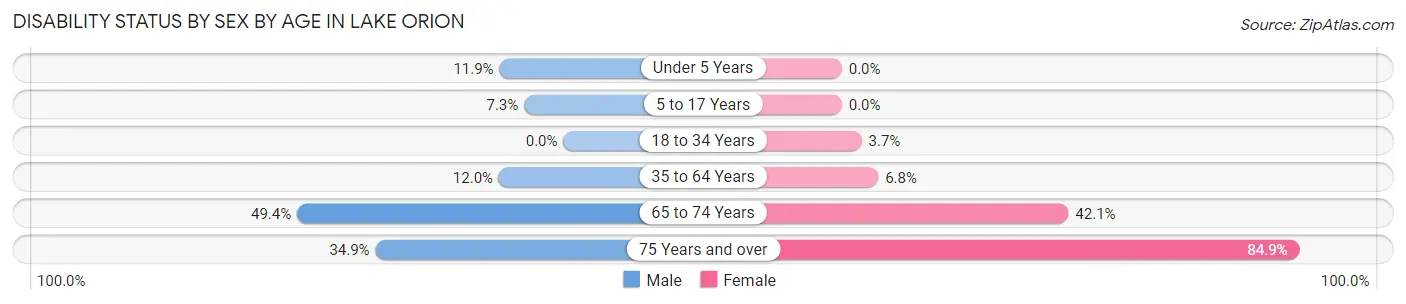
| Age Bracket | Male | Female |
| Under 5 Years | 14 (11.9%) | 0 (0.0%) |
| 5 to 17 Years | 11 (7.3%) | 0 (0.0%) |
| 18 to 34 Years | 0 (0.0%) | 16 (3.7%) |
| 35 to 64 Years | 64 (12.0%) | 38 (6.8%) |
| 65 to 74 Years | 87 (49.4%) | 53 (42.1%) |
| 75 Years and over | 15 (34.9%) | 141 (84.9%) |
Disability Class by Sex by Age in Lake Orion
Disability Class: Hearing Difficulty
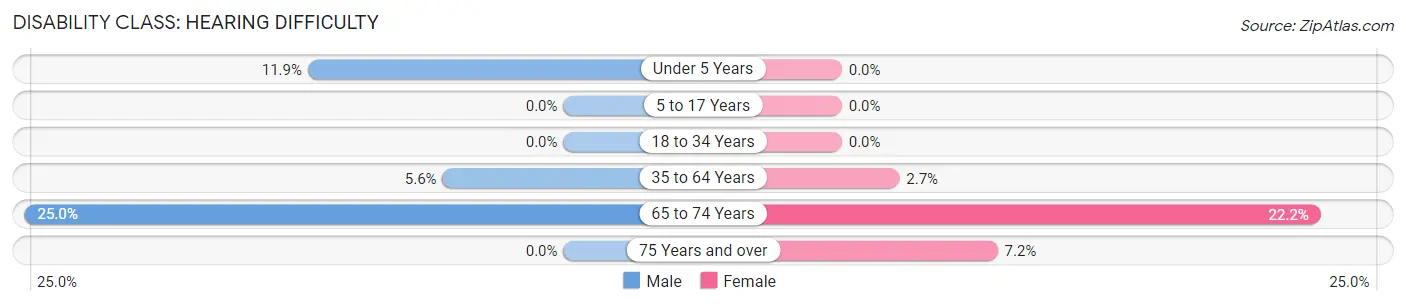
| Age Bracket | Male | Female |
| Under 5 Years | 14 (11.9%) | 0 (0.0%) |
| 5 to 17 Years | 0 (0.0%) | 0 (0.0%) |
| 18 to 34 Years | 0 (0.0%) | 0 (0.0%) |
| 35 to 64 Years | 30 (5.6%) | 15 (2.7%) |
| 65 to 74 Years | 44 (25.0%) | 28 (22.2%) |
| 75 Years and over | 0 (0.0%) | 12 (7.2%) |
Disability Class: Vision Difficulty
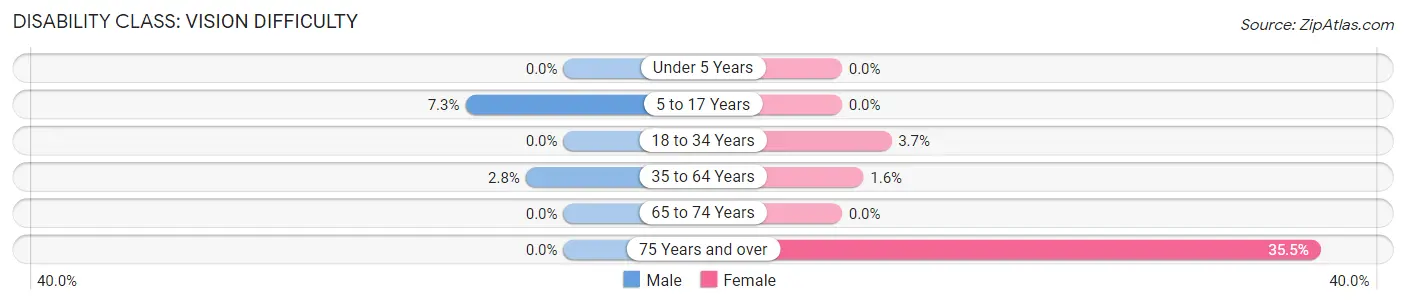
| Age Bracket | Male | Female |
| Under 5 Years | 0 (0.0%) | 0 (0.0%) |
| 5 to 17 Years | 11 (7.3%) | 0 (0.0%) |
| 18 to 34 Years | 0 (0.0%) | 16 (3.7%) |
| 35 to 64 Years | 15 (2.8%) | 9 (1.6%) |
| 65 to 74 Years | 0 (0.0%) | 0 (0.0%) |
| 75 Years and over | 0 (0.0%) | 59 (35.5%) |
Disability Class: Cognitive Difficulty
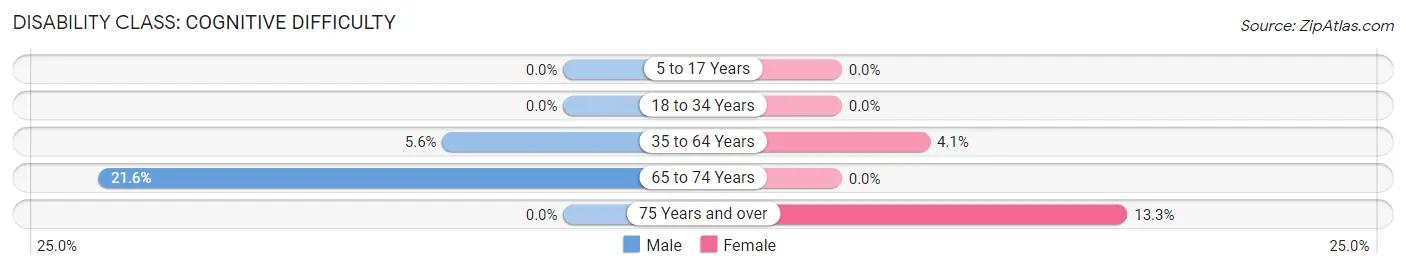
| Age Bracket | Male | Female |
| 5 to 17 Years | 0 (0.0%) | 0 (0.0%) |
| 18 to 34 Years | 0 (0.0%) | 0 (0.0%) |
| 35 to 64 Years | 30 (5.6%) | 23 (4.1%) |
| 65 to 74 Years | 38 (21.6%) | 0 (0.0%) |
| 75 Years and over | 0 (0.0%) | 22 (13.3%) |
Disability Class: Ambulatory Difficulty
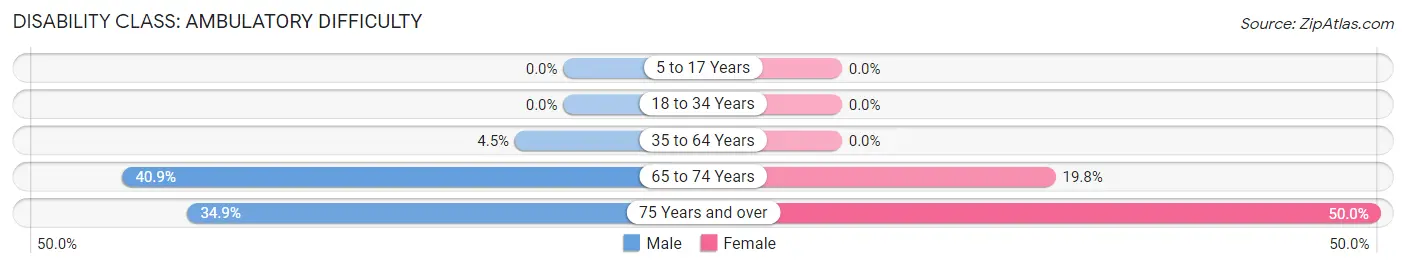
| Age Bracket | Male | Female |
| 5 to 17 Years | 0 (0.0%) | 0 (0.0%) |
| 18 to 34 Years | 0 (0.0%) | 0 (0.0%) |
| 35 to 64 Years | 24 (4.5%) | 0 (0.0%) |
| 65 to 74 Years | 72 (40.9%) | 25 (19.8%) |
| 75 Years and over | 15 (34.9%) | 83 (50.0%) |
Disability Class: Self-Care Difficulty
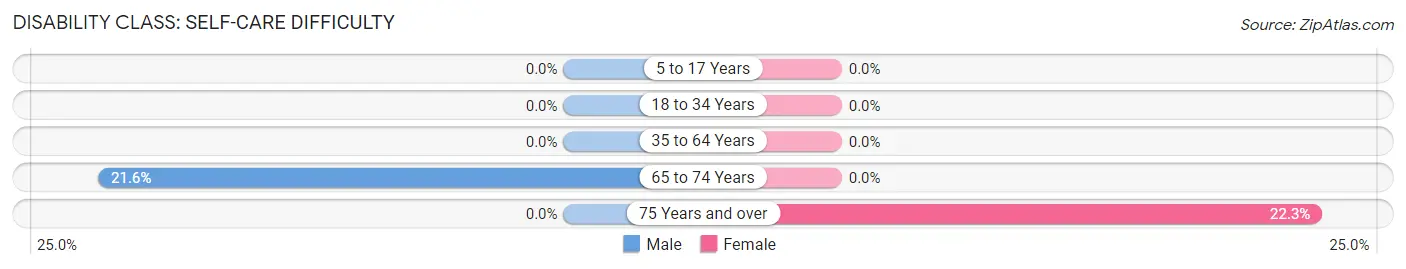
| Age Bracket | Male | Female |
| 5 to 17 Years | 0 (0.0%) | 0 (0.0%) |
| 18 to 34 Years | 0 (0.0%) | 0 (0.0%) |
| 35 to 64 Years | 0 (0.0%) | 0 (0.0%) |
| 65 to 74 Years | 38 (21.6%) | 0 (0.0%) |
| 75 Years and over | 0 (0.0%) | 37 (22.3%) |
Technology Access in Lake Orion
Computing Device Access in Lake Orion
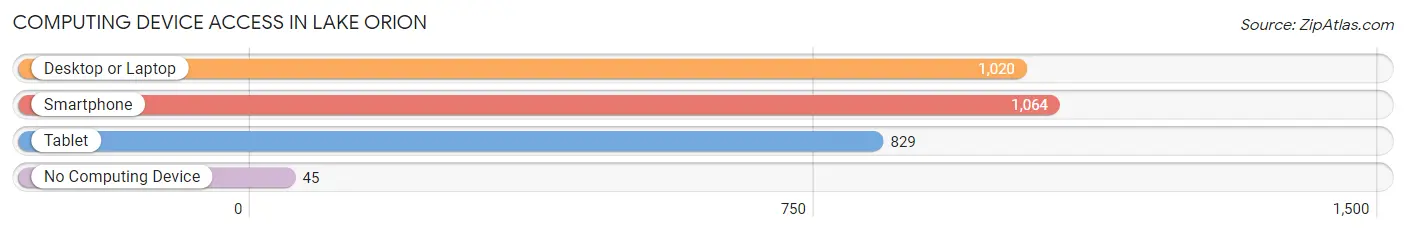
| Device Type | # Households | % Households |
| Desktop or Laptop | 1,020 | 82.3% |
| Smartphone | 1,064 | 85.9% |
| Tablet | 829 | 66.9% |
| No Computing Device | 45 | 3.6% |
| Total | 1,239 | 100.0% |
Internet Access in Lake Orion
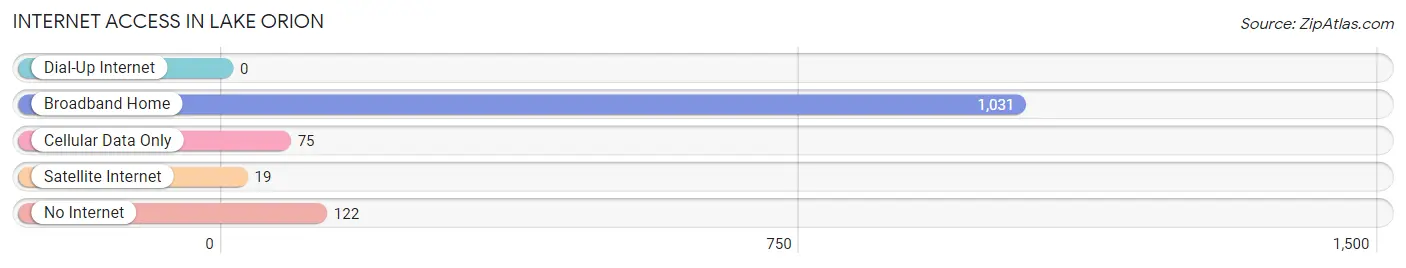
| Internet Type | # Households | % Households |
| Dial-Up Internet | 0 | 0.0% |
| Broadband Home | 1,031 | 83.2% |
| Cellular Data Only | 75 | 6.0% |
| Satellite Internet | 19 | 1.5% |
| No Internet | 122 | 9.9% |
| Total | 1,239 | 100.0% |
Lake Orion Summary
History
The area now known as Lake Orion was first inhabited by the Potawatomi Native Americans. The first white settlers arrived in the area in 1819, and the first permanent settler was a man named John Askin, who arrived in 1824. Askin built a trading post and a sawmill on the banks of the lake, which was then known as Askin's Lake. The lake was later renamed Lake Orion, after the Greek mythological hunter Orion.
In 1832, the first post office was established in the area, and the village of Orion was officially incorporated in 1869. The village was named after the lake, and the first mayor was John Askin.
In the late 19th century, the village of Orion began to grow rapidly, and by the early 20th century, it had become a popular summer resort destination. The village was home to several hotels, resorts, and amusement parks, and it was a popular destination for fishing and boating.
In the 1950s, the village of Orion was annexed by the city of Lake Orion, which was incorporated in 1959. The city was named after the lake, and it quickly grew in population and size. By the 2000s, Lake Orion had become a popular bedroom community for Detroit, and it had a population of over 3,000 people.
Geography
Lake Orion is located in Oakland County, Michigan, about 30 miles north of Detroit. The city is situated on the banks of Lake Orion, a small lake that is part of the Clinton River watershed. The city is surrounded by several smaller lakes, including Lakeville Lake, Silver Lake, and Lakeville Pond.
The city has a total area of 4.2 square miles, of which 3.9 square miles is land and 0.3 square miles is water. The terrain is mostly flat, with some rolling hills in the northern part of the city.
Economy
The economy of Lake Orion is largely based on manufacturing and retail. The city is home to several large manufacturing companies, including General Motors, Chrysler, and Ford. The city is also home to several retail stores, including Walmart, Target, and Meijer.
The city is also home to several small businesses, including restaurants, bars, and shops. The city is also home to several medical facilities, including a hospital and several clinics.
Demographics
As of the 2010 census, the population of Lake Orion was 3,459. The racial makeup of the city was 94.2% White, 1.7% African American, 0.3% Native American, 1.2% Asian, 0.1% Pacific Islander, 0.7% from other races, and 1.9% from two or more races. Hispanic or Latino of any race were 2.3% of the population.
The median household income in Lake Orion was $60,945, and the median family income was $71,917. The per capita income for the city was $30,945. About 4.3% of families and 5.7% of the population were below the poverty line, including 8.2% of those under age 18 and 4.2% of those age 65 or over.
Common Questions
What is Per Capita Income in Lake Orion?
Per Capita income in Lake Orion is $49,695.
What is the Median Family Income in Lake Orion?
Median Family Income in Lake Orion is $145,509.
What is the Median Household income in Lake Orion?
Median Household Income in Lake Orion is $94,925.
What is Income or Wage Gap in Lake Orion?
Income or Wage Gap in Lake Orion is 45.6%.
Women in Lake Orion earn 54.4 cents for every dollar earned by a man.
What is Inequality or Gini Index in Lake Orion?
Inequality or Gini Index in Lake Orion is 0.46.
What is the Total Population of Lake Orion?
Total Population of Lake Orion is 2,915.
What is the Total Male Population of Lake Orion?
Total Male Population of Lake Orion is 1,340.
What is the Total Female Population of Lake Orion?
Total Female Population of Lake Orion is 1,575.
What is the Ratio of Males per 100 Females in Lake Orion?
There are 85.08 Males per 100 Females in Lake Orion.
What is the Ratio of Females per 100 Males in Lake Orion?
There are 117.54 Females per 100 Males in Lake Orion.
What is the Median Population Age in Lake Orion?
Median Population Age in Lake Orion is 42.5 Years.
What is the Average Family Size in Lake Orion
Average Family Size in Lake Orion is 3.1 People.
What is the Average Household Size in Lake Orion
Average Household Size in Lake Orion is 2.3 People.
How Large is the Labor Force in Lake Orion?
There are 1,663 People in the Labor Forcein in Lake Orion.
What is the Percentage of People in the Labor Force in Lake Orion?
67.5% of People are in the Labor Force in Lake Orion.
What is the Unemployment Rate in Lake Orion?
Unemployment Rate in Lake Orion is 2.6%.