Petoskey, MI Map & Demographics
Petoskey Map
Petoskey Overview
$47,514
PER CAPITA INCOME
$100,104
AVG FAMILY INCOME
$69,784
AVG HOUSEHOLD INCOME
0.4%
WAGE / INCOME GAP [ % ]
99.6¢/ $1
WAGE / INCOME GAP [ $ ]
0.50
INEQUALITY / GINI INDEX
5,859
TOTAL POPULATION
2,775
MALE POPULATION
3,084
FEMALE POPULATION
89.98
MALES / 100 FEMALES
111.14
FEMALES / 100 MALES
41.0
MEDIAN AGE
2.9
AVG FAMILY SIZE
2.2
AVG HOUSEHOLD SIZE
3,447
LABOR FORCE [ PEOPLE ]
69.9%
PERCENT IN LABOR FORCE
1.2%
UNEMPLOYMENT RATE
Petoskey Zip Codes
Petoskey Area Codes
Income in Petoskey
Income Overview in Petoskey
Per Capita Income in Petoskey is $47,514, while median incomes of families and households are $100,104 and $69,784 respectively.
| Characteristic | Number | Measure |
| Per Capita Income | 5,859 | $47,514 |
| Median Family Income | 1,421 | $100,104 |
| Mean Family Income | 1,421 | $132,313 |
| Median Household Income | 2,583 | $69,784 |
| Mean Household Income | 2,583 | $107,092 |
| Income Deficit | 1,421 | $0 |
| Wage / Income Gap (%) | 5,859 | 0.40% |
| Wage / Income Gap ($) | 5,859 | 99.60¢ per $1 |
| Gini / Inequality Index | 5,859 | 0.50 |
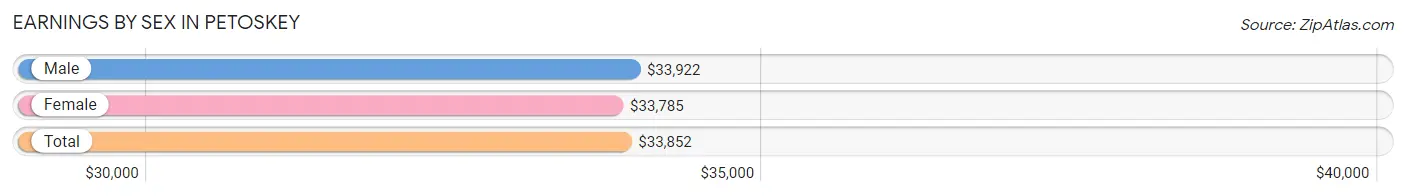
Earnings by Sex in Petoskey
Average Earnings in Petoskey are $33,852, $33,922 for men and $33,785 for women, a difference of 0.4%.
| Sex | Number | Average Earnings |
| Male | 1,776 (47.9%) | $33,922 |
| Female | 1,933 (52.1%) | $33,785 |
| Total | 3,709 (100.0%) | $33,852 |
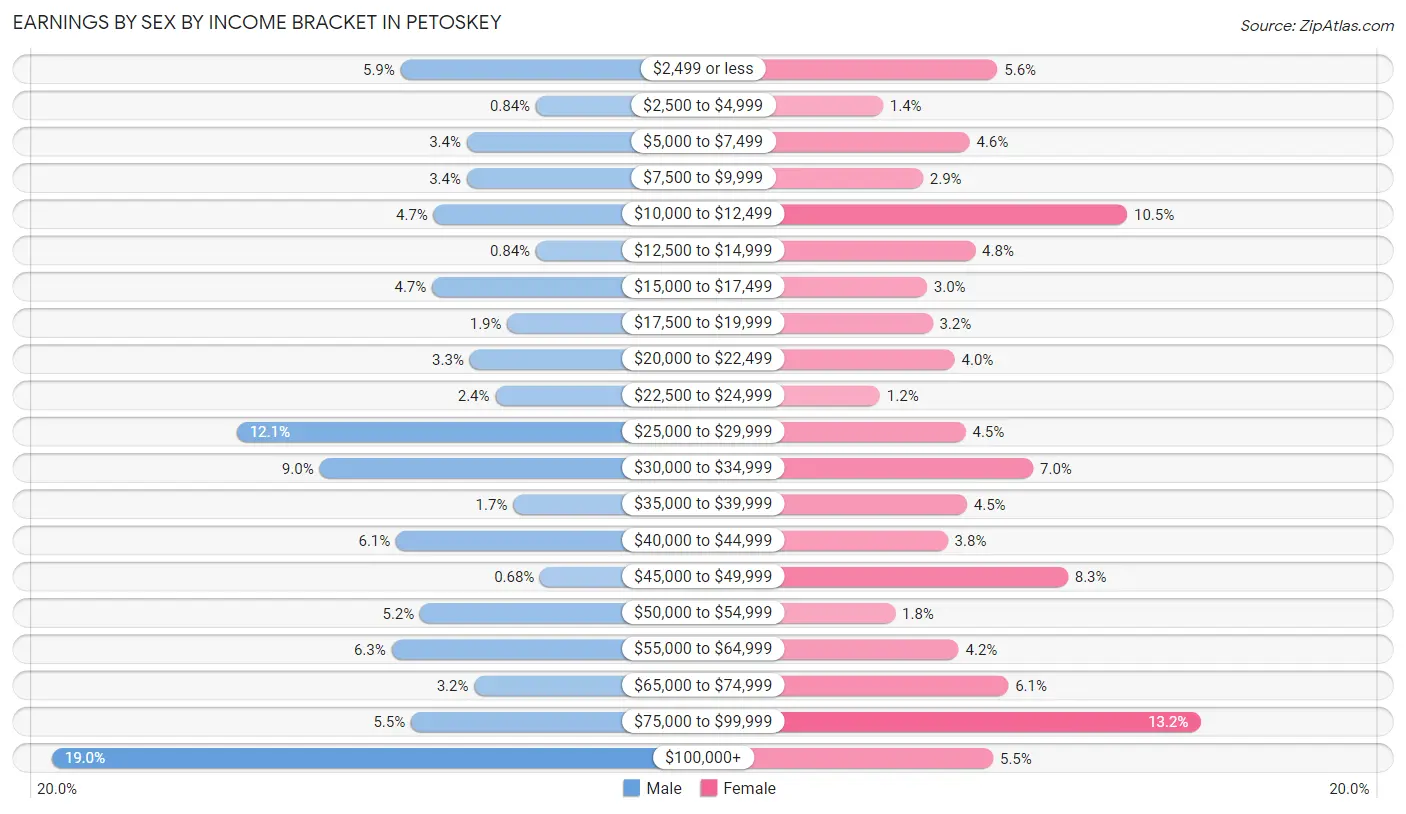
Earnings by Sex by Income Bracket in Petoskey
The most common earnings brackets in Petoskey are $100,000+ for men (337 | 19.0%) and $75,000 to $99,999 for women (256 | 13.2%).
| Income | Male | Female |
| $2,499 or less | 105 (5.9%) | 109 (5.6%) |
| $2,500 to $4,999 | 15 (0.8%) | 26 (1.3%) |
| $5,000 to $7,499 | 61 (3.4%) | 89 (4.6%) |
| $7,500 to $9,999 | 61 (3.4%) | 55 (2.9%) |
| $10,000 to $12,499 | 83 (4.7%) | 203 (10.5%) |
| $12,500 to $14,999 | 15 (0.8%) | 93 (4.8%) |
| $15,000 to $17,499 | 84 (4.7%) | 58 (3.0%) |
| $17,500 to $19,999 | 34 (1.9%) | 62 (3.2%) |
| $20,000 to $22,499 | 59 (3.3%) | 78 (4.0%) |
| $22,500 to $24,999 | 42 (2.4%) | 24 (1.2%) |
| $25,000 to $29,999 | 214 (12.0%) | 86 (4.4%) |
| $30,000 to $34,999 | 159 (8.9%) | 135 (7.0%) |
| $35,000 to $39,999 | 30 (1.7%) | 87 (4.5%) |
| $40,000 to $44,999 | 108 (6.1%) | 73 (3.8%) |
| $45,000 to $49,999 | 12 (0.7%) | 160 (8.3%) |
| $50,000 to $54,999 | 92 (5.2%) | 35 (1.8%) |
| $55,000 to $64,999 | 111 (6.2%) | 81 (4.2%) |
| $65,000 to $74,999 | 56 (3.2%) | 117 (6.0%) |
| $75,000 to $99,999 | 98 (5.5%) | 256 (13.2%) |
| $100,000+ | 337 (19.0%) | 106 (5.5%) |
| Total | 1,776 (100.0%) | 1,933 (100.0%) |
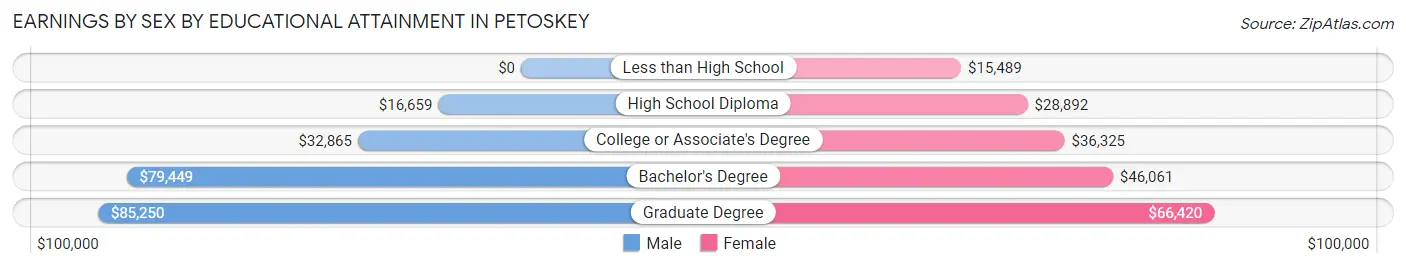
Earnings by Sex by Educational Attainment in Petoskey
Average earnings in Petoskey are $50,540 for men and $41,855 for women, a difference of 17.2%. Men with an educational attainment of graduate degree enjoy the highest average annual earnings of $85,250, while those with high school diploma education earn the least with $16,659. Women with an educational attainment of graduate degree earn the most with the average annual earnings of $66,420, while those with less than high school education have the smallest earnings of $15,489.
| Educational Attainment | Male Income | Female Income |
| Less than High School | - | - |
| High School Diploma | $16,659 | $28,892 |
| College or Associate's Degree | $32,865 | $36,325 |
| Bachelor's Degree | $79,449 | $46,061 |
| Graduate Degree | $85,250 | $66,420 |
| Total | $50,540 | $41,855 |
Family Income in Petoskey
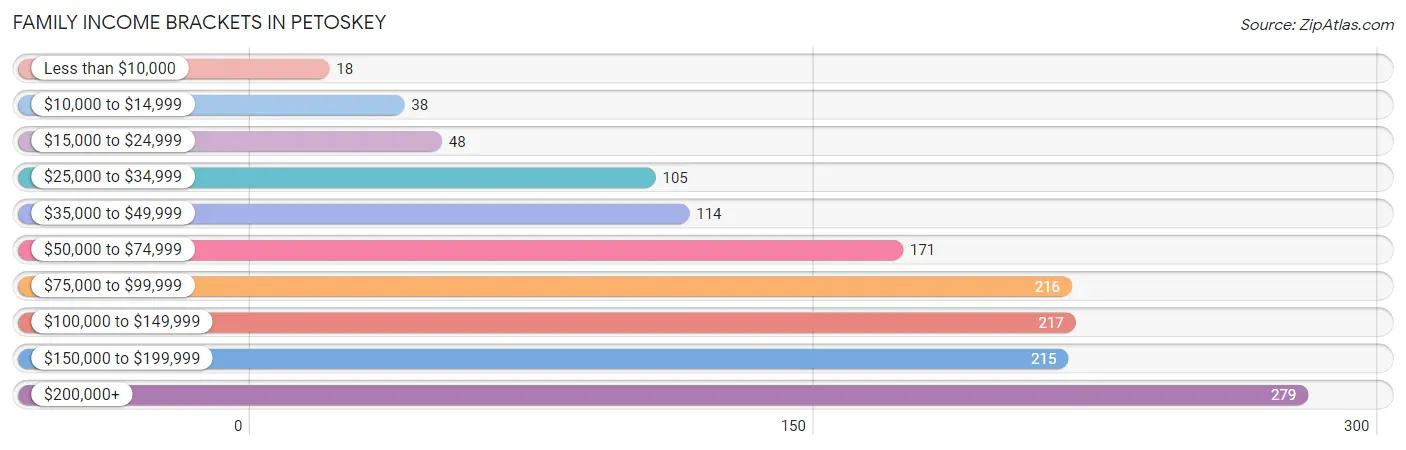
Family Income Brackets in Petoskey
According to the Petoskey family income data, there are 279 families falling into the $200,000+ income range, which is the most common income bracket and makes up 19.6% of all families. Conversely, the less than $10,000 income bracket is the least frequent group with only 18 families (1.3%) belonging to this category.
| Income Bracket | # Families | % Families |
| Less than $10,000 | 18 | 1.3% |
| $10,000 to $14,999 | 38 | 2.7% |
| $15,000 to $24,999 | 48 | 3.4% |
| $25,000 to $34,999 | 105 | 7.4% |
| $35,000 to $49,999 | 114 | 8.0% |
| $50,000 to $74,999 | 171 | 12.0% |
| $75,000 to $99,999 | 216 | 15.2% |
| $100,000 to $149,999 | 217 | 15.3% |
| $150,000 to $199,999 | 215 | 15.1% |
| $200,000+ | 279 | 19.6% |
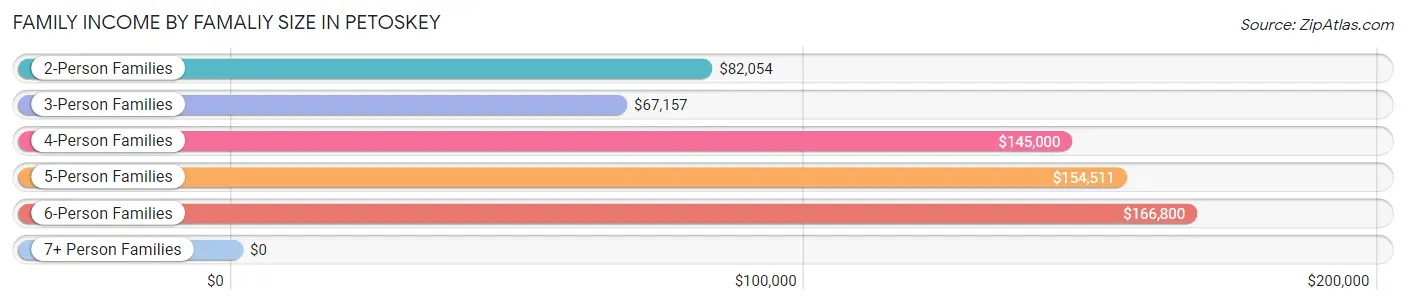
Family Income by Famaliy Size in Petoskey
6-person families (90 | 6.3%) account for the highest median family income in Petoskey with $166,800 per family, while 2-person families (644 | 45.3%) have the highest median income of $41,027 per family member.
| Income Bracket | # Families | Median Income |
| 2-Person Families | 644 (45.3%) | $82,054 |
| 3-Person Families | 414 (29.1%) | $67,157 |
| 4-Person Families | 104 (7.3%) | $145,000 |
| 5-Person Families | 159 (11.2%) | $154,511 |
| 6-Person Families | 90 (6.3%) | $166,800 |
| 7+ Person Families | 10 (0.7%) | $0 |
| Total | 1,421 (100.0%) | $100,104 |
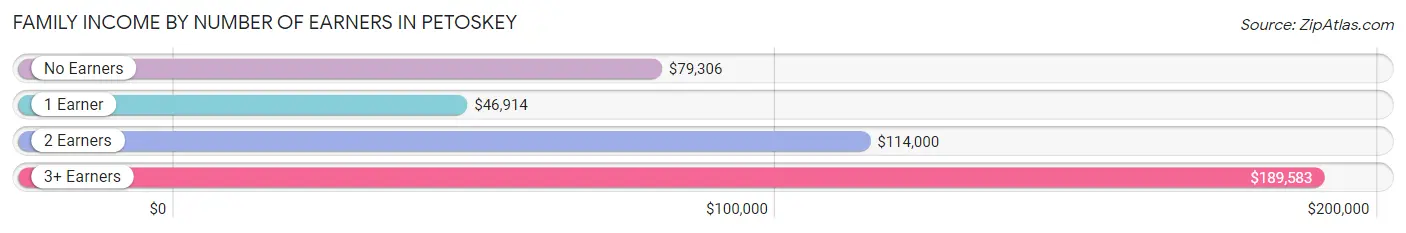
Family Income by Number of Earners in Petoskey
The median family income in Petoskey is $100,104, with families comprising 3+ earners (255) having the highest median family income of $189,583, while families with 1 earner (353) have the lowest median family income of $46,914, accounting for 17.9% and 24.8% of families, respectively.
| Number of Earners | # Families | Median Income |
| No Earners | 195 (13.7%) | $79,306 |
| 1 Earner | 353 (24.8%) | $46,914 |
| 2 Earners | 618 (43.5%) | $114,000 |
| 3+ Earners | 255 (17.9%) | $189,583 |
| Total | 1,421 (100.0%) | $100,104 |
Household Income in Petoskey
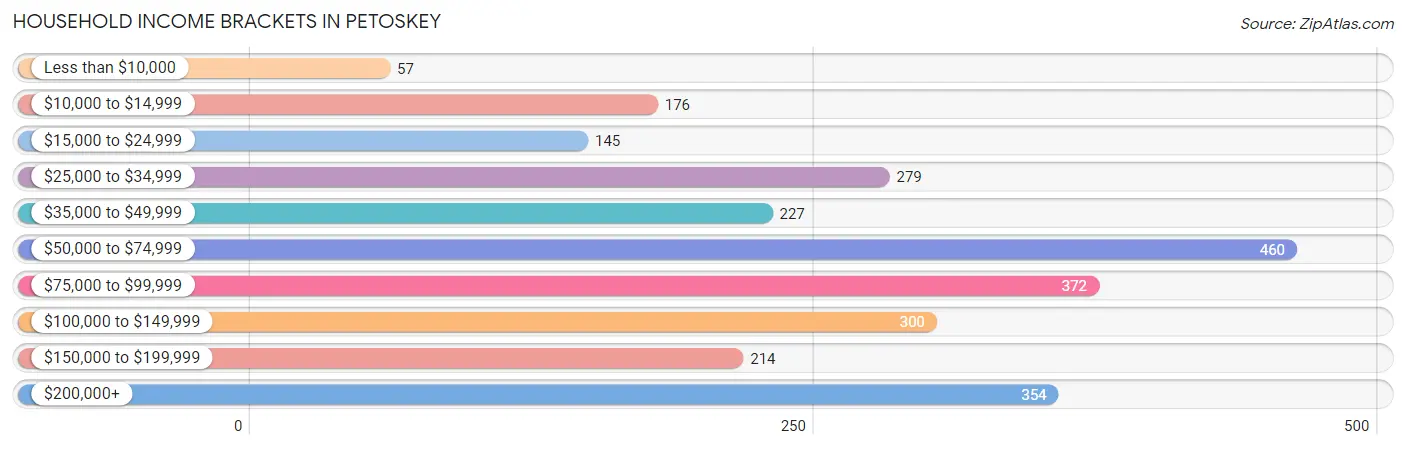
Household Income Brackets in Petoskey
With 460 households falling in the category, the $50,000 to $74,999 income range is the most frequent in Petoskey, accounting for 17.8% of all households. In contrast, only 57 households (2.2%) fall into the less than $10,000 income bracket, making it the least populous group.
| Income Bracket | # Households | % Households |
| Less than $10,000 | 57 | 2.2% |
| $10,000 to $14,999 | 176 | 6.8% |
| $15,000 to $24,999 | 145 | 5.6% |
| $25,000 to $34,999 | 279 | 10.8% |
| $35,000 to $49,999 | 227 | 8.8% |
| $50,000 to $74,999 | 460 | 17.8% |
| $75,000 to $99,999 | 372 | 14.4% |
| $100,000 to $149,999 | 300 | 11.6% |
| $150,000 to $199,999 | 214 | 8.3% |
| $200,000+ | 354 | 13.7% |
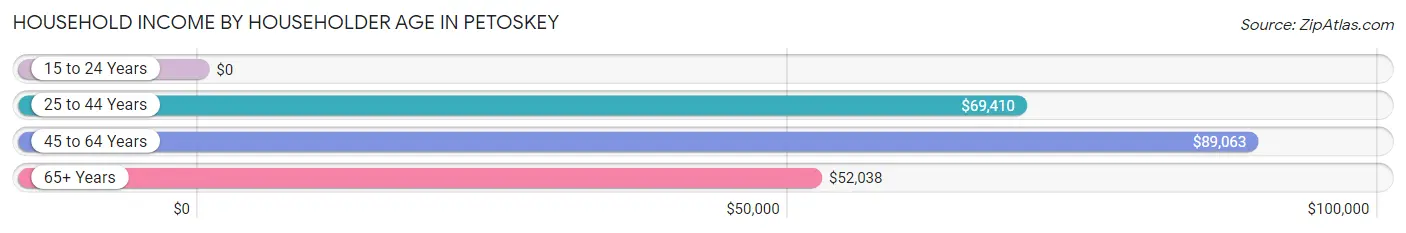
Household Income by Householder Age in Petoskey
The median household income in Petoskey is $69,784, with the highest median household income of $89,063 found in the 45 to 64 years age bracket for the primary householder. A total of 907 households (35.1%) fall into this category. Meanwhile, the 15 to 24 years age bracket for the primary householder has the lowest median household income of $0, with 185 households (7.2%) in this group.
| Income Bracket | # Households | Median Income |
| 15 to 24 Years | 185 (7.2%) | $0 |
| 25 to 44 Years | 795 (30.8%) | $69,410 |
| 45 to 64 Years | 907 (35.1%) | $89,063 |
| 65+ Years | 696 (27.0%) | $52,038 |
| Total | 2,583 (100.0%) | $69,784 |
Poverty in Petoskey
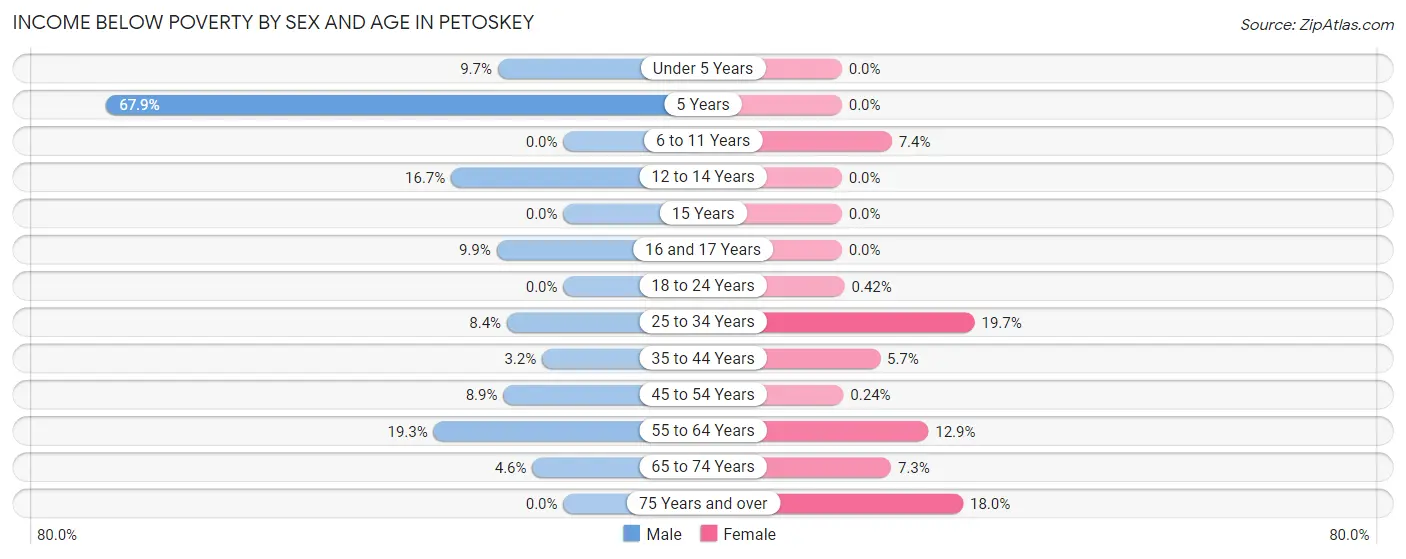
Income Below Poverty by Sex and Age in Petoskey
With 7.7% poverty level for males and 8.1% for females among the residents of Petoskey, 5 year old males and 25 to 34 year old females are the most vulnerable to poverty, with 19 males (67.9%) and 67 females (19.7%) in their respective age groups living below the poverty level.
| Age Bracket | Male | Female |
| Under 5 Years | 11 (9.7%) | 0 (0.0%) |
| 5 Years | 19 (67.9%) | 0 (0.0%) |
| 6 to 11 Years | 0 (0.0%) | 16 (7.4%) |
| 12 to 14 Years | 15 (16.7%) | 0 (0.0%) |
| 15 Years | 0 (0.0%) | 0 (0.0%) |
| 16 and 17 Years | 12 (9.9%) | 0 (0.0%) |
| 18 to 24 Years | 0 (0.0%) | 1 (0.4%) |
| 25 to 34 Years | 44 (8.4%) | 67 (19.7%) |
| 35 to 44 Years | 8 (3.2%) | 22 (5.7%) |
| 45 to 54 Years | 24 (8.9%) | 1 (0.2%) |
| 55 to 64 Years | 59 (19.3%) | 59 (12.9%) |
| 65 to 74 Years | 12 (4.6%) | 26 (7.3%) |
| 75 Years and over | 0 (0.0%) | 49 (18.0%) |
| Total | 204 (7.7%) | 241 (8.1%) |
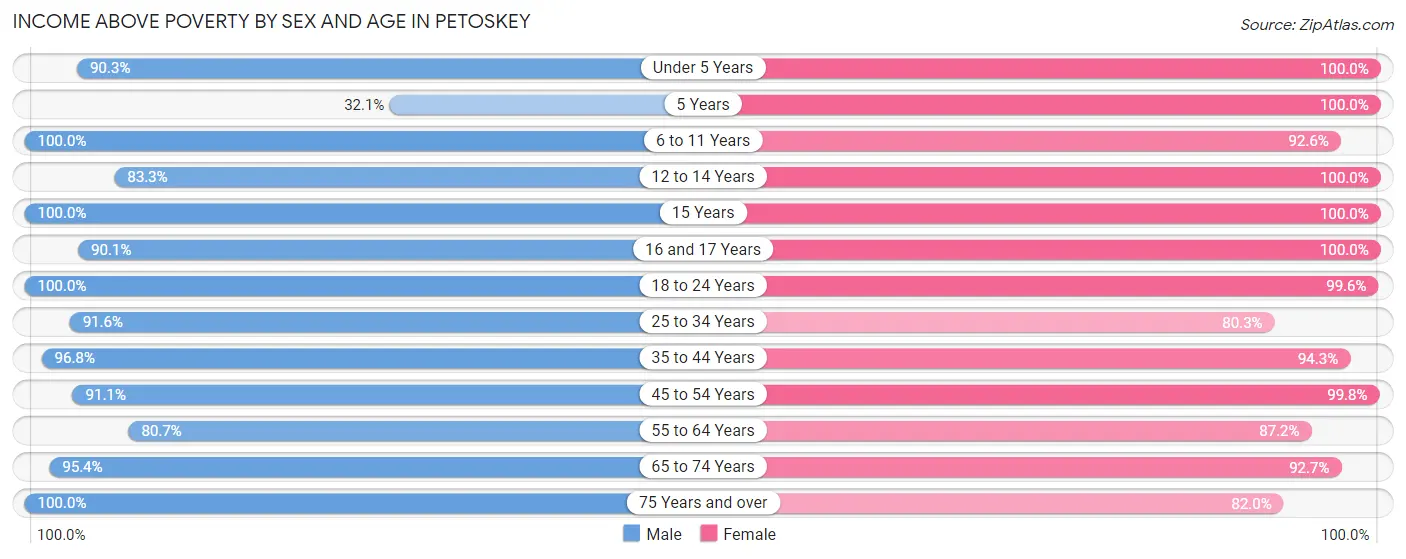
Income Above Poverty by Sex and Age in Petoskey
According to the poverty statistics in Petoskey, males aged 6 to 11 years and females aged under 5 years are the age groups that are most secure financially, with 100.0% of males and 100.0% of females in these age groups living above the poverty line.
| Age Bracket | Male | Female |
| Under 5 Years | 102 (90.3%) | 123 (100.0%) |
| 5 Years | 9 (32.1%) | 13 (100.0%) |
| 6 to 11 Years | 226 (100.0%) | 200 (92.6%) |
| 12 to 14 Years | 75 (83.3%) | 51 (100.0%) |
| 15 Years | 11 (100.0%) | 57 (100.0%) |
| 16 and 17 Years | 109 (90.1%) | 38 (100.0%) |
| 18 to 24 Years | 273 (100.0%) | 237 (99.6%) |
| 25 to 34 Years | 481 (91.6%) | 273 (80.3%) |
| 35 to 44 Years | 245 (96.8%) | 365 (94.3%) |
| 45 to 54 Years | 245 (91.1%) | 412 (99.8%) |
| 55 to 64 Years | 247 (80.7%) | 400 (87.2%) |
| 65 to 74 Years | 249 (95.4%) | 330 (92.7%) |
| 75 Years and over | 182 (100.0%) | 223 (82.0%) |
| Total | 2,454 (92.3%) | 2,722 (91.9%) |
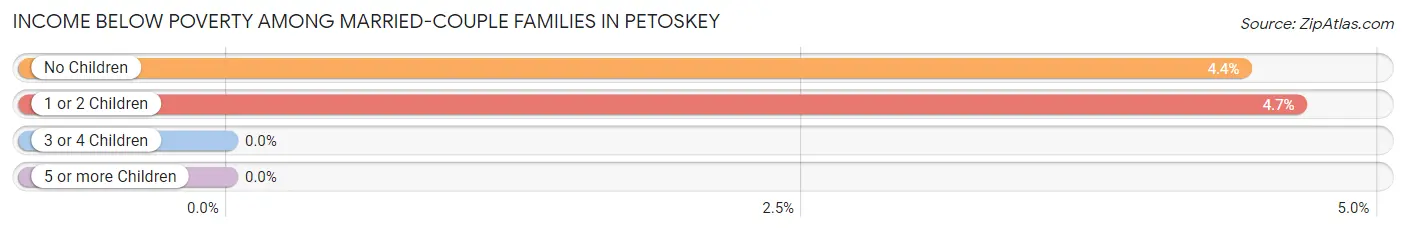
Income Below Poverty Among Married-Couple Families in Petoskey
The poverty statistics for married-couple families in Petoskey show that 4.0% or 42 of the total 1,059 families live below the poverty line. Families with 1 or 2 children have the highest poverty rate of 4.6%, comprising of 16 families. On the other hand, families with 3 or 4 children have the lowest poverty rate of 0.0%, which includes 0 families.
| Children | Above Poverty | Below Poverty |
| No Children | 564 (95.6%) | 26 (4.4%) |
| 1 or 2 Children | 328 (95.4%) | 16 (4.6%) |
| 3 or 4 Children | 125 (100.0%) | 0 (0.0%) |
| 5 or more Children | 0 (0.0%) | 0 (0.0%) |
| Total | 1,017 (96.0%) | 42 (4.0%) |
Income Below Poverty Among Single-Parent Households in Petoskey
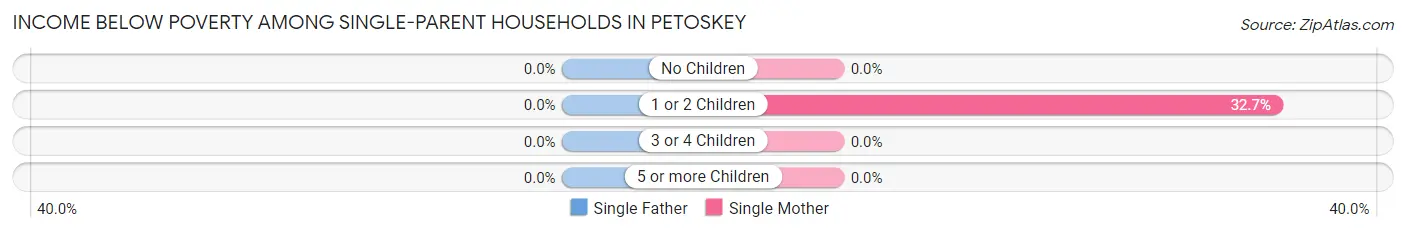
| Children | Single Father | Single Mother |
| No Children | 0 (0.0%) | 0 (0.0%) |
| 1 or 2 Children | 0 (0.0%) | 35 (32.7%) |
| 3 or 4 Children | 0 (0.0%) | 0 (0.0%) |
| 5 or more Children | 0 (0.0%) | 0 (0.0%) |
| Total | 0 (0.0%) | 35 (19.0%) |
Income Below Poverty Among Married-Couple vs Single-Parent Households in Petoskey
The poverty data for Petoskey shows that 42 of the married-couple family households (4.0%) and 35 of the single-parent households (9.7%) are living below the poverty level. Within the married-couple family households, those with 1 or 2 children have the highest poverty rate, with 16 households (4.6%) falling below the poverty line. Among the single-parent households, those with 1 or 2 children have the highest poverty rate, with 35 household (16.1%) living below poverty.
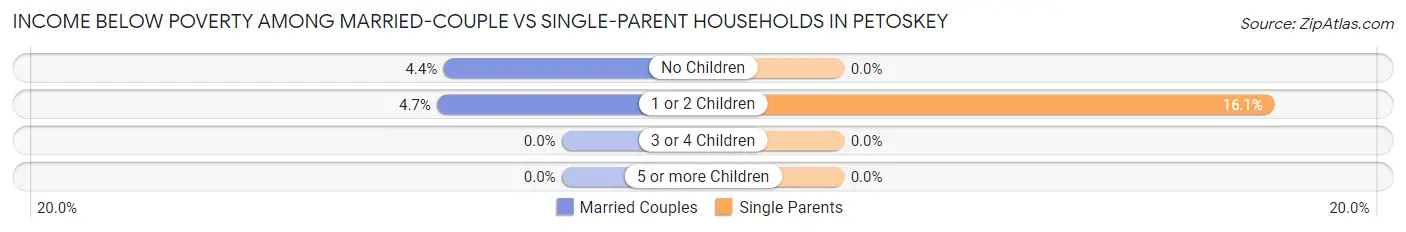
| Children | Married-Couple Families | Single-Parent Households |
| No Children | 26 (4.4%) | 0 (0.0%) |
| 1 or 2 Children | 16 (4.6%) | 35 (16.1%) |
| 3 or 4 Children | 0 (0.0%) | 0 (0.0%) |
| 5 or more Children | 0 (0.0%) | 0 (0.0%) |
| Total | 42 (4.0%) | 35 (9.7%) |
Race in Petoskey
The most populous races in Petoskey are White / Caucasian (5,335 | 91.1%), Two or more Races (367 | 6.3%), and Hispanic or Latino (194 | 3.3%).
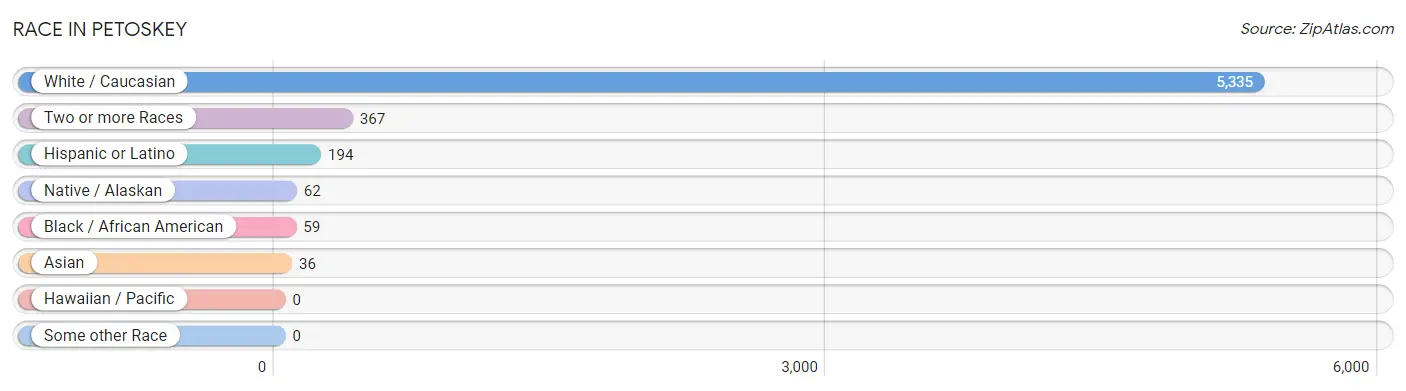
| Race | # Population | % Population |
| Asian | 36 | 0.6% |
| Black / African American | 59 | 1.0% |
| Hawaiian / Pacific | 0 | 0.0% |
| Hispanic or Latino | 194 | 3.3% |
| Native / Alaskan | 62 | 1.1% |
| White / Caucasian | 5,335 | 91.1% |
| Two or more Races | 367 | 6.3% |
| Some other Race | 0 | 0.0% |
| Total | 5,859 | 100.0% |
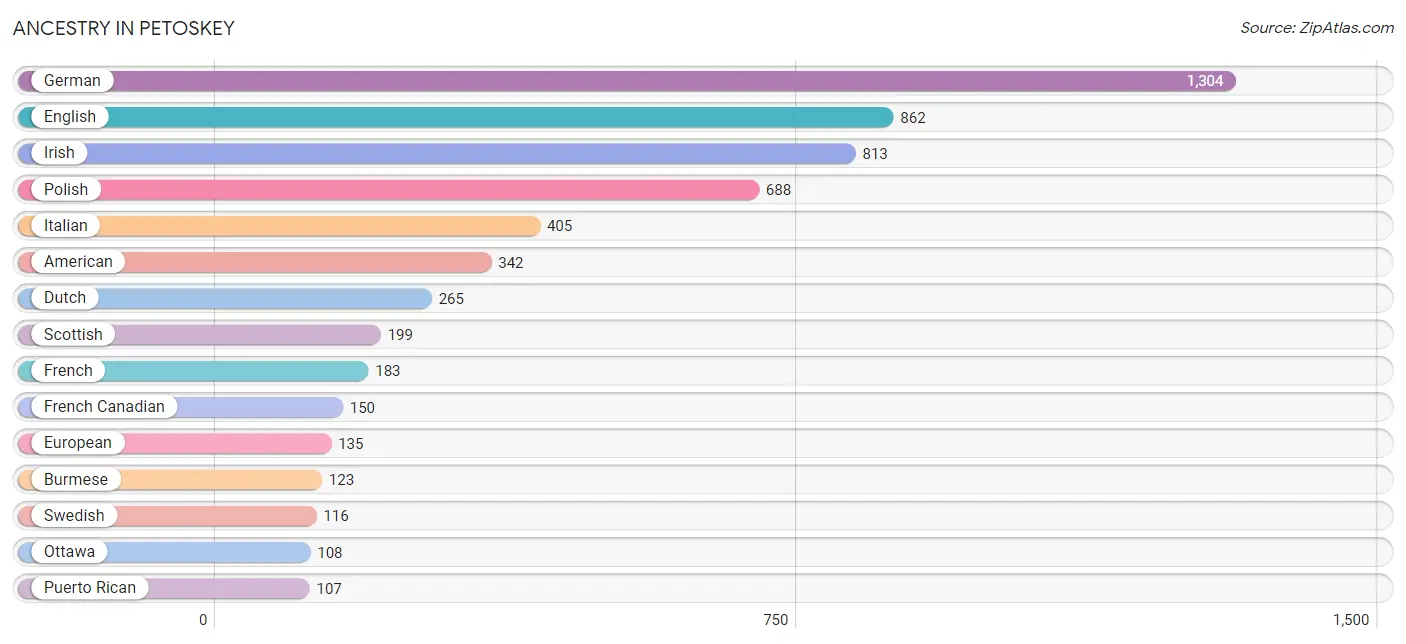
Ancestry in Petoskey
The most populous ancestries reported in Petoskey are German (1,304 | 22.3%), English (862 | 14.7%), Irish (813 | 13.9%), Polish (688 | 11.7%), and Italian (405 | 6.9%), together accounting for 69.5% of all Petoskey residents.
| Ancestry | # Population | % Population |
| African | 53 | 0.9% |
| American | 342 | 5.8% |
| Arab | 24 | 0.4% |
| Belgian | 81 | 1.4% |
| Blackfeet | 2 | 0.0% |
| British | 7 | 0.1% |
| Burmese | 123 | 2.1% |
| Canadian | 24 | 0.4% |
| Cherokee | 6 | 0.1% |
| Chippewa | 33 | 0.6% |
| Croatian | 15 | 0.3% |
| Cuban | 34 | 0.6% |
| Czech | 83 | 1.4% |
| Czechoslovakian | 49 | 0.8% |
| Danish | 72 | 1.2% |
| Dutch | 265 | 4.5% |
| Eastern European | 9 | 0.2% |
| English | 862 | 14.7% |
| European | 135 | 2.3% |
| Finnish | 6 | 0.1% |
| French | 183 | 3.1% |
| French Canadian | 150 | 2.6% |
| German | 1,304 | 22.3% |
| Greek | 78 | 1.3% |
| Hungarian | 23 | 0.4% |
| Indian (Asian) | 40 | 0.7% |
| Irish | 813 | 13.9% |
| Italian | 405 | 6.9% |
| Jamaican | 23 | 0.4% |
| Lebanese | 8 | 0.1% |
| Lithuanian | 28 | 0.5% |
| Maltese | 26 | 0.4% |
| Mexican | 53 | 0.9% |
| Native Hawaiian | 1 | 0.0% |
| Northern European | 41 | 0.7% |
| Norwegian | 21 | 0.4% |
| Ottawa | 108 | 1.8% |
| Polish | 688 | 11.7% |
| Puerto Rican | 107 | 1.8% |
| Romanian | 2 | 0.0% |
| Russian | 26 | 0.4% |
| Scandinavian | 37 | 0.6% |
| Scotch-Irish | 102 | 1.7% |
| Scottish | 199 | 3.4% |
| Sioux | 5 | 0.1% |
| Slavic | 33 | 0.6% |
| Subsaharan African | 53 | 0.9% |
| Swedish | 116 | 2.0% |
| Swiss | 35 | 0.6% |
| Ukrainian | 9 | 0.2% |
| Welsh | 17 | 0.3% | View All 51 Rows |
Immigrants in Petoskey
The most numerous immigrant groups reported in Petoskey came from Europe (66 | 1.1%), England (41 | 0.7%), Northern Europe (41 | 0.7%), Asia (36 | 0.6%), and Eastern Asia (36 | 0.6%), together accounting for 3.7% of all Petoskey residents.
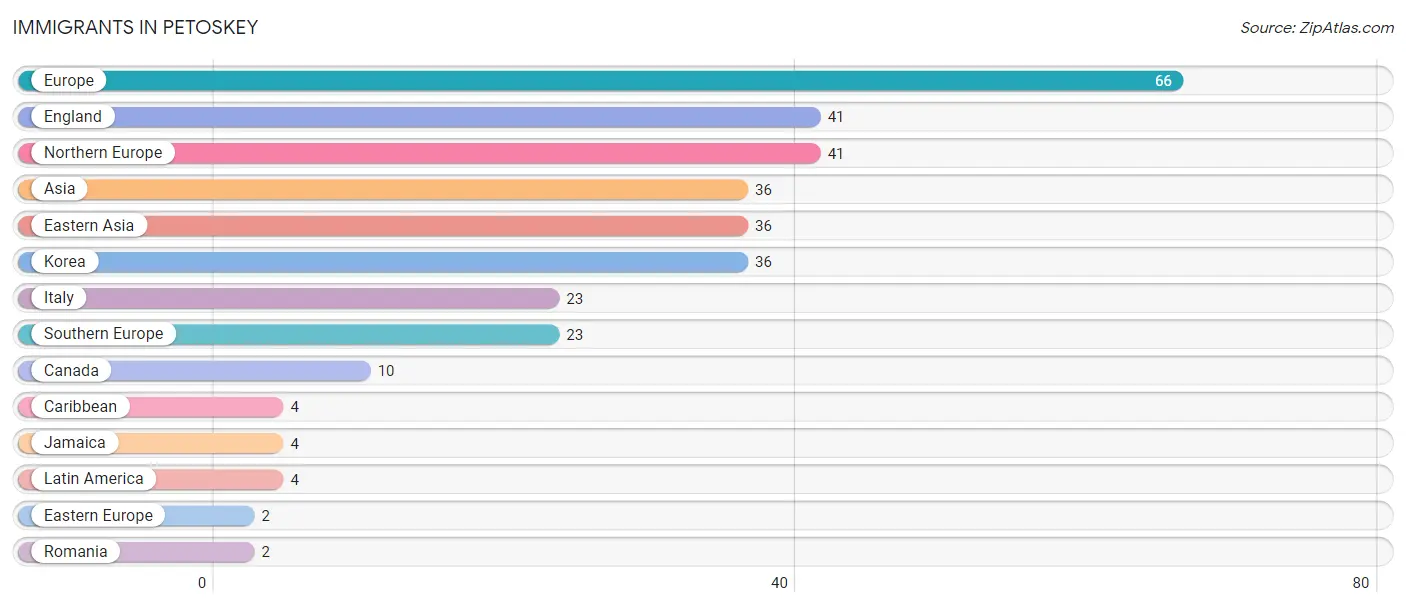
| Immigration Origin | # Population | % Population |
| Asia | 36 | 0.6% |
| Canada | 10 | 0.2% |
| Caribbean | 4 | 0.1% |
| Eastern Asia | 36 | 0.6% |
| Eastern Europe | 2 | 0.0% |
| England | 41 | 0.7% |
| Europe | 66 | 1.1% |
| Italy | 23 | 0.4% |
| Jamaica | 4 | 0.1% |
| Korea | 36 | 0.6% |
| Latin America | 4 | 0.1% |
| Northern Europe | 41 | 0.7% |
| Romania | 2 | 0.0% |
| Southern Europe | 23 | 0.4% | View All 14 Rows |
Sex and Age in Petoskey
Sex and Age in Petoskey
The most populous age groups in Petoskey are 25 to 29 Years (337 | 12.1%) for men and 60 to 64 Years (293 | 9.5%) for women.
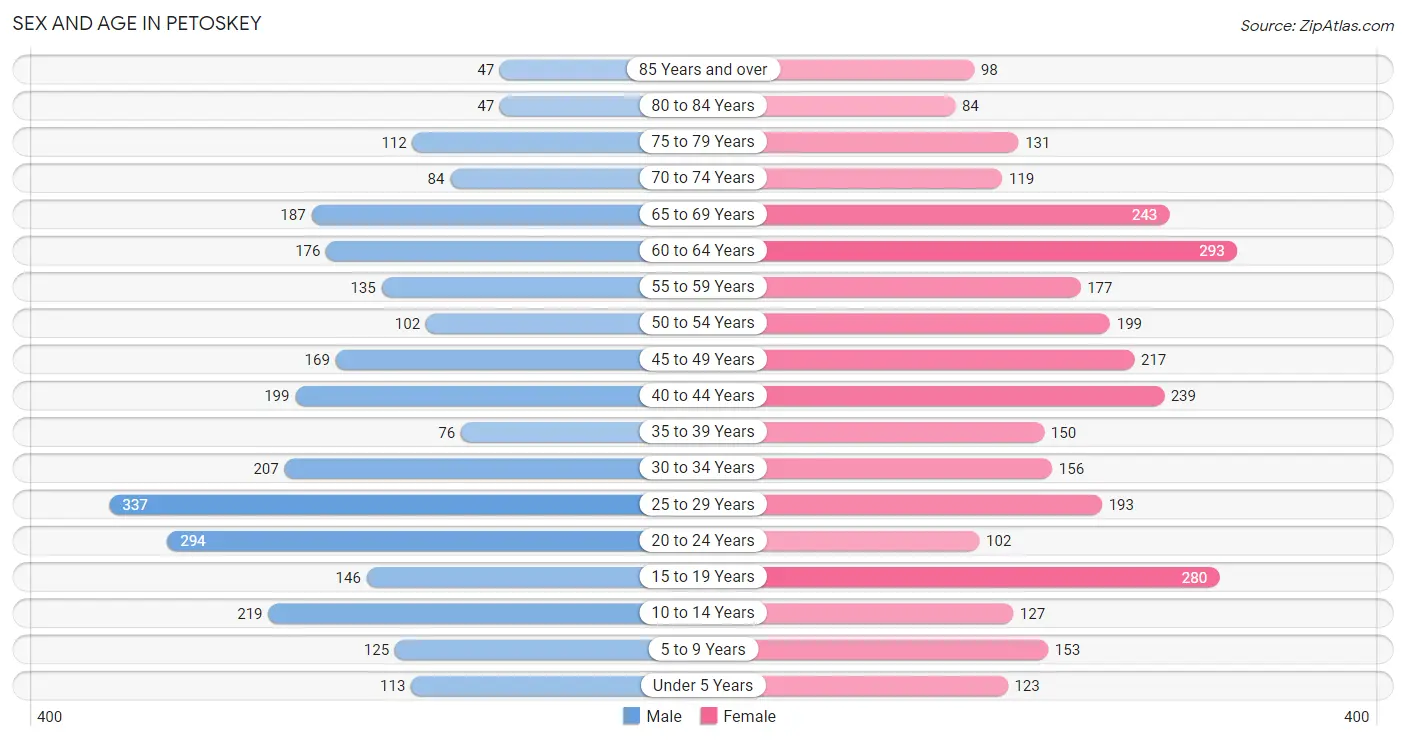
| Age Bracket | Male | Female |
| Under 5 Years | 113 (4.1%) | 123 (4.0%) |
| 5 to 9 Years | 125 (4.5%) | 153 (5.0%) |
| 10 to 14 Years | 219 (7.9%) | 127 (4.1%) |
| 15 to 19 Years | 146 (5.3%) | 280 (9.1%) |
| 20 to 24 Years | 294 (10.6%) | 102 (3.3%) |
| 25 to 29 Years | 337 (12.1%) | 193 (6.3%) |
| 30 to 34 Years | 207 (7.5%) | 156 (5.1%) |
| 35 to 39 Years | 76 (2.7%) | 150 (4.9%) |
| 40 to 44 Years | 199 (7.2%) | 239 (7.7%) |
| 45 to 49 Years | 169 (6.1%) | 217 (7.0%) |
| 50 to 54 Years | 102 (3.7%) | 199 (6.5%) |
| 55 to 59 Years | 135 (4.9%) | 177 (5.7%) |
| 60 to 64 Years | 176 (6.3%) | 293 (9.5%) |
| 65 to 69 Years | 187 (6.7%) | 243 (7.9%) |
| 70 to 74 Years | 84 (3.0%) | 119 (3.9%) |
| 75 to 79 Years | 112 (4.0%) | 131 (4.3%) |
| 80 to 84 Years | 47 (1.7%) | 84 (2.7%) |
| 85 Years and over | 47 (1.7%) | 98 (3.2%) |
| Total | 2,775 (100.0%) | 3,084 (100.0%) |
Families and Households in Petoskey
Median Family Size in Petoskey
The median family size in Petoskey is 2.88 persons per family, with married-couple families (1,059 | 74.5%) accounting for the largest median family size of 3.01 persons per family. On the other hand, single male/father families (178 | 12.5%) represent the smallest median family size with 2.29 persons per family.
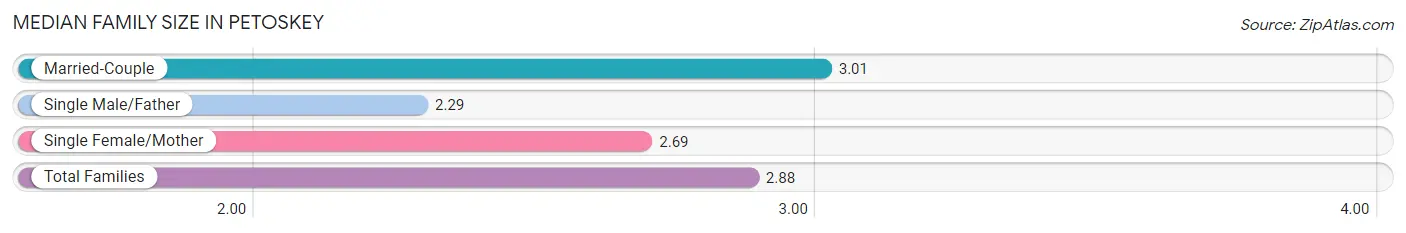
| Family Type | # Families | Family Size |
| Married-Couple | 1,059 (74.5%) | 3.01 |
| Single Male/Father | 178 (12.5%) | 2.29 |
| Single Female/Mother | 184 (13.0%) | 2.69 |
| Total Families | 1,421 (100.0%) | 2.88 |
Median Household Size in Petoskey
The median household size in Petoskey is 2.16 persons per household, with married-couple households (1,059 | 41.0%) accounting for the largest median household size of 3.01 persons per household. non-family households (1,162 | 45.0%) represent the smallest median household size with 1.24 persons per household.
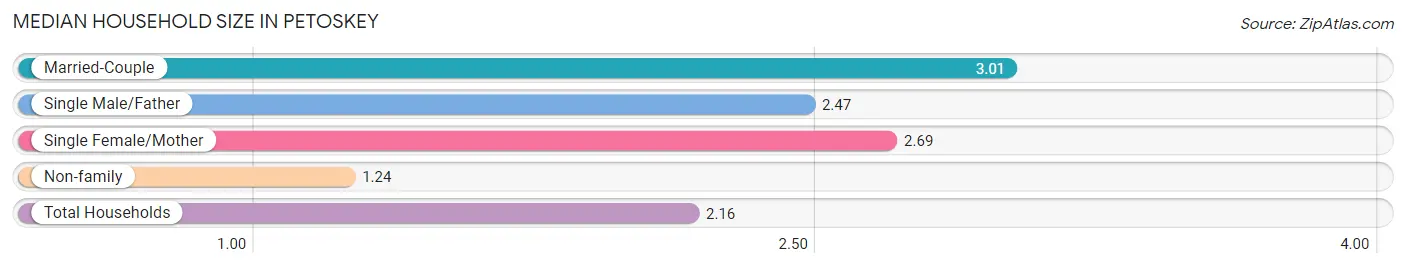
| Household Type | # Households | Household Size |
| Married-Couple | 1,059 (41.0%) | 3.01 |
| Single Male/Father | 178 (6.9%) | 2.47 |
| Single Female/Mother | 184 (7.1%) | 2.69 |
| Non-family | 1,162 (45.0%) | 1.24 |
| Total Households | 2,583 (100.0%) | 2.16 |
Household Size by Marriage Status in Petoskey
Out of a total of 2,583 households in Petoskey, 1,421 (55.0%) are family households, while 1,162 (45.0%) are nonfamily households. The most numerous type of family households are 2-person households, comprising 602, and the most common type of nonfamily households are 1-person households, comprising 919.
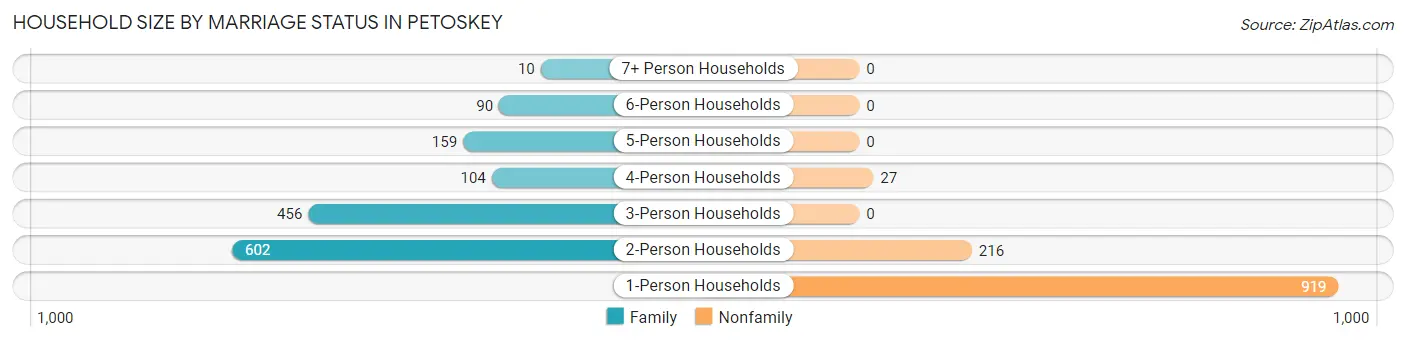
| Household Size | Family Households | Nonfamily Households |
| 1-Person Households | - | 919 (35.6%) |
| 2-Person Households | 602 (23.3%) | 216 (8.4%) |
| 3-Person Households | 456 (17.6%) | 0 (0.0%) |
| 4-Person Households | 104 (4.0%) | 27 (1.1%) |
| 5-Person Households | 159 (6.2%) | 0 (0.0%) |
| 6-Person Households | 90 (3.5%) | 0 (0.0%) |
| 7+ Person Households | 10 (0.4%) | 0 (0.0%) |
| Total | 1,421 (55.0%) | 1,162 (45.0%) |
Female Fertility in Petoskey
Fertility by Age in Petoskey
Average fertility rate in Petoskey is 9.0 births per 1,000 women. Women in the age bracket of 35 to 50 years have the highest fertility rate with 20.0 births per 1,000 women. Women in the age bracket of 35 to 50 years acount for 100.0% of all women with births.
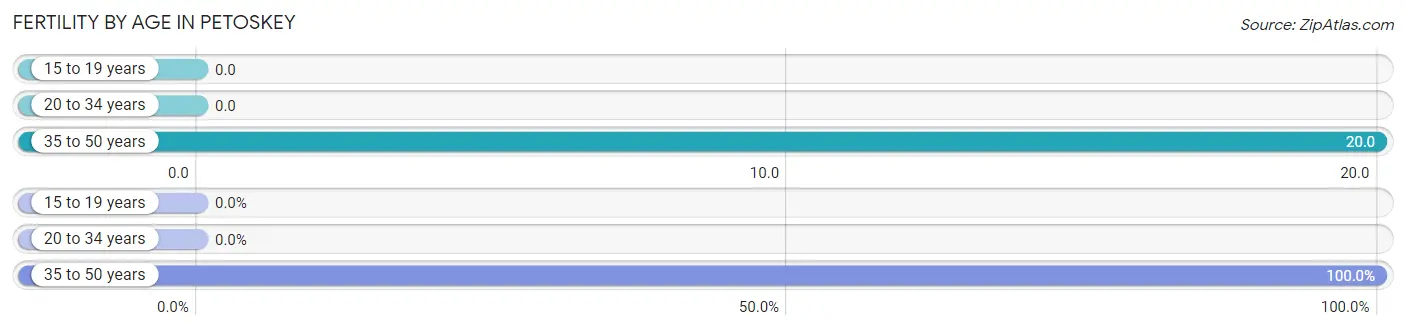
| Age Bracket | Women with Births | Births / 1,000 Women |
| 15 to 19 years | 0 (0.0%) | 0.0 |
| 20 to 34 years | 0 (0.0%) | 0.0 |
| 35 to 50 years | 13 (100.0%) | 20.0 |
| Total | 13 (100.0%) | 9.0 |
Fertility by Age by Marriage Status in Petoskey
76.9% of women with births (13) in Petoskey are married. The highest percentage of unmarried women with births falls into 35 to 50 years age bracket with 23.1% of them unmarried at the time of birth, while the lowest percentage of unmarried women with births belong to 35 to 50 years age bracket with 23.1% of them unmarried.
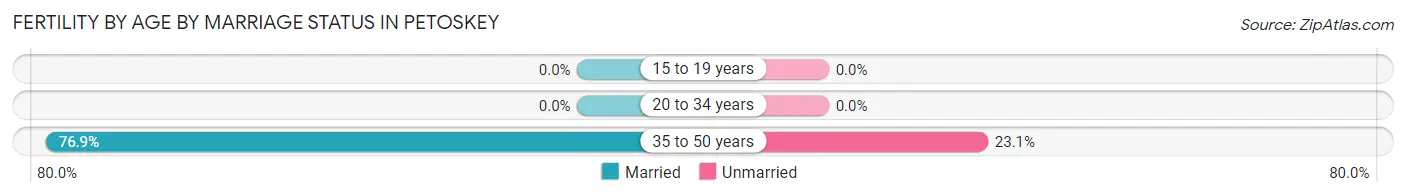
| Age Bracket | Married | Unmarried |
| 15 to 19 years | 0 (0.0%) | 0 (0.0%) |
| 20 to 34 years | 0 (0.0%) | 0 (0.0%) |
| 35 to 50 years | 10 (76.9%) | 3 (23.1%) |
| Total | 10 (76.9%) | 3 (23.1%) |
Fertility by Education in Petoskey
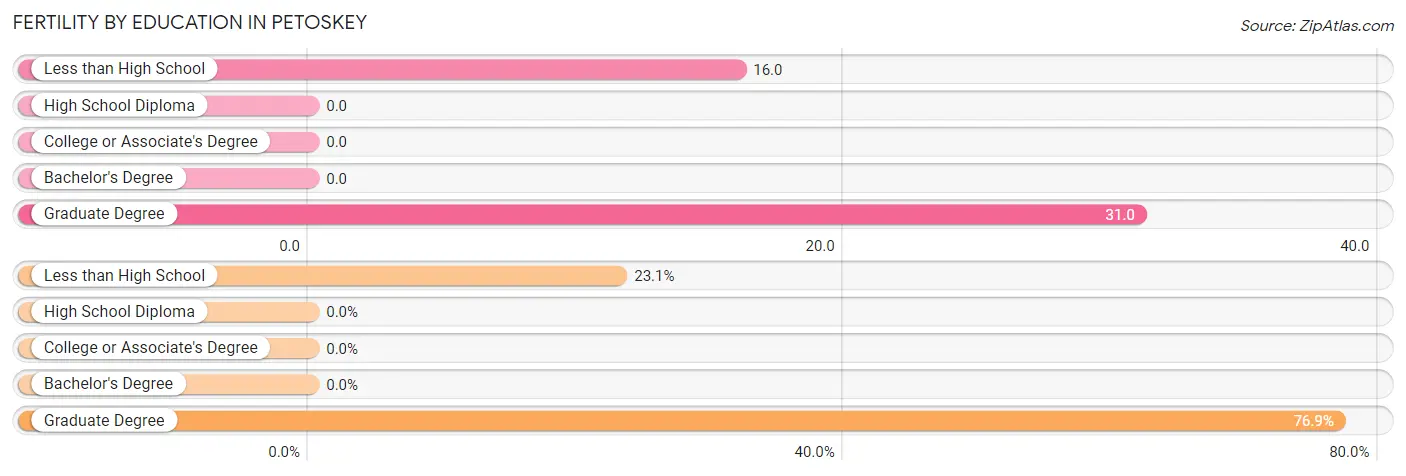
| Educational Attainment | Women with Births | Births / 1,000 Women |
| Less than High School | 3 (23.1%) | 16.0 |
| High School Diploma | 0 (0.0%) | 0.0 |
| College or Associate's Degree | 0 (0.0%) | 0.0 |
| Bachelor's Degree | 0 (0.0%) | 0.0 |
| Graduate Degree | 10 (76.9%) | 31.0 |
| Total | 13 (100.0%) | 9.0 |
Fertility by Education by Marriage Status in Petoskey
23.1% of women with births in Petoskey are unmarried. Women with the educational attainment of graduate degree are most likely to be married with 100.0% of them married at childbirth, while women with the educational attainment of less than high school are least likely to be married with 100.0% of them unmarried at childbirth.
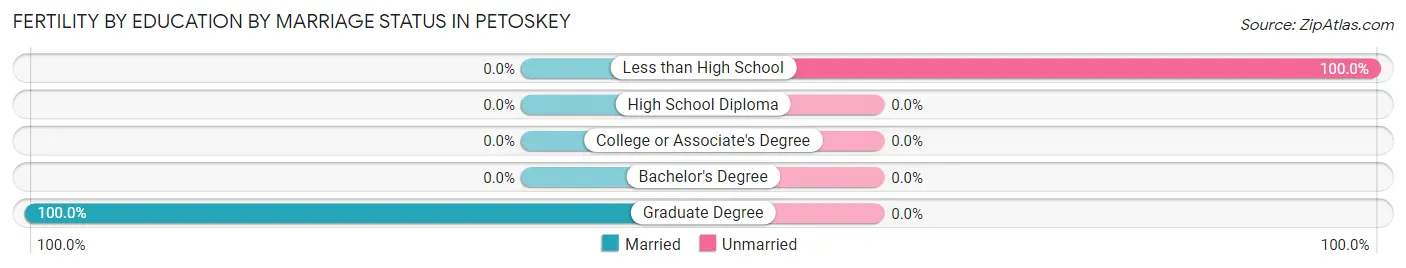
| Educational Attainment | Married | Unmarried |
| Less than High School | 0 (0.0%) | 3 (100.0%) |
| High School Diploma | 0 (0.0%) | 0 (0.0%) |
| College or Associate's Degree | 0 (0.0%) | 0 (0.0%) |
| Bachelor's Degree | 0 (0.0%) | 0 (0.0%) |
| Graduate Degree | 10 (100.0%) | 0 (0.0%) |
| Total | 10 (76.9%) | 3 (23.1%) |
Employment Characteristics in Petoskey
Employment by Class of Employer in Petoskey
Among the 3,328 employed individuals in Petoskey, private company employees (2,017 | 60.6%), not-for-profit organizations (516 | 15.5%), and local government employees (337 | 10.1%) make up the most common classes of employment.
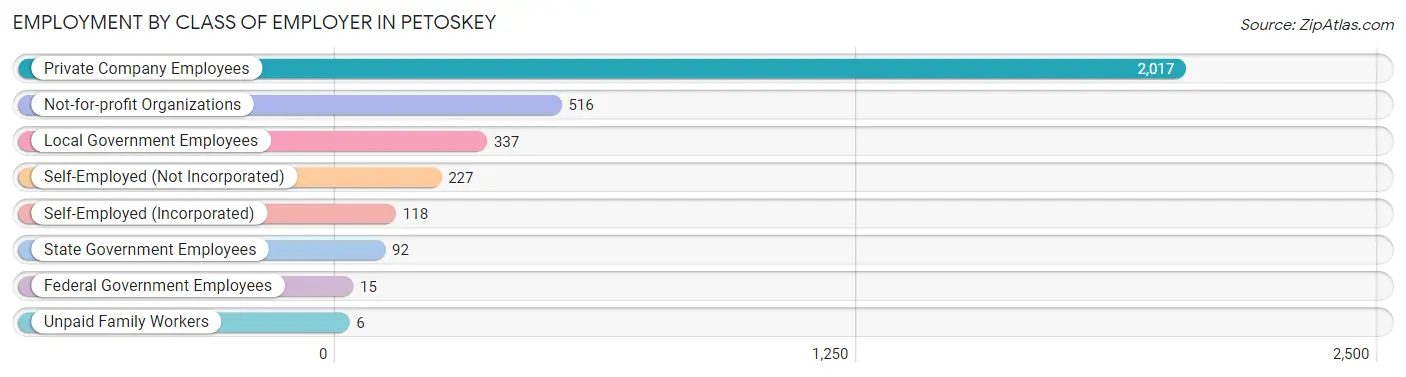
| Employer Class | # Employees | % Employees |
| Private Company Employees | 2,017 | 60.6% |
| Self-Employed (Incorporated) | 118 | 3.5% |
| Self-Employed (Not Incorporated) | 227 | 6.8% |
| Not-for-profit Organizations | 516 | 15.5% |
| Local Government Employees | 337 | 10.1% |
| State Government Employees | 92 | 2.8% |
| Federal Government Employees | 15 | 0.4% |
| Unpaid Family Workers | 6 | 0.2% |
| Total | 3,328 | 100.0% |
Employment Status by Age in Petoskey
According to the labor force statistics for Petoskey, out of the total population over 16 years of age (4,931), 69.9% or 3,447 individuals are in the labor force, with 1.2% or 41 of them unemployed. The age group with the highest labor force participation rate is 25 to 29 years, with 95.5% or 506 individuals in the labor force. Within the labor force, the 65 to 74 years age range has the highest percentage of unemployed individuals, with 5.5% or 8 of them being unemployed.
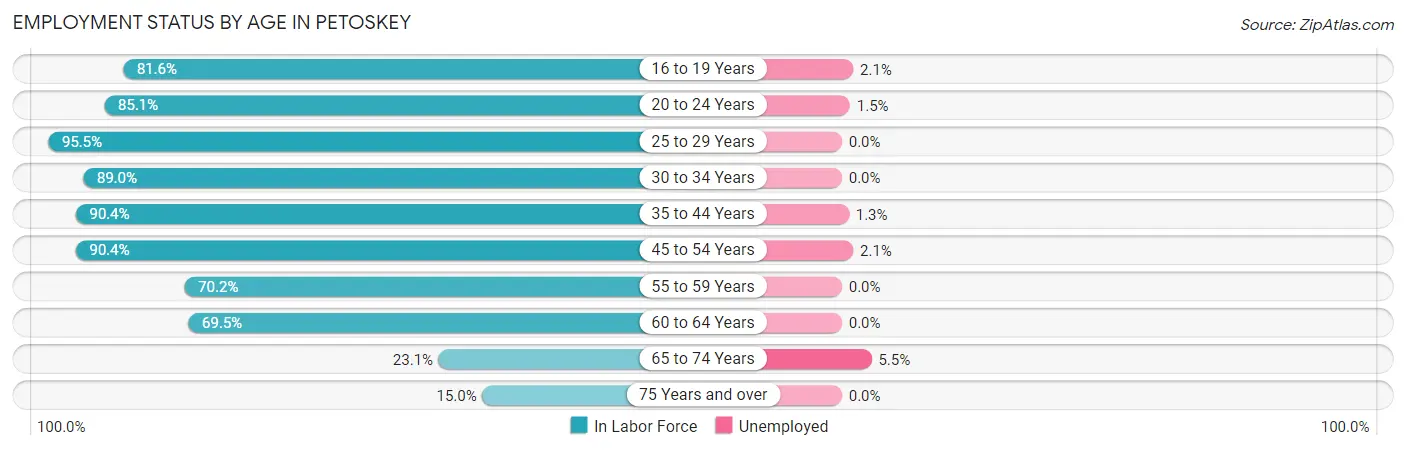
| Age Bracket | In Labor Force | Unemployed |
| 16 to 19 Years | 292 (81.6%) | 6 (2.1%) |
| 20 to 24 Years | 337 (85.1%) | 5 (1.5%) |
| 25 to 29 Years | 506 (95.5%) | 0 (0.0%) |
| 30 to 34 Years | 323 (89.0%) | 0 (0.0%) |
| 35 to 44 Years | 600 (90.4%) | 8 (1.3%) |
| 45 to 54 Years | 621 (90.4%) | 13 (2.1%) |
| 55 to 59 Years | 219 (70.2%) | 0 (0.0%) |
| 60 to 64 Years | 326 (69.5%) | 0 (0.0%) |
| 65 to 74 Years | 146 (23.1%) | 8 (5.5%) |
| 75 Years and over | 78 (15.0%) | 0 (0.0%) |
| Total | 3,447 (69.9%) | 41 (1.2%) |
Employment Status by Educational Attainment in Petoskey
According to labor force statistics for Petoskey, 85.8% of individuals (2,595) out of the total population between 25 and 64 years of age (3,025) are in the labor force, with 0.8% or 21 of them being unemployed. The group with the highest labor force participation rate are those with the educational attainment of bachelor's degree or higher, with 90.3% or 1,430 individuals in the labor force. Within the labor force, individuals with high school diploma education have the highest percentage of unemployment, with 2.3% or 8 of them being unemployed.
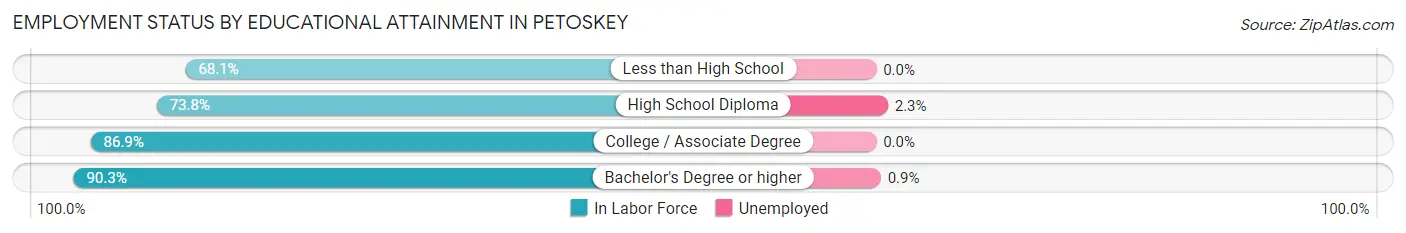
| Educational Attainment | In Labor Force | Unemployed |
| Less than High School | 92 (68.1%) | 0 (0.0%) |
| High School Diploma | 354 (73.8%) | 11 (2.3%) |
| College / Associate Degree | 718 (86.9%) | 0 (0.0%) |
| Bachelor's Degree or higher | 1,430 (90.3%) | 14 (0.9%) |
| Total | 2,595 (85.8%) | 24 (0.8%) |
Employment Occupations by Sex in Petoskey
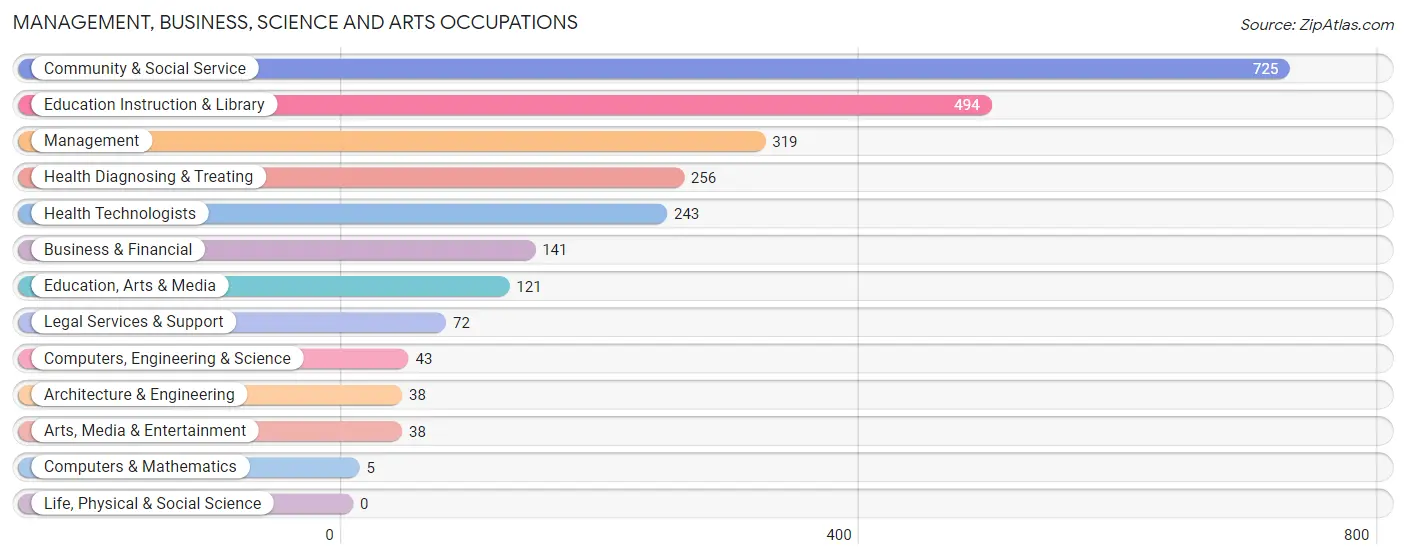
Management, Business, Science and Arts Occupations
The most common Management, Business, Science and Arts occupations in Petoskey are Community & Social Service (725 | 21.3%), Education Instruction & Library (494 | 14.5%), Management (319 | 9.4%), Health Diagnosing & Treating (256 | 7.5%), and Health Technologists (243 | 7.1%).
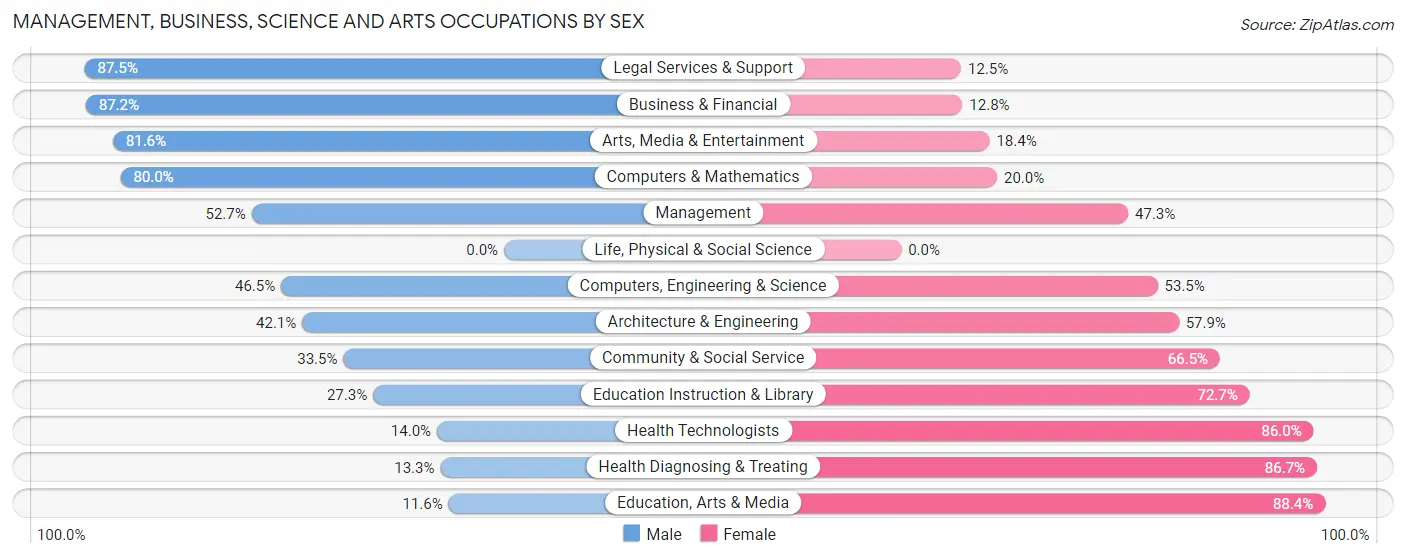
Management, Business, Science and Arts Occupations by Sex
Within the Management, Business, Science and Arts occupations in Petoskey, the most male-oriented occupations are Legal Services & Support (87.5%), Business & Financial (87.2%), and Arts, Media & Entertainment (81.6%), while the most female-oriented occupations are Education, Arts & Media (88.4%), Health Diagnosing & Treating (86.7%), and Health Technologists (86.0%).
| Occupation | Male | Female |
| Management | 168 (52.7%) | 151 (47.3%) |
| Business & Financial | 123 (87.2%) | 18 (12.8%) |
| Computers, Engineering & Science | 20 (46.5%) | 23 (53.5%) |
| Computers & Mathematics | 4 (80.0%) | 1 (20.0%) |
| Architecture & Engineering | 16 (42.1%) | 22 (57.9%) |
| Life, Physical & Social Science | 0 (0.0%) | 0 (0.0%) |
| Community & Social Service | 243 (33.5%) | 482 (66.5%) |
| Education, Arts & Media | 14 (11.6%) | 107 (88.4%) |
| Legal Services & Support | 63 (87.5%) | 9 (12.5%) |
| Education Instruction & Library | 135 (27.3%) | 359 (72.7%) |
| Arts, Media & Entertainment | 31 (81.6%) | 7 (18.4%) |
| Health Diagnosing & Treating | 34 (13.3%) | 222 (86.7%) |
| Health Technologists | 34 (14.0%) | 209 (86.0%) |
| Total (Category) | 588 (39.6%) | 896 (60.4%) |
| Total (Overall) | 1,672 (49.1%) | 1,736 (50.9%) |
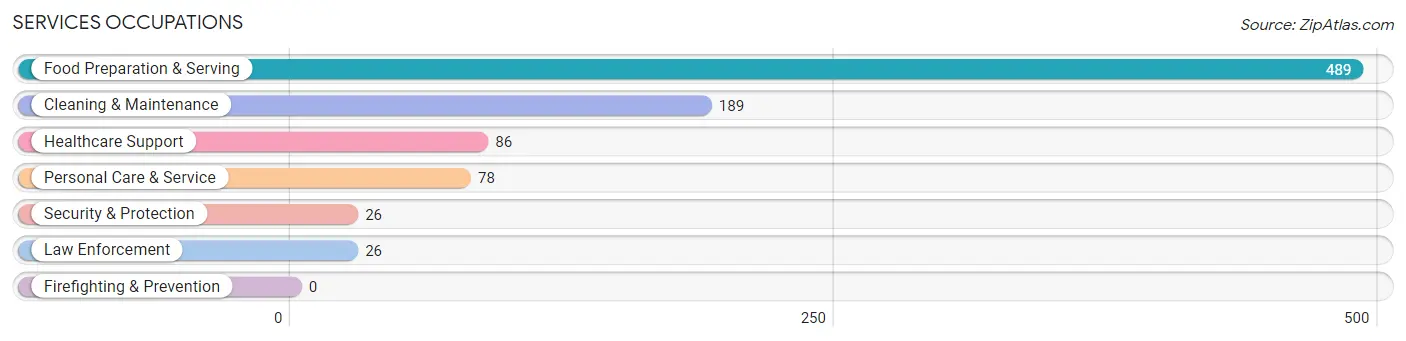
Services Occupations
The most common Services occupations in Petoskey are Food Preparation & Serving (489 | 14.3%), Cleaning & Maintenance (189 | 5.6%), Healthcare Support (86 | 2.5%), Personal Care & Service (78 | 2.3%), and Security & Protection (26 | 0.8%).
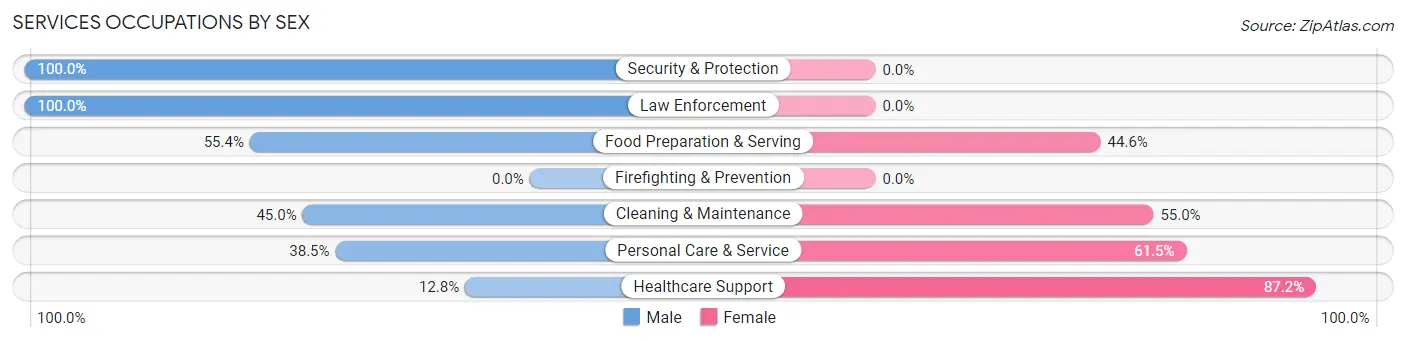
Services Occupations by Sex
Within the Services occupations in Petoskey, the most male-oriented occupations are Security & Protection (100.0%), Law Enforcement (100.0%), and Food Preparation & Serving (55.4%), while the most female-oriented occupations are Healthcare Support (87.2%), Personal Care & Service (61.5%), and Cleaning & Maintenance (55.0%).
| Occupation | Male | Female |
| Healthcare Support | 11 (12.8%) | 75 (87.2%) |
| Security & Protection | 26 (100.0%) | 0 (0.0%) |
| Firefighting & Prevention | 0 (0.0%) | 0 (0.0%) |
| Law Enforcement | 26 (100.0%) | 0 (0.0%) |
| Food Preparation & Serving | 271 (55.4%) | 218 (44.6%) |
| Cleaning & Maintenance | 85 (45.0%) | 104 (55.0%) |
| Personal Care & Service | 30 (38.5%) | 48 (61.5%) |
| Total (Category) | 423 (48.7%) | 445 (51.3%) |
| Total (Overall) | 1,672 (49.1%) | 1,736 (50.9%) |
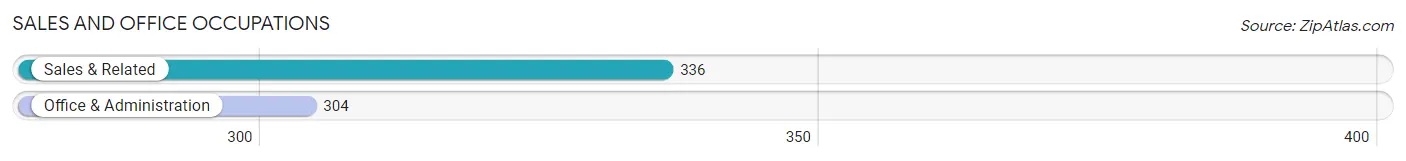
Sales and Office Occupations
The most common Sales and Office occupations in Petoskey are Sales & Related (336 | 9.9%), and Office & Administration (304 | 8.9%).
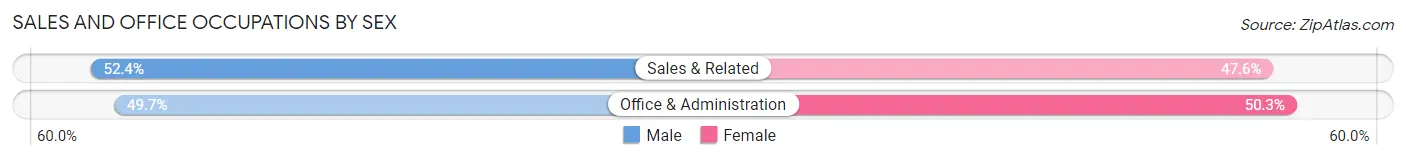
Sales and Office Occupations by Sex
| Occupation | Male | Female |
| Sales & Related | 176 (52.4%) | 160 (47.6%) |
| Office & Administration | 151 (49.7%) | 153 (50.3%) |
| Total (Category) | 327 (51.1%) | 313 (48.9%) |
| Total (Overall) | 1,672 (49.1%) | 1,736 (50.9%) |
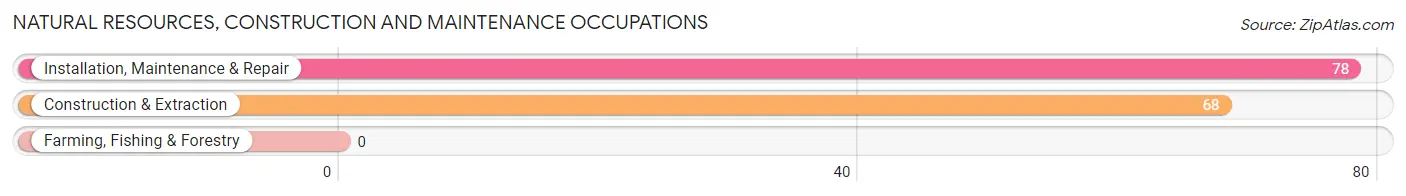
Natural Resources, Construction and Maintenance Occupations
The most common Natural Resources, Construction and Maintenance occupations in Petoskey are Installation, Maintenance & Repair (78 | 2.3%), and Construction & Extraction (68 | 2.0%).
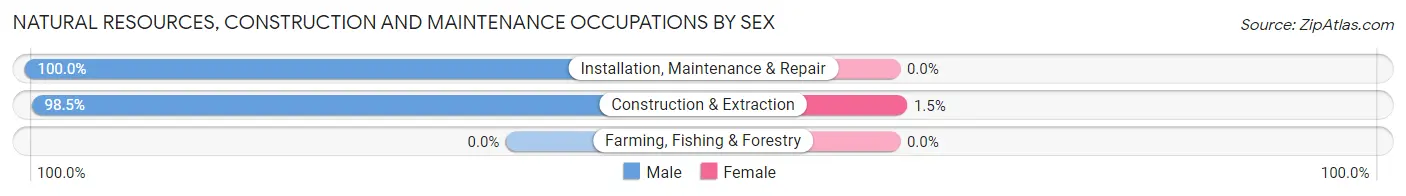
Natural Resources, Construction and Maintenance Occupations by Sex
| Occupation | Male | Female |
| Farming, Fishing & Forestry | 0 (0.0%) | 0 (0.0%) |
| Construction & Extraction | 67 (98.5%) | 1 (1.5%) |
| Installation, Maintenance & Repair | 78 (100.0%) | 0 (0.0%) |
| Total (Category) | 145 (99.3%) | 1 (0.7%) |
| Total (Overall) | 1,672 (49.1%) | 1,736 (50.9%) |
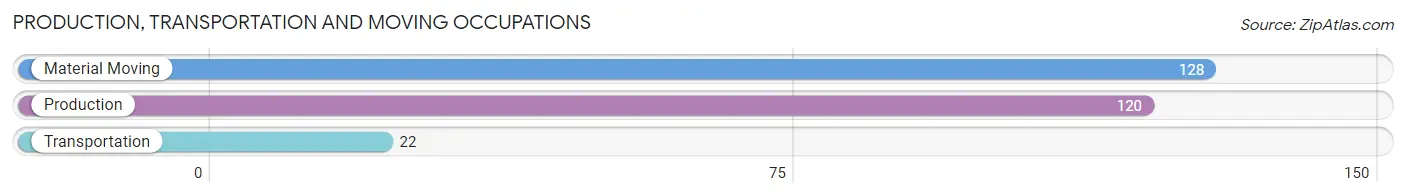
Production, Transportation and Moving Occupations
The most common Production, Transportation and Moving occupations in Petoskey are Material Moving (128 | 3.8%), Production (120 | 3.5%), and Transportation (22 | 0.6%).
Production, Transportation and Moving Occupations by Sex
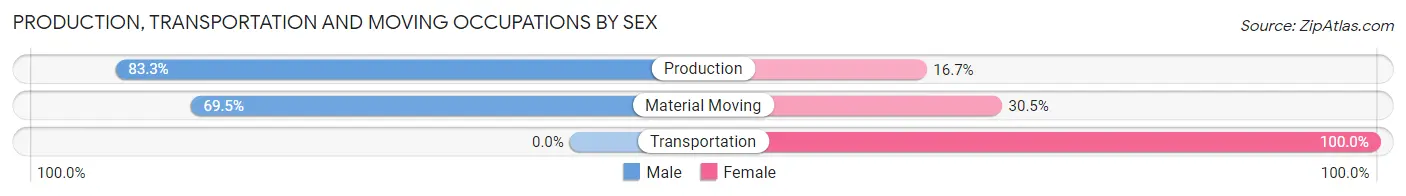
| Occupation | Male | Female |
| Production | 100 (83.3%) | 20 (16.7%) |
| Transportation | 0 (0.0%) | 22 (100.0%) |
| Material Moving | 89 (69.5%) | 39 (30.5%) |
| Total (Category) | 189 (70.0%) | 81 (30.0%) |
| Total (Overall) | 1,672 (49.1%) | 1,736 (50.9%) |
Employment Industries by Sex in Petoskey
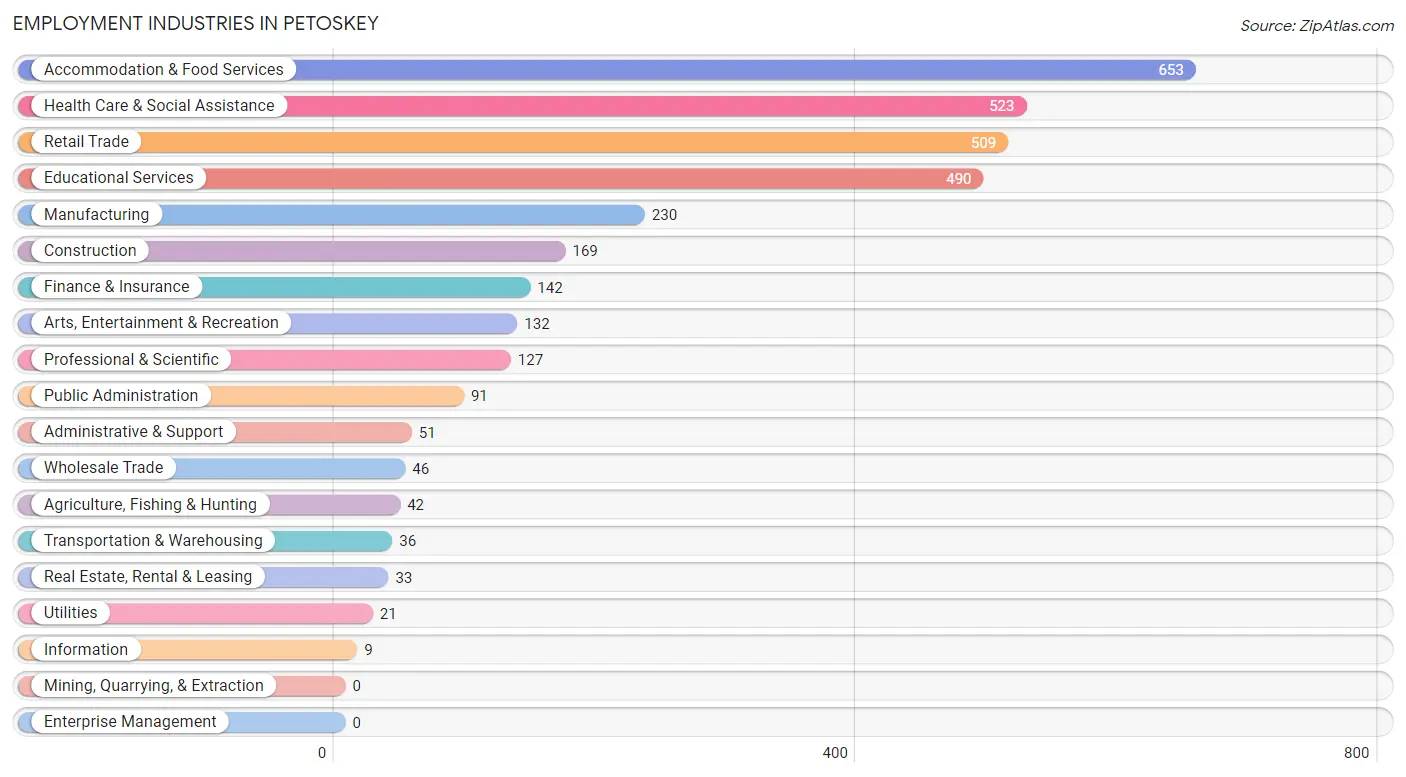
Employment Industries in Petoskey
The major employment industries in Petoskey include Accommodation & Food Services (653 | 19.2%), Health Care & Social Assistance (523 | 15.3%), Retail Trade (509 | 14.9%), Educational Services (490 | 14.4%), and Manufacturing (230 | 6.8%).
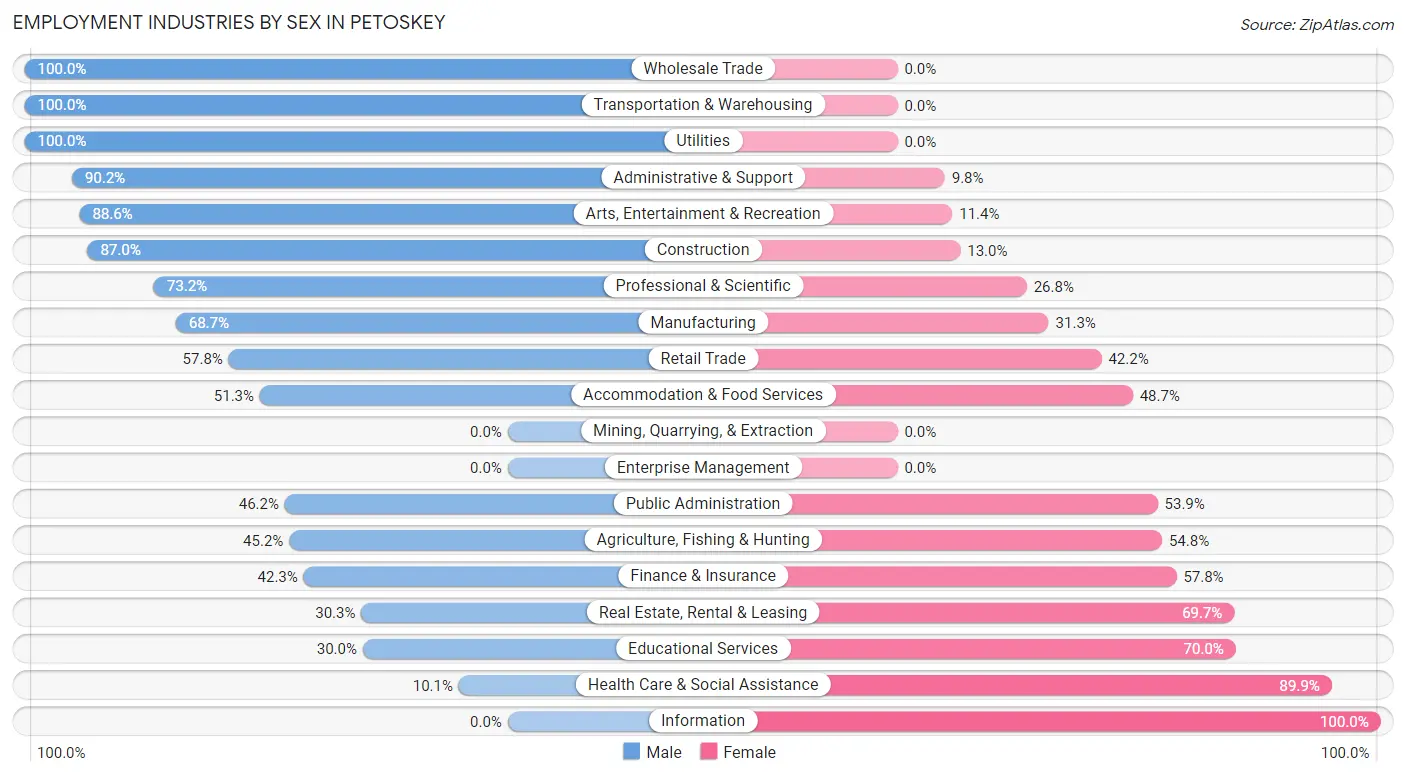
Employment Industries by Sex in Petoskey
The Petoskey industries that see more men than women are Wholesale Trade (100.0%), Transportation & Warehousing (100.0%), and Utilities (100.0%), whereas the industries that tend to have a higher number of women are Information (100.0%), Health Care & Social Assistance (89.9%), and Educational Services (70.0%).
| Industry | Male | Female |
| Agriculture, Fishing & Hunting | 19 (45.2%) | 23 (54.8%) |
| Mining, Quarrying, & Extraction | 0 (0.0%) | 0 (0.0%) |
| Construction | 147 (87.0%) | 22 (13.0%) |
| Manufacturing | 158 (68.7%) | 72 (31.3%) |
| Wholesale Trade | 46 (100.0%) | 0 (0.0%) |
| Retail Trade | 294 (57.8%) | 215 (42.2%) |
| Transportation & Warehousing | 36 (100.0%) | 0 (0.0%) |
| Utilities | 21 (100.0%) | 0 (0.0%) |
| Information | 0 (0.0%) | 9 (100.0%) |
| Finance & Insurance | 60 (42.2%) | 82 (57.8%) |
| Real Estate, Rental & Leasing | 10 (30.3%) | 23 (69.7%) |
| Professional & Scientific | 93 (73.2%) | 34 (26.8%) |
| Enterprise Management | 0 (0.0%) | 0 (0.0%) |
| Administrative & Support | 46 (90.2%) | 5 (9.8%) |
| Educational Services | 147 (30.0%) | 343 (70.0%) |
| Health Care & Social Assistance | 53 (10.1%) | 470 (89.9%) |
| Arts, Entertainment & Recreation | 117 (88.6%) | 15 (11.4%) |
| Accommodation & Food Services | 335 (51.3%) | 318 (48.7%) |
| Public Administration | 42 (46.2%) | 49 (53.8%) |
| Total | 1,672 (49.1%) | 1,736 (50.9%) |
Education in Petoskey
School Enrollment in Petoskey
The most common levels of schooling among the 1,252 students in Petoskey are high school (343 | 27.4%), elementary school (332 | 26.5%), and college / undergraduate (239 | 19.1%).
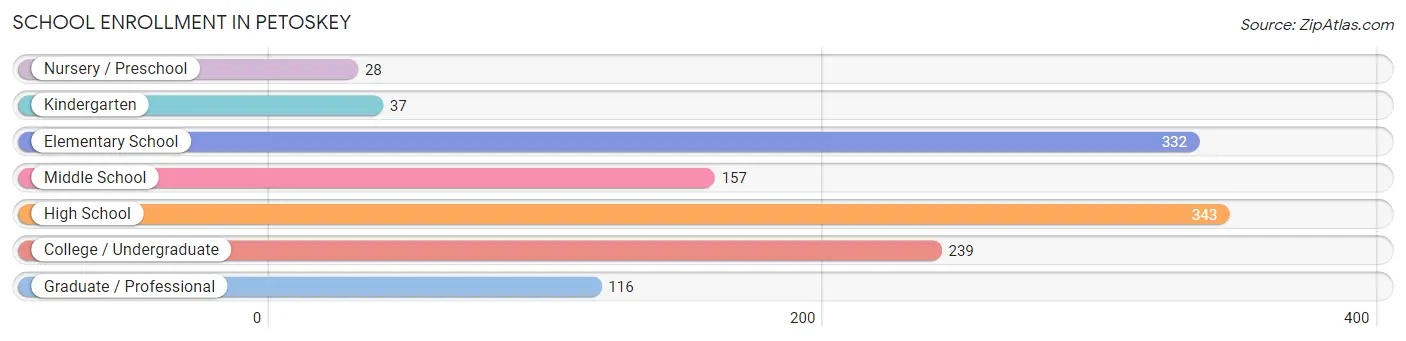
| School Level | # Students | % Students |
| Nursery / Preschool | 28 | 2.2% |
| Kindergarten | 37 | 3.0% |
| Elementary School | 332 | 26.5% |
| Middle School | 157 | 12.5% |
| High School | 343 | 27.4% |
| College / Undergraduate | 239 | 19.1% |
| Graduate / Professional | 116 | 9.3% |
| Total | 1,252 | 100.0% |
School Enrollment by Age by Funding Source in Petoskey
Out of a total of 1,252 students who are enrolled in schools in Petoskey, 177 (14.1%) attend a private institution, while the remaining 1,075 (85.9%) are enrolled in public schools. The age group of 20 to 24 year olds has the highest likelihood of being enrolled in private schools, with 45 (32.4% in the age bracket) enrolled. Conversely, the age group of 3 to 4 year olds has the lowest likelihood of being enrolled in a private school, with 20 (100.0% in the age bracket) attending a public institution.
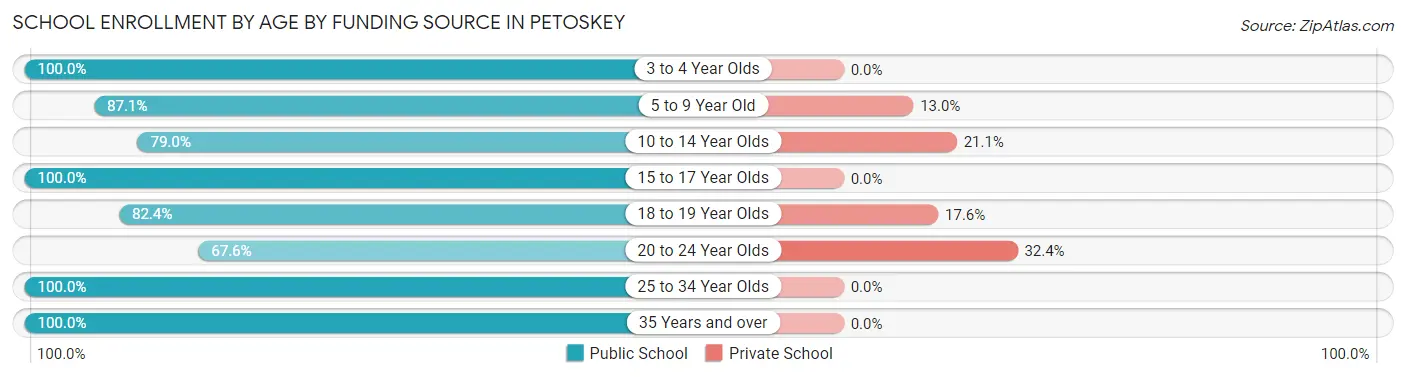
| Age Bracket | Public School | Private School |
| 3 to 4 Year Olds | 20 (100.0%) | 0 (0.0%) |
| 5 to 9 Year Old | 242 (87.1%) | 36 (13.0%) |
| 10 to 14 Year Olds | 225 (78.9%) | 60 (21.0%) |
| 15 to 17 Year Olds | 227 (100.0%) | 0 (0.0%) |
| 18 to 19 Year Olds | 164 (82.4%) | 35 (17.6%) |
| 20 to 24 Year Olds | 94 (67.6%) | 45 (32.4%) |
| 25 to 34 Year Olds | 75 (100.0%) | 0 (0.0%) |
| 35 Years and over | 29 (100.0%) | 0 (0.0%) |
| Total | 1,075 (85.9%) | 177 (14.1%) |
Educational Attainment by Field of Study in Petoskey
Education (686 | 29.6%), business (407 | 17.6%), science & technology (286 | 12.3%), social sciences (263 | 11.4%), and bio, nature & agricultural (153 | 6.6%) are the most common fields of study among 2,317 individuals in Petoskey who have obtained a bachelor's degree or higher.
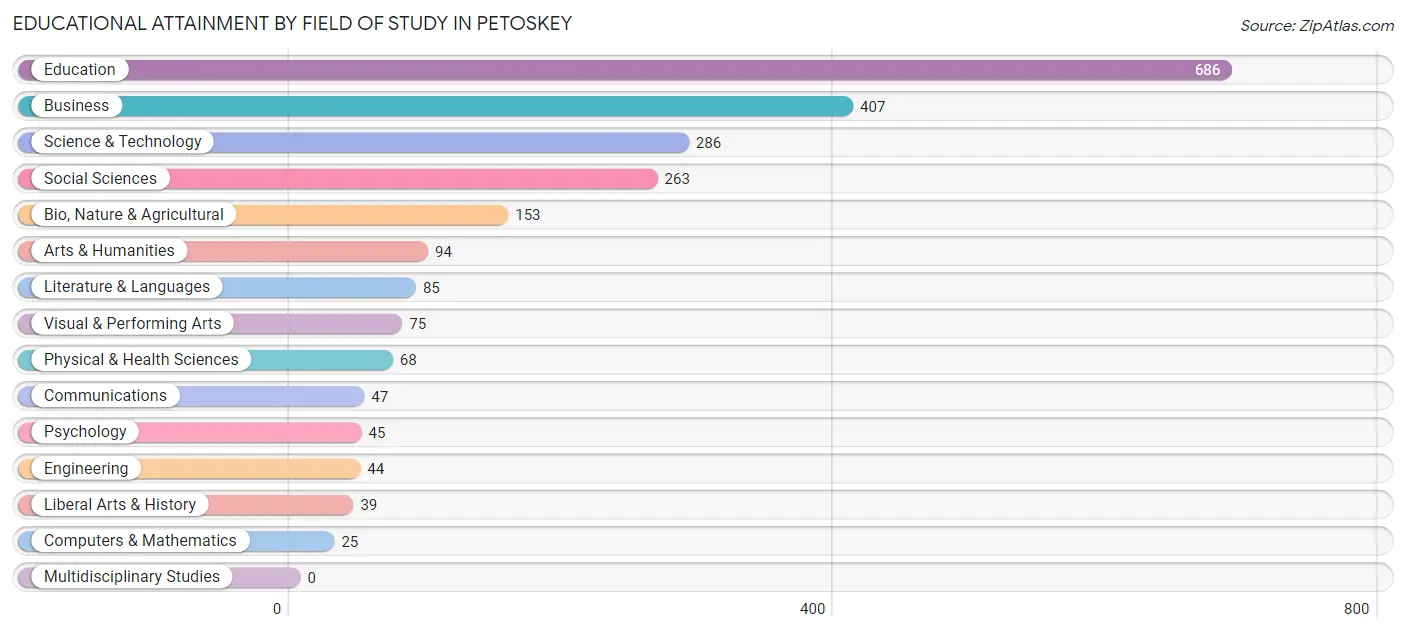
| Field of Study | # Graduates | % Graduates |
| Computers & Mathematics | 25 | 1.1% |
| Bio, Nature & Agricultural | 153 | 6.6% |
| Physical & Health Sciences | 68 | 2.9% |
| Psychology | 45 | 1.9% |
| Social Sciences | 263 | 11.4% |
| Engineering | 44 | 1.9% |
| Multidisciplinary Studies | 0 | 0.0% |
| Science & Technology | 286 | 12.3% |
| Business | 407 | 17.6% |
| Education | 686 | 29.6% |
| Literature & Languages | 85 | 3.7% |
| Liberal Arts & History | 39 | 1.7% |
| Visual & Performing Arts | 75 | 3.2% |
| Communications | 47 | 2.0% |
| Arts & Humanities | 94 | 4.1% |
| Total | 2,317 | 100.0% |
Transportation & Commute in Petoskey
Vehicle Availability by Sex in Petoskey
The most prevalent vehicle ownership categories in Petoskey are males with 2 vehicles (763, accounting for 46.4%) and females with 2 vehicles (669, making up 47.2%).
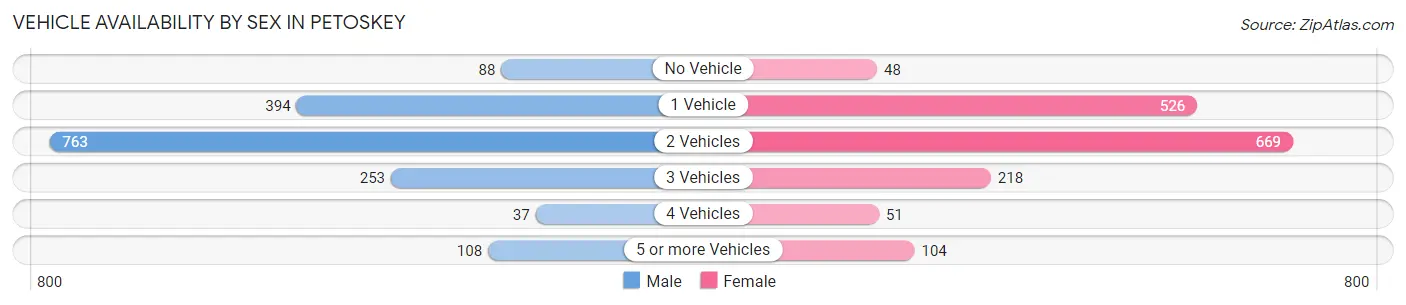
| Vehicles Available | Male | Female |
| No Vehicle | 88 (5.4%) | 48 (3.0%) |
| 1 Vehicle | 394 (24.0%) | 526 (32.6%) |
| 2 Vehicles | 763 (46.4%) | 669 (41.4%) |
| 3 Vehicles | 253 (15.4%) | 218 (13.5%) |
| 4 Vehicles | 37 (2.2%) | 51 (3.2%) |
| 5 or more Vehicles | 108 (6.6%) | 104 (6.4%) |
| Total | 1,643 (100.0%) | 1,616 (100.0%) |
Commute Time in Petoskey
The most frequently occuring commute durations in Petoskey are 5 to 9 minutes (956 commuters, 30.5%), 10 to 14 minutes (551 commuters, 17.6%), and 15 to 19 minutes (345 commuters, 11.0%).
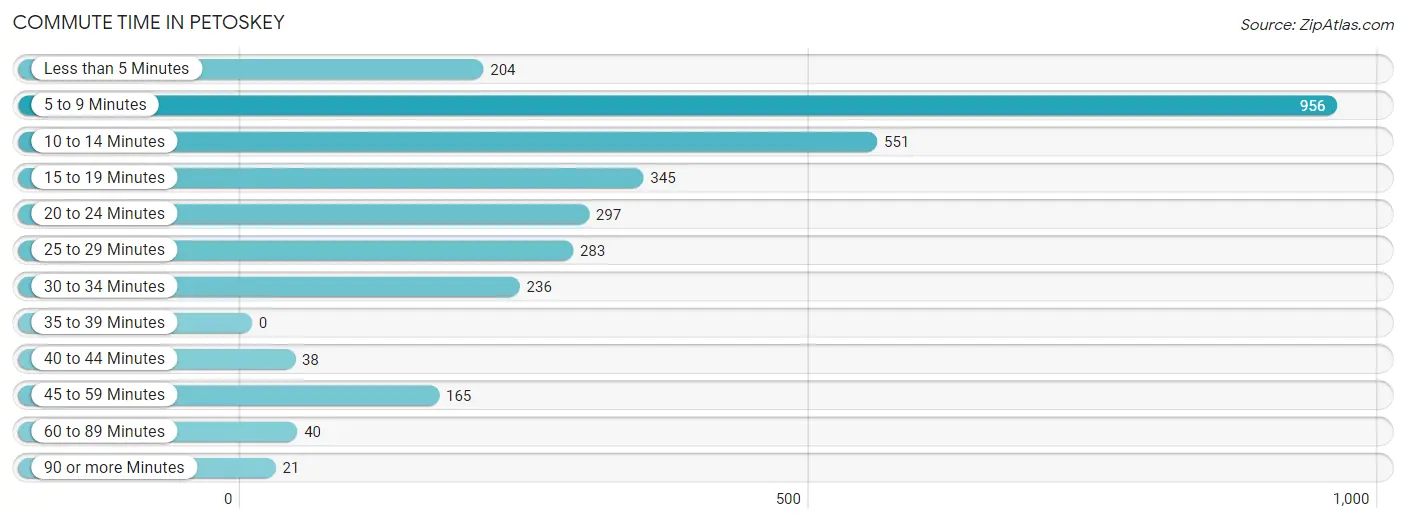
| Commute Time | # Commuters | % Commuters |
| Less than 5 Minutes | 204 | 6.5% |
| 5 to 9 Minutes | 956 | 30.5% |
| 10 to 14 Minutes | 551 | 17.6% |
| 15 to 19 Minutes | 345 | 11.0% |
| 20 to 24 Minutes | 297 | 9.5% |
| 25 to 29 Minutes | 283 | 9.0% |
| 30 to 34 Minutes | 236 | 7.5% |
| 35 to 39 Minutes | 0 | 0.0% |
| 40 to 44 Minutes | 38 | 1.2% |
| 45 to 59 Minutes | 165 | 5.3% |
| 60 to 89 Minutes | 40 | 1.3% |
| 90 or more Minutes | 21 | 0.7% |
Commute Time by Sex in Petoskey
The most common commute times in Petoskey are 5 to 9 minutes (452 commuters, 29.4%) for males and 5 to 9 minutes (504 commuters, 31.5%) for females.
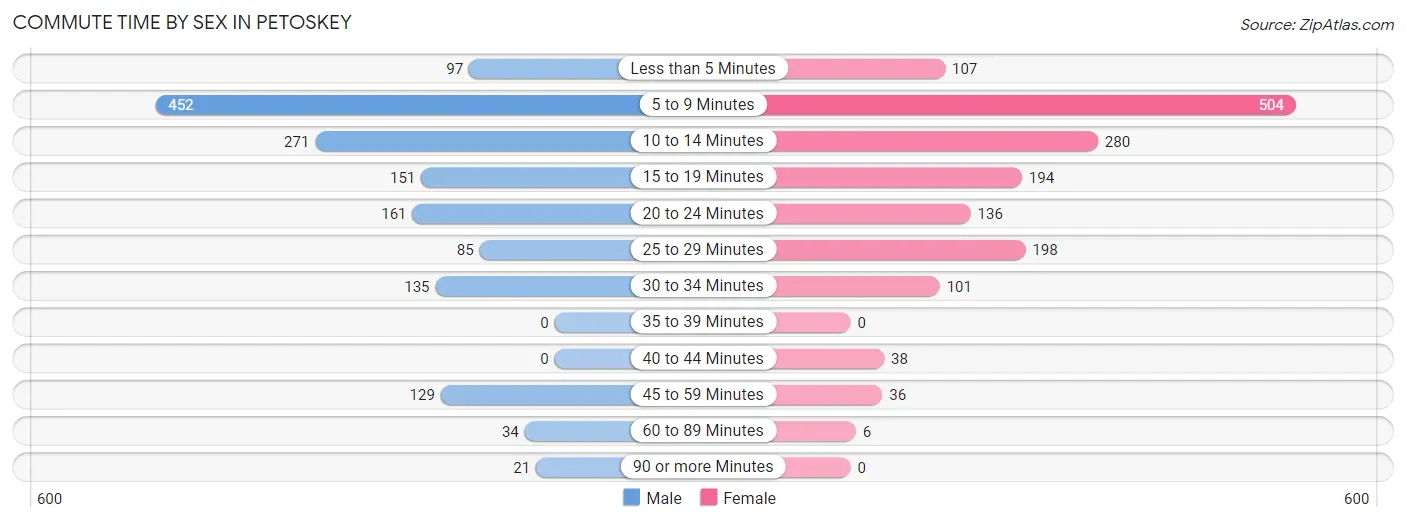
| Commute Time | Male | Female |
| Less than 5 Minutes | 97 (6.3%) | 107 (6.7%) |
| 5 to 9 Minutes | 452 (29.4%) | 504 (31.5%) |
| 10 to 14 Minutes | 271 (17.6%) | 280 (17.5%) |
| 15 to 19 Minutes | 151 (9.8%) | 194 (12.1%) |
| 20 to 24 Minutes | 161 (10.5%) | 136 (8.5%) |
| 25 to 29 Minutes | 85 (5.5%) | 198 (12.4%) |
| 30 to 34 Minutes | 135 (8.8%) | 101 (6.3%) |
| 35 to 39 Minutes | 0 (0.0%) | 0 (0.0%) |
| 40 to 44 Minutes | 0 (0.0%) | 38 (2.4%) |
| 45 to 59 Minutes | 129 (8.4%) | 36 (2.2%) |
| 60 to 89 Minutes | 34 (2.2%) | 6 (0.4%) |
| 90 or more Minutes | 21 (1.4%) | 0 (0.0%) |
Time of Departure to Work by Sex in Petoskey
The most frequent times of departure to work in Petoskey are 7:00 AM to 7:29 AM (221, 14.4%) for males and 7:30 AM to 7:59 AM (333, 20.8%) for females.
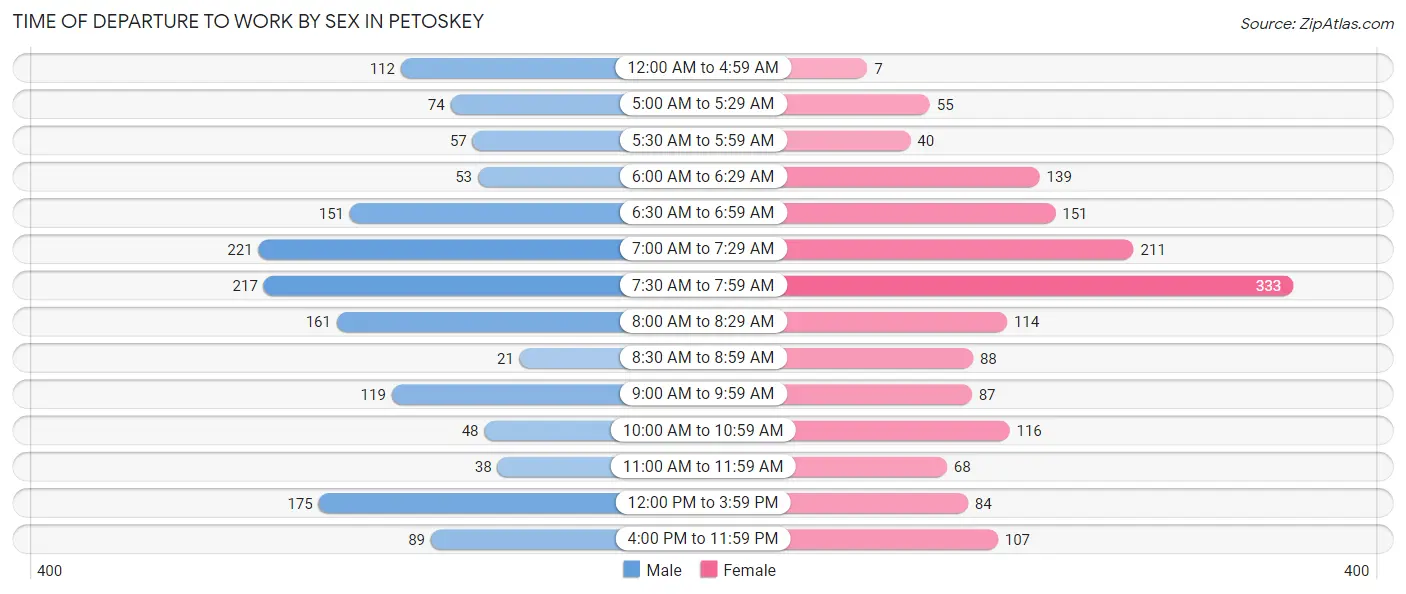
| Time of Departure | Male | Female |
| 12:00 AM to 4:59 AM | 112 (7.3%) | 7 (0.4%) |
| 5:00 AM to 5:29 AM | 74 (4.8%) | 55 (3.4%) |
| 5:30 AM to 5:59 AM | 57 (3.7%) | 40 (2.5%) |
| 6:00 AM to 6:29 AM | 53 (3.5%) | 139 (8.7%) |
| 6:30 AM to 6:59 AM | 151 (9.8%) | 151 (9.4%) |
| 7:00 AM to 7:29 AM | 221 (14.4%) | 211 (13.2%) |
| 7:30 AM to 7:59 AM | 217 (14.1%) | 333 (20.8%) |
| 8:00 AM to 8:29 AM | 161 (10.5%) | 114 (7.1%) |
| 8:30 AM to 8:59 AM | 21 (1.4%) | 88 (5.5%) |
| 9:00 AM to 9:59 AM | 119 (7.7%) | 87 (5.4%) |
| 10:00 AM to 10:59 AM | 48 (3.1%) | 116 (7.2%) |
| 11:00 AM to 11:59 AM | 38 (2.5%) | 68 (4.3%) |
| 12:00 PM to 3:59 PM | 175 (11.4%) | 84 (5.2%) |
| 4:00 PM to 11:59 PM | 89 (5.8%) | 107 (6.7%) |
| Total | 1,536 (100.0%) | 1,600 (100.0%) |
Housing Occupancy in Petoskey
Occupancy by Ownership in Petoskey
Of the total 2,583 dwellings in Petoskey, owner-occupied units account for 1,467 (56.8%), while renter-occupied units make up 1,116 (43.2%).
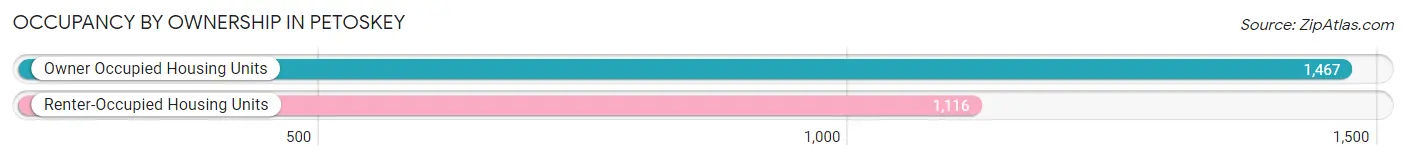
| Occupancy | # Housing Units | % Housing Units |
| Owner Occupied Housing Units | 1,467 | 56.8% |
| Renter-Occupied Housing Units | 1,116 | 43.2% |
| Total Occupied Housing Units | 2,583 | 100.0% |
Occupancy by Household Size in Petoskey
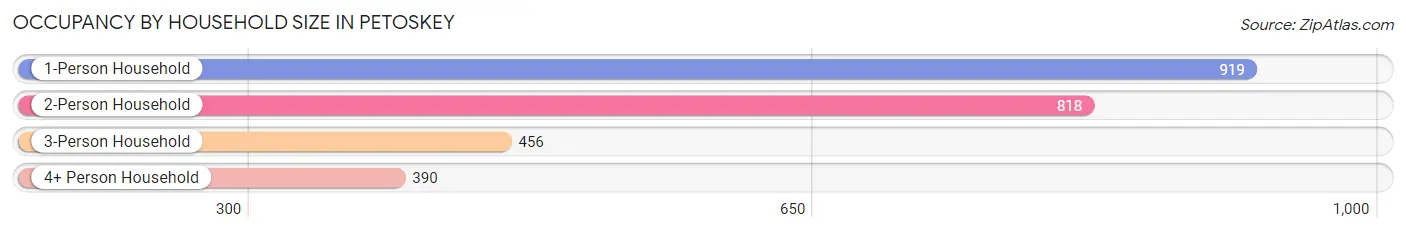
| Household Size | # Housing Units | % Housing Units |
| 1-Person Household | 919 | 35.6% |
| 2-Person Household | 818 | 31.7% |
| 3-Person Household | 456 | 17.6% |
| 4+ Person Household | 390 | 15.1% |
| Total Housing Units | 2,583 | 100.0% |
Occupancy by Ownership by Household Size in Petoskey
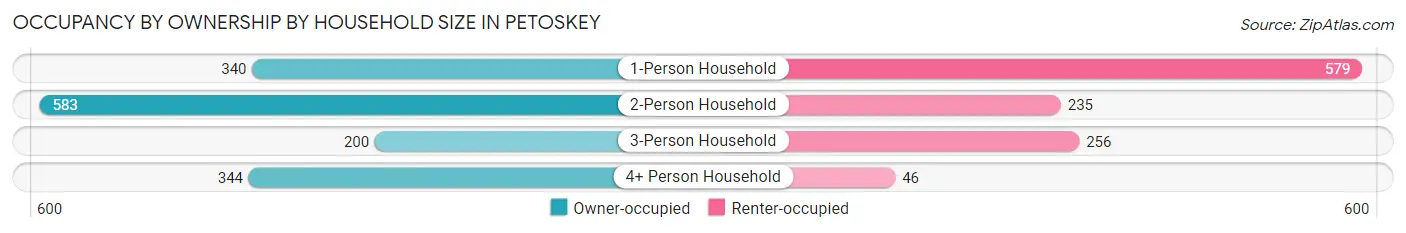
| Household Size | Owner-occupied | Renter-occupied |
| 1-Person Household | 340 (37.0%) | 579 (63.0%) |
| 2-Person Household | 583 (71.3%) | 235 (28.7%) |
| 3-Person Household | 200 (43.9%) | 256 (56.1%) |
| 4+ Person Household | 344 (88.2%) | 46 (11.8%) |
| Total Housing Units | 1,467 (56.8%) | 1,116 (43.2%) |
Occupancy by Educational Attainment in Petoskey
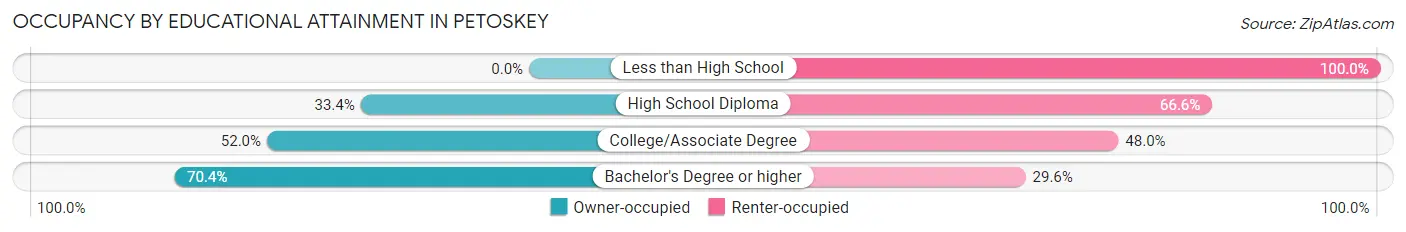
| Household Size | Owner-occupied | Renter-occupied |
| Less than High School | 0 (0.0%) | 49 (100.0%) |
| High School Diploma | 159 (33.4%) | 317 (66.6%) |
| College/Associate Degree | 396 (52.0%) | 366 (48.0%) |
| Bachelor's Degree or higher | 912 (70.4%) | 384 (29.6%) |
Occupancy by Age of Householder in Petoskey
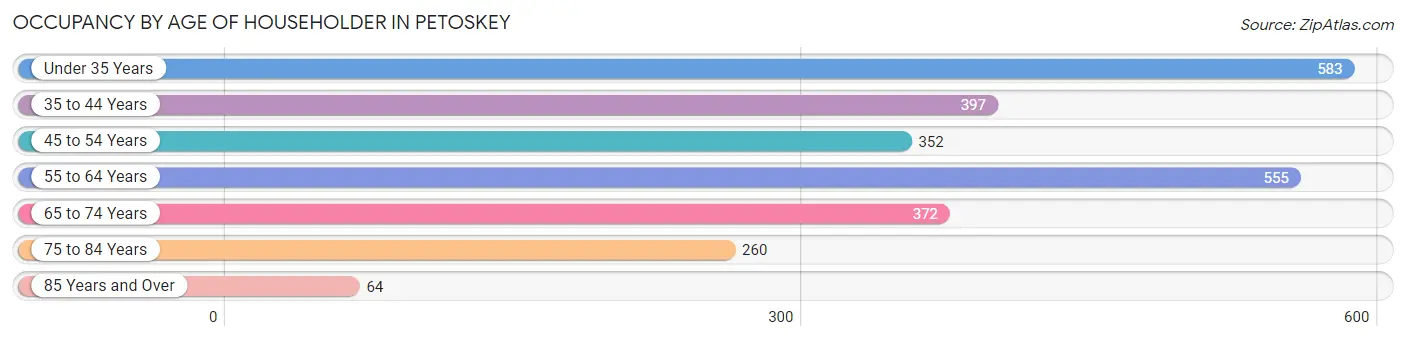
| Age Bracket | # Households | % Households |
| Under 35 Years | 583 | 22.6% |
| 35 to 44 Years | 397 | 15.4% |
| 45 to 54 Years | 352 | 13.6% |
| 55 to 64 Years | 555 | 21.5% |
| 65 to 74 Years | 372 | 14.4% |
| 75 to 84 Years | 260 | 10.1% |
| 85 Years and Over | 64 | 2.5% |
| Total | 2,583 | 100.0% |
Housing Finances in Petoskey
Median Income by Occupancy in Petoskey
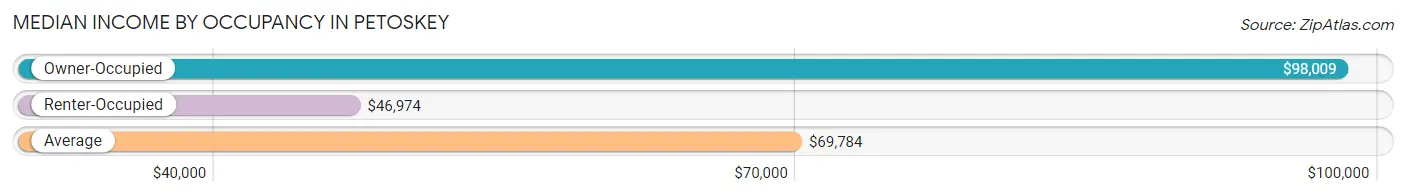
| Occupancy Type | # Households | Median Income |
| Owner-Occupied | 1,467 (56.8%) | $98,009 |
| Renter-Occupied | 1,116 (43.2%) | $46,974 |
| Average | 2,583 (100.0%) | $69,784 |
Occupancy by Householder Income Bracket in Petoskey
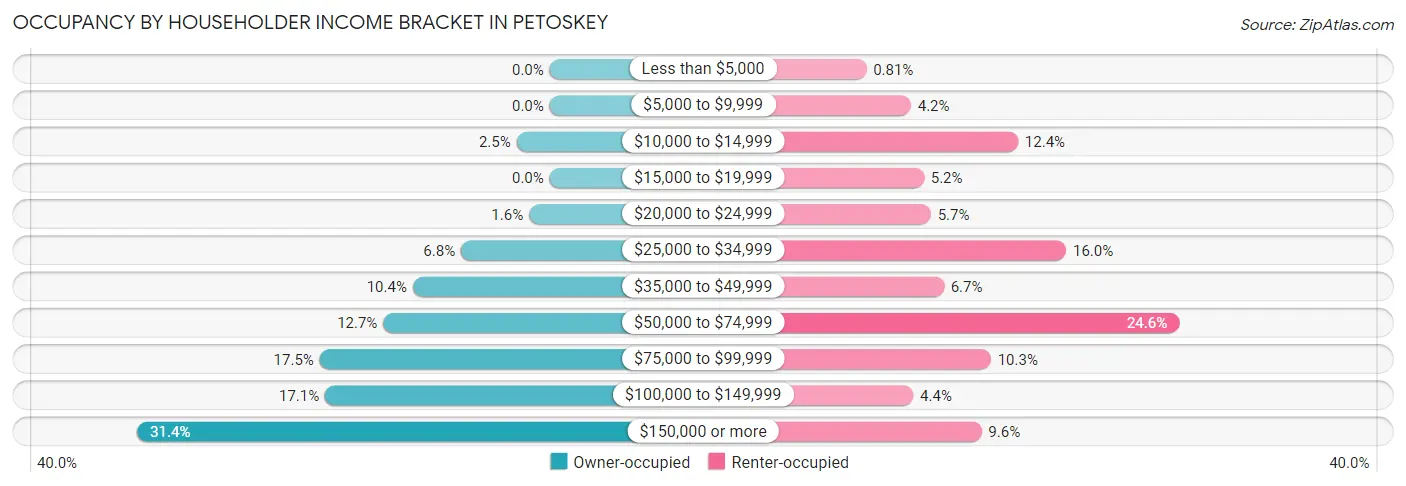
| Income Bracket | Owner-occupied | Renter-occupied |
| Less than $5,000 | 0 (0.0%) | 9 (0.8%) |
| $5,000 to $9,999 | 0 (0.0%) | 47 (4.2%) |
| $10,000 to $14,999 | 37 (2.5%) | 138 (12.4%) |
| $15,000 to $19,999 | 0 (0.0%) | 58 (5.2%) |
| $20,000 to $24,999 | 23 (1.6%) | 64 (5.7%) |
| $25,000 to $34,999 | 99 (6.8%) | 179 (16.0%) |
| $35,000 to $49,999 | 153 (10.4%) | 75 (6.7%) |
| $50,000 to $74,999 | 186 (12.7%) | 275 (24.6%) |
| $75,000 to $99,999 | 257 (17.5%) | 115 (10.3%) |
| $100,000 to $149,999 | 251 (17.1%) | 49 (4.4%) |
| $150,000 or more | 461 (31.4%) | 107 (9.6%) |
| Total | 1,467 (100.0%) | 1,116 (100.0%) |
Monthly Housing Cost Tiers in Petoskey
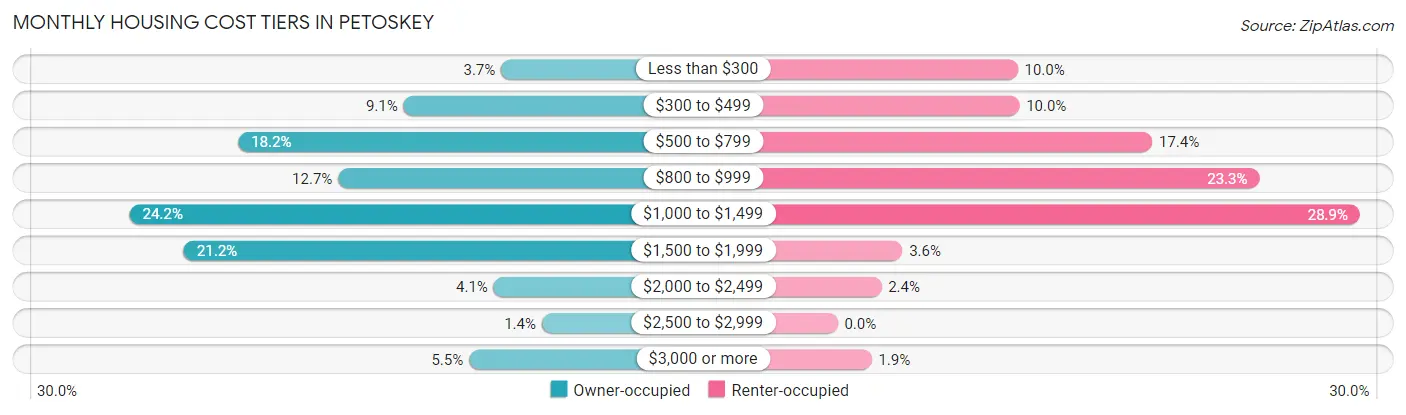
| Monthly Cost | Owner-occupied | Renter-occupied |
| Less than $300 | 54 (3.7%) | 111 (10.0%) |
| $300 to $499 | 133 (9.1%) | 112 (10.0%) |
| $500 to $799 | 267 (18.2%) | 194 (17.4%) |
| $800 to $999 | 186 (12.7%) | 260 (23.3%) |
| $1,000 to $1,499 | 355 (24.2%) | 322 (28.8%) |
| $1,500 to $1,999 | 311 (21.2%) | 40 (3.6%) |
| $2,000 to $2,499 | 60 (4.1%) | 27 (2.4%) |
| $2,500 to $2,999 | 21 (1.4%) | 0 (0.0%) |
| $3,000 or more | 80 (5.4%) | 21 (1.9%) |
| Total | 1,467 (100.0%) | 1,116 (100.0%) |
Physical Housing Characteristics in Petoskey
Housing Structures in Petoskey
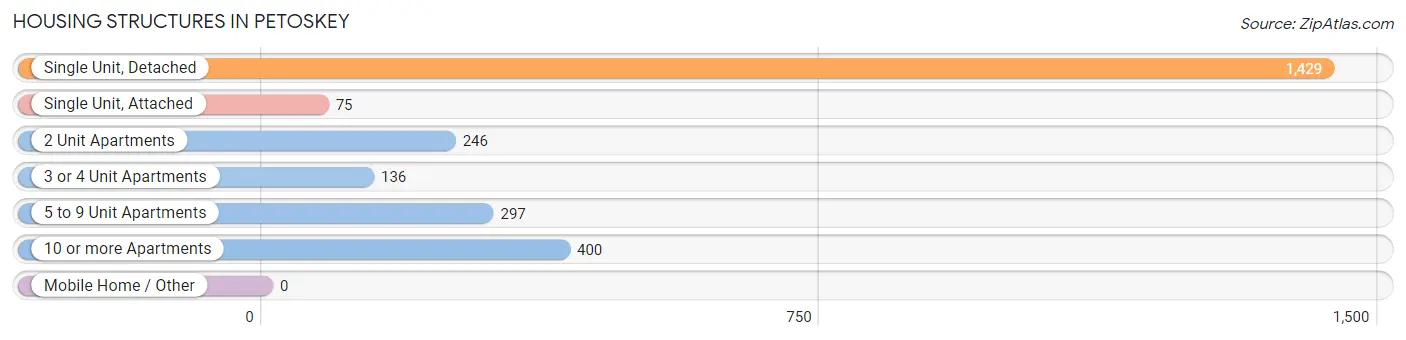
| Structure Type | # Housing Units | % Housing Units |
| Single Unit, Detached | 1,429 | 55.3% |
| Single Unit, Attached | 75 | 2.9% |
| 2 Unit Apartments | 246 | 9.5% |
| 3 or 4 Unit Apartments | 136 | 5.3% |
| 5 to 9 Unit Apartments | 297 | 11.5% |
| 10 or more Apartments | 400 | 15.5% |
| Mobile Home / Other | 0 | 0.0% |
| Total | 2,583 | 100.0% |
Housing Structures by Occupancy in Petoskey
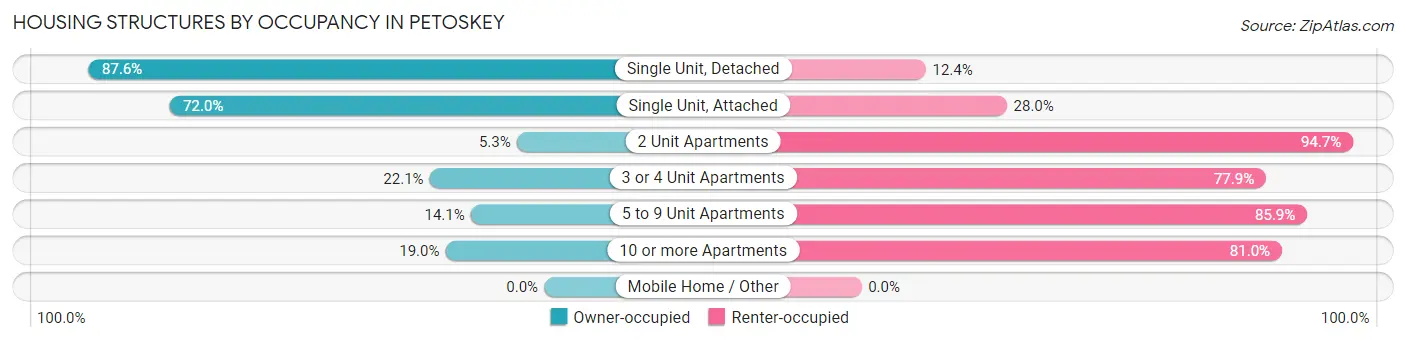
| Structure Type | Owner-occupied | Renter-occupied |
| Single Unit, Detached | 1,252 (87.6%) | 177 (12.4%) |
| Single Unit, Attached | 54 (72.0%) | 21 (28.0%) |
| 2 Unit Apartments | 13 (5.3%) | 233 (94.7%) |
| 3 or 4 Unit Apartments | 30 (22.1%) | 106 (77.9%) |
| 5 to 9 Unit Apartments | 42 (14.1%) | 255 (85.9%) |
| 10 or more Apartments | 76 (19.0%) | 324 (81.0%) |
| Mobile Home / Other | 0 (0.0%) | 0 (0.0%) |
| Total | 1,467 (56.8%) | 1,116 (43.2%) |
Housing Structures by Number of Rooms in Petoskey
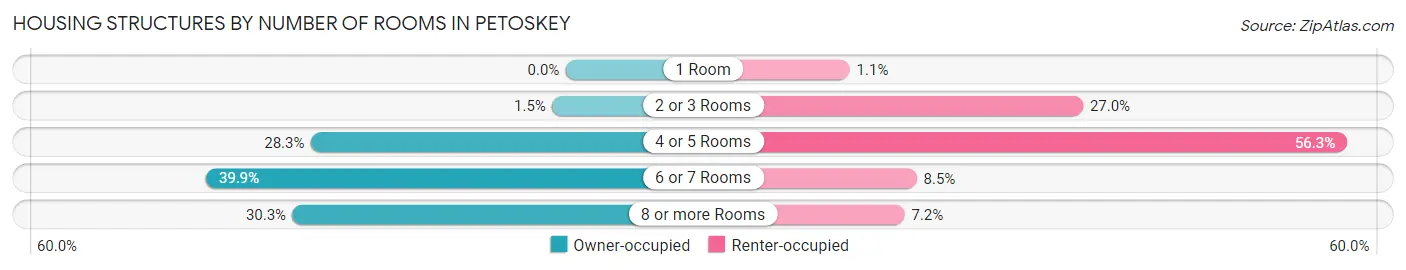
| Number of Rooms | Owner-occupied | Renter-occupied |
| 1 Room | 0 (0.0%) | 12 (1.1%) |
| 2 or 3 Rooms | 22 (1.5%) | 301 (27.0%) |
| 4 or 5 Rooms | 415 (28.3%) | 628 (56.3%) |
| 6 or 7 Rooms | 585 (39.9%) | 95 (8.5%) |
| 8 or more Rooms | 445 (30.3%) | 80 (7.2%) |
| Total | 1,467 (100.0%) | 1,116 (100.0%) |
Housing Structure by Heating Type in Petoskey
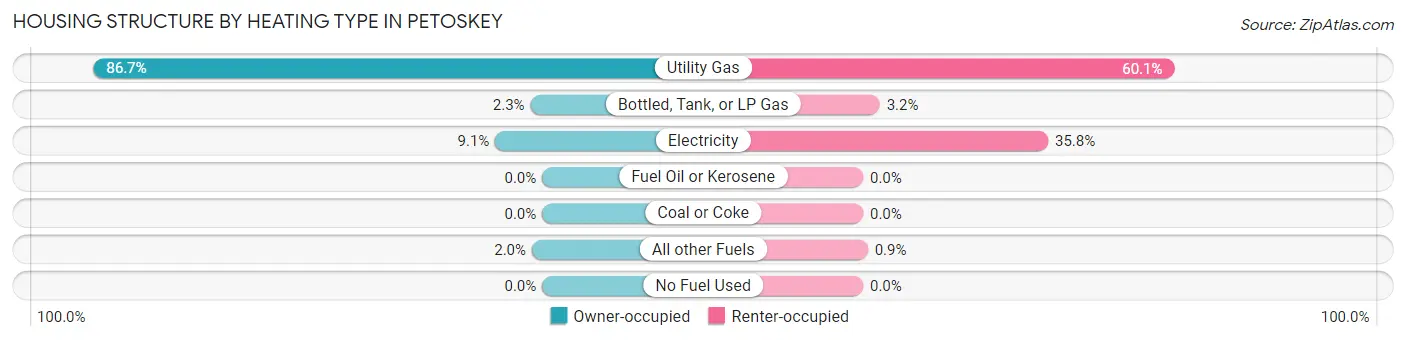
| Heating Type | Owner-occupied | Renter-occupied |
| Utility Gas | 1,272 (86.7%) | 671 (60.1%) |
| Bottled, Tank, or LP Gas | 33 (2.2%) | 36 (3.2%) |
| Electricity | 133 (9.1%) | 399 (35.7%) |
| Fuel Oil or Kerosene | 0 (0.0%) | 0 (0.0%) |
| Coal or Coke | 0 (0.0%) | 0 (0.0%) |
| All other Fuels | 29 (2.0%) | 10 (0.9%) |
| No Fuel Used | 0 (0.0%) | 0 (0.0%) |
| Total | 1,467 (100.0%) | 1,116 (100.0%) |
Household Vehicle Usage in Petoskey
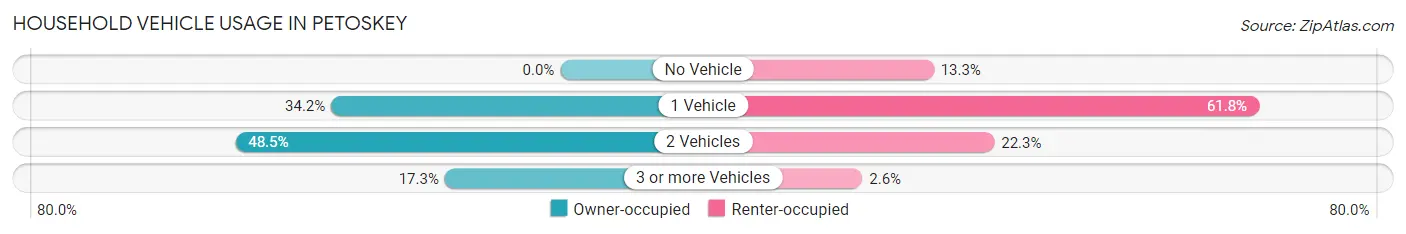
| Vehicles per Household | Owner-occupied | Renter-occupied |
| No Vehicle | 0 (0.0%) | 148 (13.3%) |
| 1 Vehicle | 502 (34.2%) | 690 (61.8%) |
| 2 Vehicles | 712 (48.5%) | 249 (22.3%) |
| 3 or more Vehicles | 253 (17.2%) | 29 (2.6%) |
| Total | 1,467 (100.0%) | 1,116 (100.0%) |
Real Estate & Mortgages in Petoskey
Real Estate and Mortgage Overview in Petoskey
| Characteristic | Without Mortgage | With Mortgage |
| Housing Units | 686 | 781 |
| Median Property Value | $247,400 | $264,000 |
| Median Household Income | $61,250 | $299 |
| Monthly Housing Costs | $708 | $80 |
| Real Estate Taxes | $4,092 | $11 |
Property Value by Mortgage Status in Petoskey
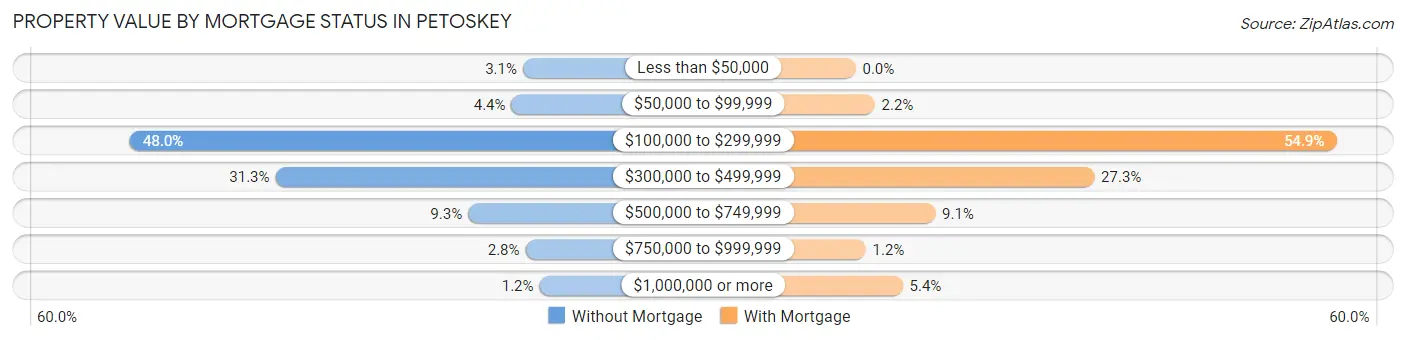
| Property Value | Without Mortgage | With Mortgage |
| Less than $50,000 | 21 (3.1%) | 0 (0.0%) |
| $50,000 to $99,999 | 30 (4.4%) | 17 (2.2%) |
| $100,000 to $299,999 | 329 (48.0%) | 429 (54.9%) |
| $300,000 to $499,999 | 215 (31.3%) | 213 (27.3%) |
| $500,000 to $749,999 | 64 (9.3%) | 71 (9.1%) |
| $750,000 to $999,999 | 19 (2.8%) | 9 (1.1%) |
| $1,000,000 or more | 8 (1.2%) | 42 (5.4%) |
| Total | 686 (100.0%) | 781 (100.0%) |
Household Income by Mortgage Status in Petoskey
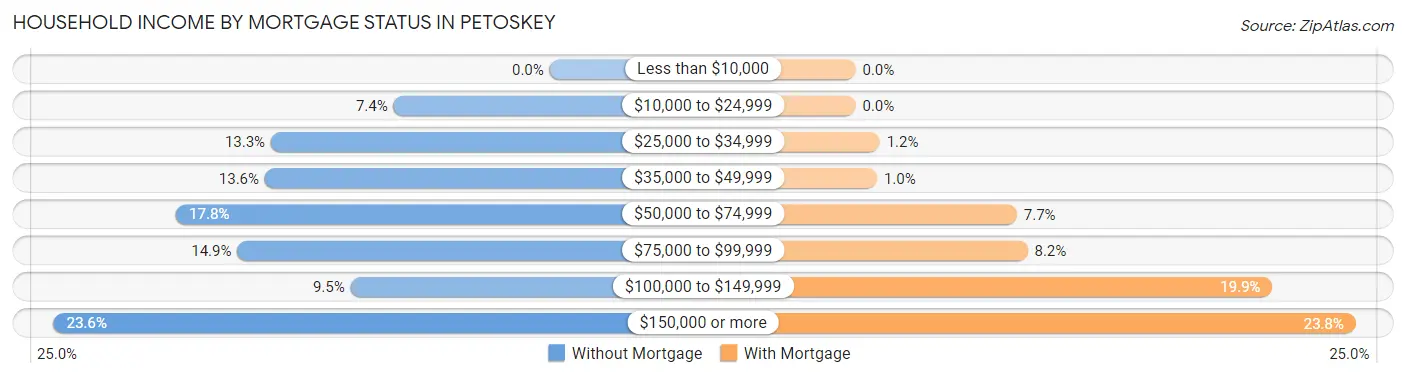
| Household Income | Without Mortgage | With Mortgage |
| Less than $10,000 | 0 (0.0%) | 0 (0.0%) |
| $10,000 to $24,999 | 51 (7.4%) | 0 (0.0%) |
| $25,000 to $34,999 | 91 (13.3%) | 9 (1.1%) |
| $35,000 to $49,999 | 93 (13.6%) | 8 (1.0%) |
| $50,000 to $74,999 | 122 (17.8%) | 60 (7.7%) |
| $75,000 to $99,999 | 102 (14.9%) | 64 (8.2%) |
| $100,000 to $149,999 | 65 (9.5%) | 155 (19.9%) |
| $150,000 or more | 162 (23.6%) | 186 (23.8%) |
| Total | 686 (100.0%) | 781 (100.0%) |
Property Value to Household Income Ratio in Petoskey
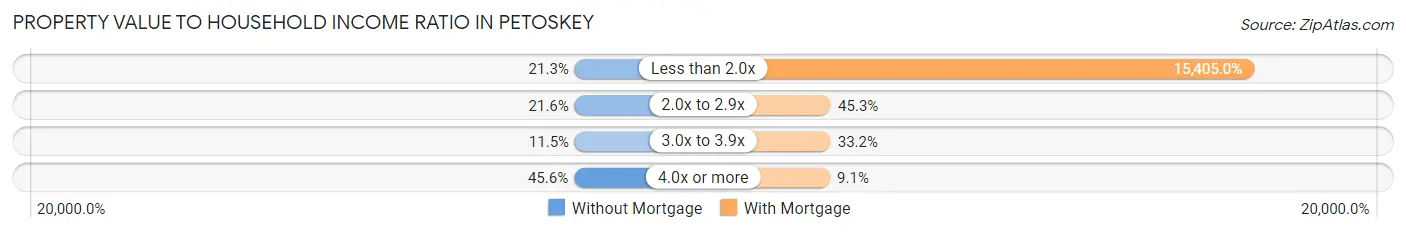
| Value-to-Income Ratio | Without Mortgage | With Mortgage |
| Less than 2.0x | 146 (21.3%) | 120,313 (15,405.0%) |
| 2.0x to 2.9x | 148 (21.6%) | 354 (45.3%) |
| 3.0x to 3.9x | 79 (11.5%) | 259 (33.2%) |
| 4.0x or more | 313 (45.6%) | 71 (9.1%) |
| Total | 686 (100.0%) | 781 (100.0%) |
Real Estate Taxes by Mortgage Status in Petoskey
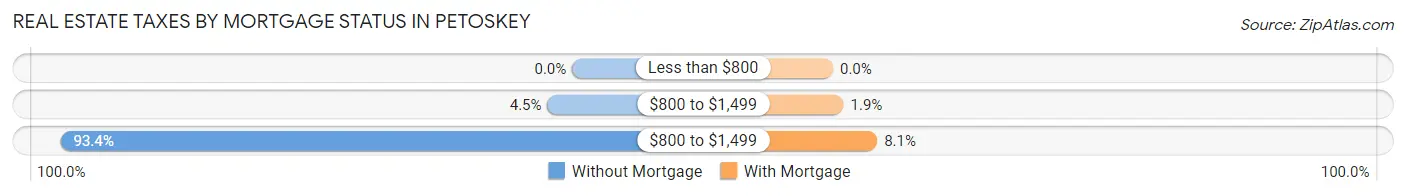
| Property Taxes | Without Mortgage | With Mortgage |
| Less than $800 | 0 (0.0%) | 0 (0.0%) |
| $800 to $1,499 | 31 (4.5%) | 15 (1.9%) |
| $800 to $1,499 | 641 (93.4%) | 63 (8.1%) |
| Total | 686 (100.0%) | 781 (100.0%) |
Health & Disability in Petoskey
Health Insurance Coverage by Age in Petoskey
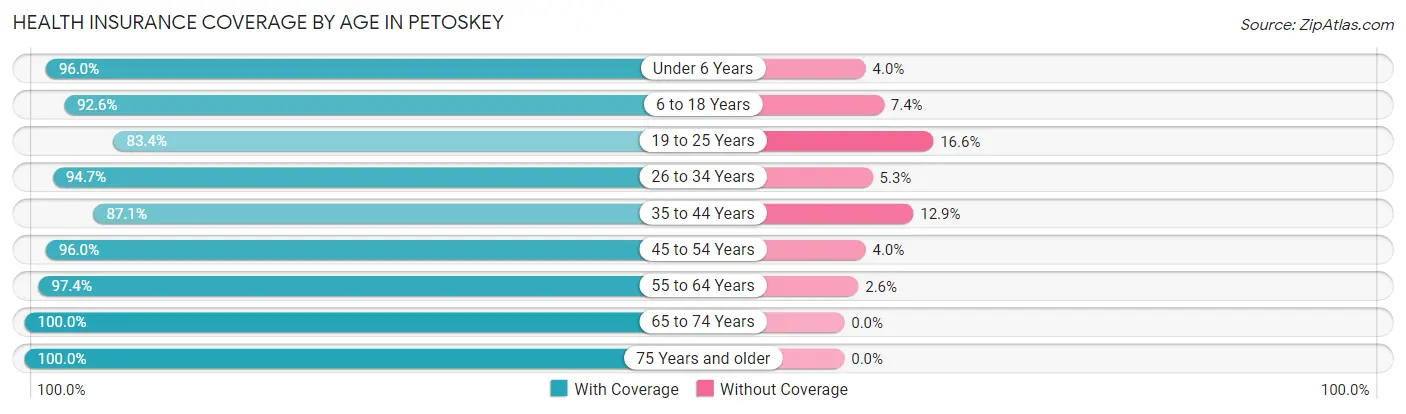
| Age Bracket | With Coverage | Without Coverage |
| Under 6 Years | 266 (96.0%) | 11 (4.0%) |
| 6 to 18 Years | 855 (92.6%) | 68 (7.4%) |
| 19 to 25 Years | 513 (83.4%) | 102 (16.6%) |
| 26 to 34 Years | 682 (94.7%) | 38 (5.3%) |
| 35 to 44 Years | 562 (87.1%) | 83 (12.9%) |
| 45 to 54 Years | 655 (96.0%) | 27 (4.0%) |
| 55 to 64 Years | 745 (97.4%) | 20 (2.6%) |
| 65 to 74 Years | 617 (100.0%) | 0 (0.0%) |
| 75 Years and older | 454 (100.0%) | 0 (0.0%) |
| Total | 5,349 (93.9%) | 349 (6.1%) |
Health Insurance Coverage by Citizenship Status in Petoskey
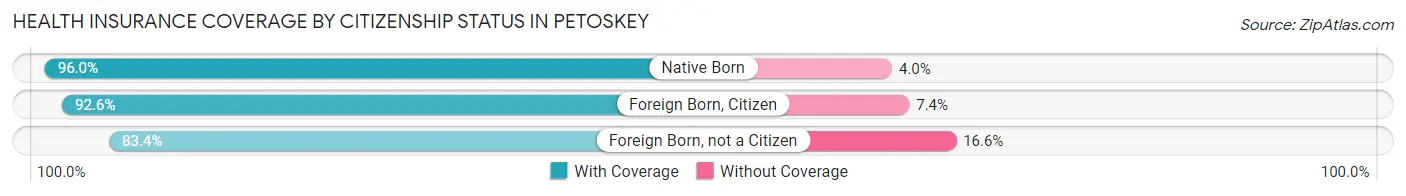
| Citizenship Status | With Coverage | Without Coverage |
| Native Born | 266 (96.0%) | 11 (4.0%) |
| Foreign Born, Citizen | 855 (92.6%) | 68 (7.4%) |
| Foreign Born, not a Citizen | 513 (83.4%) | 102 (16.6%) |
Health Insurance Coverage by Household Income in Petoskey
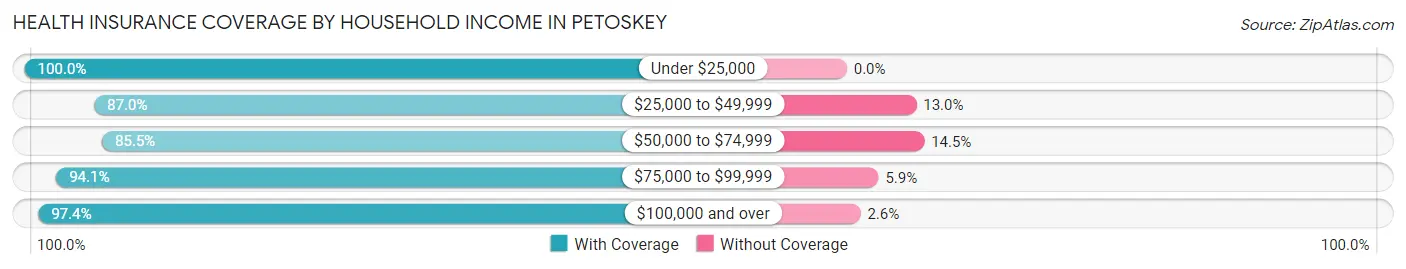
| Household Income | With Coverage | Without Coverage |
| Under $25,000 | 538 (100.0%) | 0 (0.0%) |
| $25,000 to $49,999 | 728 (87.0%) | 109 (13.0%) |
| $50,000 to $74,999 | 672 (85.5%) | 114 (14.5%) |
| $75,000 to $99,999 | 856 (94.1%) | 54 (5.9%) |
| $100,000 and over | 2,434 (97.4%) | 64 (2.6%) |
Public vs Private Health Insurance Coverage by Age in Petoskey
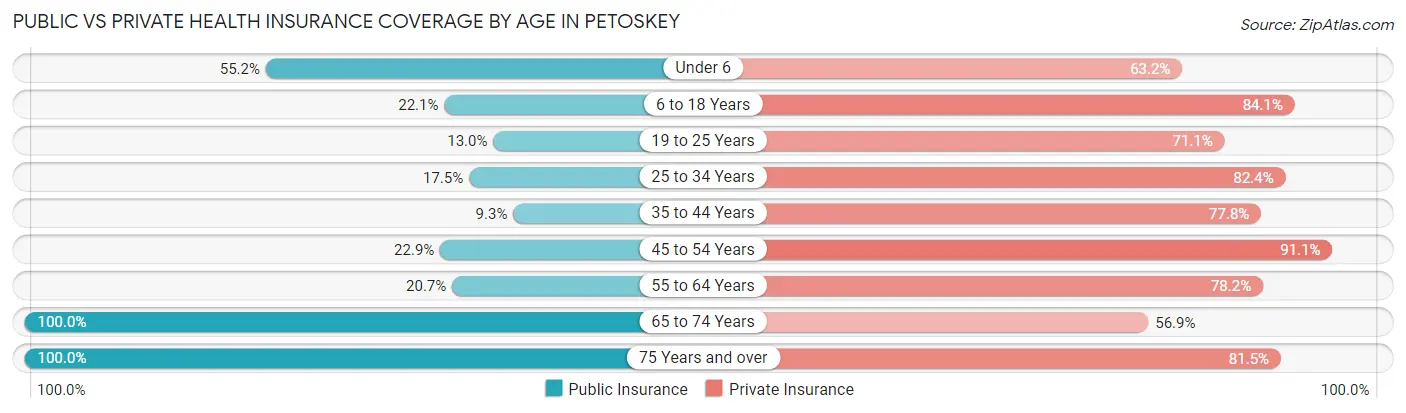
| Age Bracket | Public Insurance | Private Insurance |
| Under 6 | 153 (55.2%) | 175 (63.2%) |
| 6 to 18 Years | 204 (22.1%) | 776 (84.1%) |
| 19 to 25 Years | 80 (13.0%) | 437 (71.1%) |
| 25 to 34 Years | 126 (17.5%) | 593 (82.4%) |
| 35 to 44 Years | 60 (9.3%) | 502 (77.8%) |
| 45 to 54 Years | 156 (22.9%) | 621 (91.1%) |
| 55 to 64 Years | 158 (20.6%) | 598 (78.2%) |
| 65 to 74 Years | 617 (100.0%) | 351 (56.9%) |
| 75 Years and over | 454 (100.0%) | 370 (81.5%) |
| Total | 2,008 (35.2%) | 4,423 (77.6%) |
Disability Status by Sex by Age in Petoskey
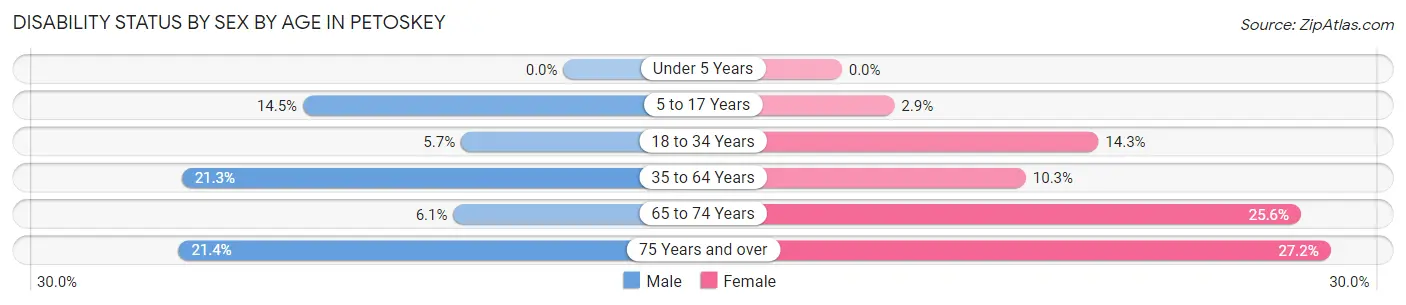
| Age Bracket | Male | Female |
| Under 5 Years | 0 (0.0%) | 0 (0.0%) |
| 5 to 17 Years | 69 (14.5%) | 11 (2.9%) |
| 18 to 34 Years | 47 (5.7%) | 89 (14.3%) |
| 35 to 64 Years | 177 (21.2%) | 129 (10.2%) |
| 65 to 74 Years | 16 (6.1%) | 91 (25.6%) |
| 75 Years and over | 39 (21.4%) | 74 (27.2%) |
Disability Class by Sex by Age in Petoskey
Disability Class: Hearing Difficulty
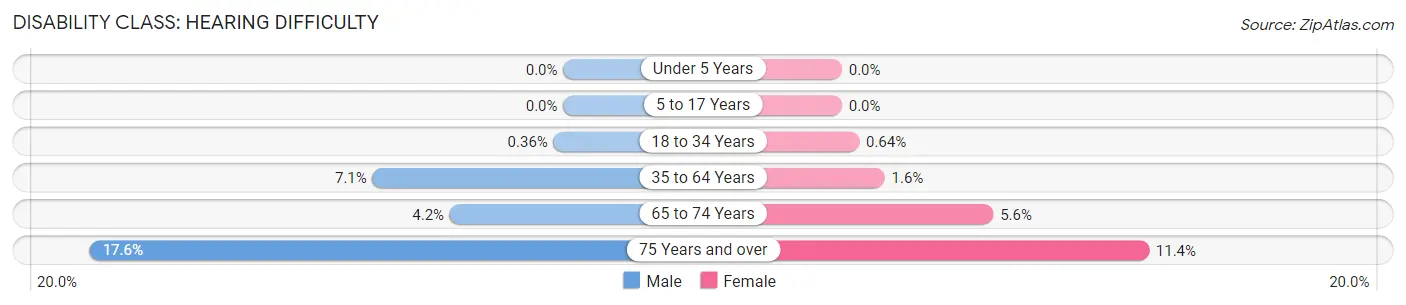
| Age Bracket | Male | Female |
| Under 5 Years | 0 (0.0%) | 0 (0.0%) |
| 5 to 17 Years | 0 (0.0%) | 0 (0.0%) |
| 18 to 34 Years | 3 (0.4%) | 4 (0.6%) |
| 35 to 64 Years | 59 (7.1%) | 20 (1.6%) |
| 65 to 74 Years | 11 (4.2%) | 20 (5.6%) |
| 75 Years and over | 32 (17.6%) | 31 (11.4%) |
Disability Class: Vision Difficulty
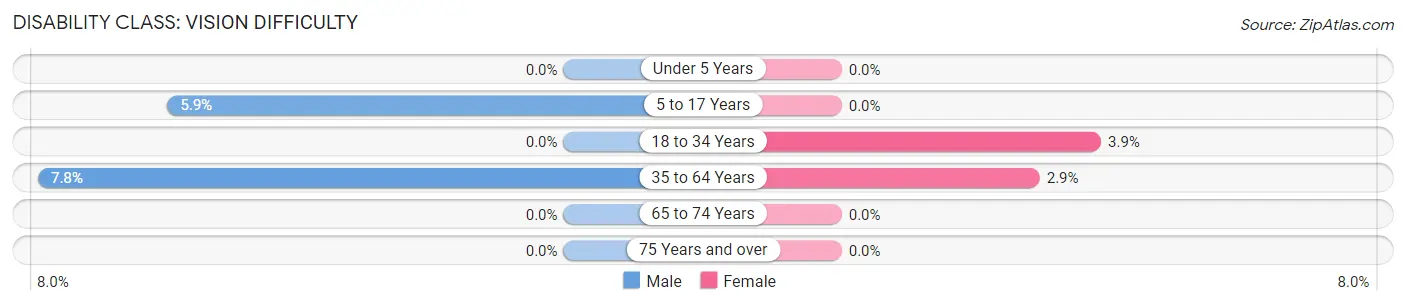
| Age Bracket | Male | Female |
| Under 5 Years | 0 (0.0%) | 0 (0.0%) |
| 5 to 17 Years | 28 (5.9%) | 0 (0.0%) |
| 18 to 34 Years | 0 (0.0%) | 24 (3.8%) |
| 35 to 64 Years | 65 (7.8%) | 37 (2.9%) |
| 65 to 74 Years | 0 (0.0%) | 0 (0.0%) |
| 75 Years and over | 0 (0.0%) | 0 (0.0%) |
Disability Class: Cognitive Difficulty
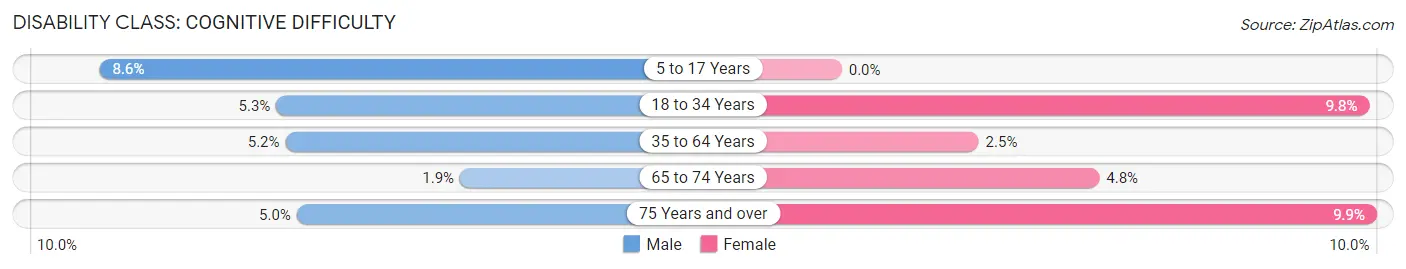
| Age Bracket | Male | Female |
| 5 to 17 Years | 41 (8.6%) | 0 (0.0%) |
| 18 to 34 Years | 44 (5.3%) | 61 (9.8%) |
| 35 to 64 Years | 43 (5.2%) | 32 (2.5%) |
| 65 to 74 Years | 5 (1.9%) | 17 (4.8%) |
| 75 Years and over | 9 (5.0%) | 27 (9.9%) |
Disability Class: Ambulatory Difficulty
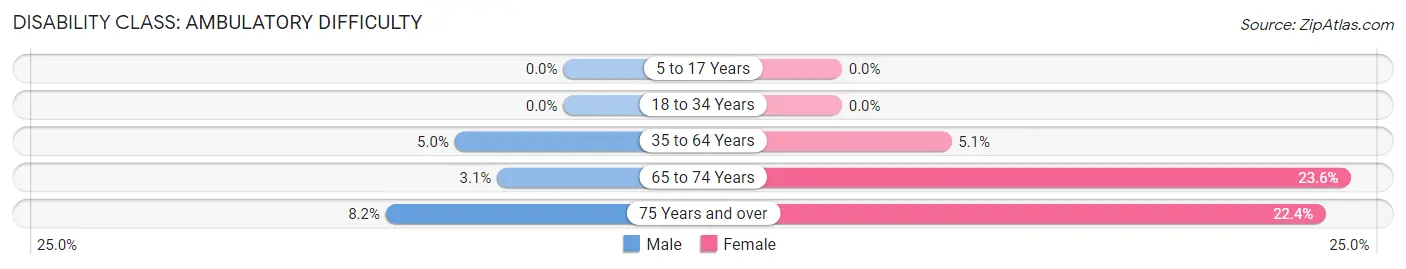
| Age Bracket | Male | Female |
| 5 to 17 Years | 0 (0.0%) | 0 (0.0%) |
| 18 to 34 Years | 0 (0.0%) | 0 (0.0%) |
| 35 to 64 Years | 42 (5.0%) | 64 (5.1%) |
| 65 to 74 Years | 8 (3.1%) | 84 (23.6%) |
| 75 Years and over | 15 (8.2%) | 61 (22.4%) |
Disability Class: Self-Care Difficulty
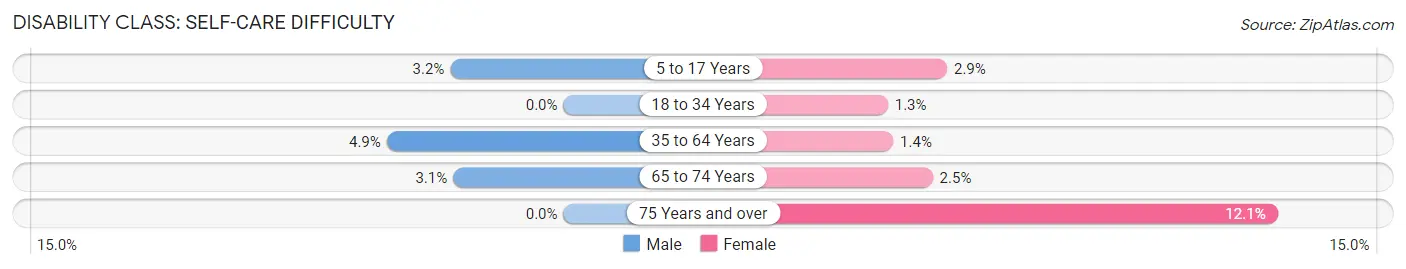
| Age Bracket | Male | Female |
| 5 to 17 Years | 15 (3.2%) | 11 (2.9%) |
| 18 to 34 Years | 0 (0.0%) | 8 (1.3%) |
| 35 to 64 Years | 41 (4.9%) | 18 (1.4%) |
| 65 to 74 Years | 8 (3.1%) | 9 (2.5%) |
| 75 Years and over | 0 (0.0%) | 33 (12.1%) |
Technology Access in Petoskey
Computing Device Access in Petoskey
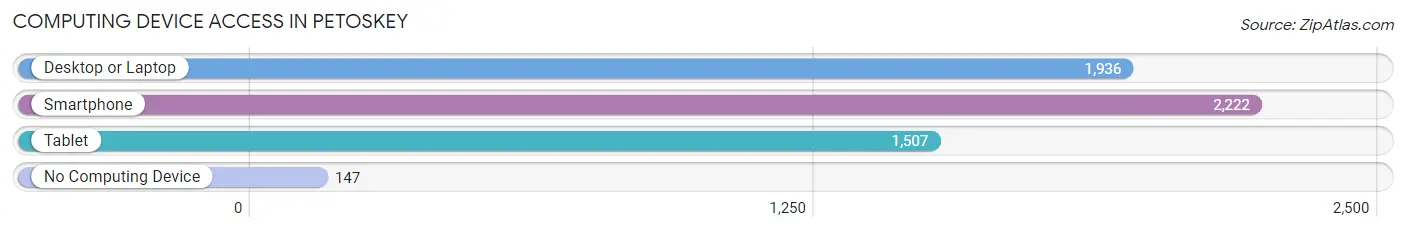
| Device Type | # Households | % Households |
| Desktop or Laptop | 1,936 | 75.0% |
| Smartphone | 2,222 | 86.0% |
| Tablet | 1,507 | 58.3% |
| No Computing Device | 147 | 5.7% |
| Total | 2,583 | 100.0% |
Internet Access in Petoskey
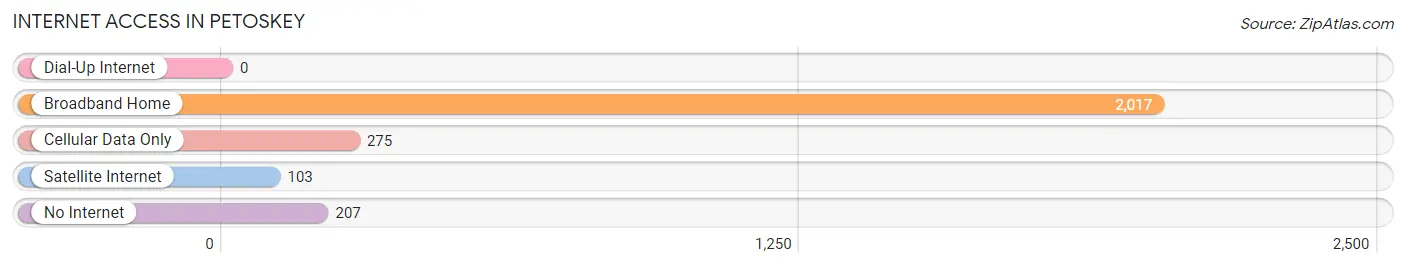
| Internet Type | # Households | % Households |
| Dial-Up Internet | 0 | 0.0% |
| Broadband Home | 2,017 | 78.1% |
| Cellular Data Only | 275 | 10.6% |
| Satellite Internet | 103 | 4.0% |
| No Internet | 207 | 8.0% |
| Total | 2,583 | 100.0% |
Petoskey Summary
Petoskey, Michigan is a city located in the northern part of the state, in Emmet County. It is situated on the shores of Little Traverse Bay, a part of Lake Michigan. The city is known for its Victorian-era architecture, its natural beauty, and its vibrant arts and culture scene.
History
The area that is now Petoskey was first inhabited by the Odawa people, who called it “Che-saw-ko-ming”, meaning “the place of the light of the morning”. The first European settlers arrived in the area in the early 1800s, and the city was officially founded in 1876. The city was named after Chief Petosega of the Odawa people.
In the late 19th century, Petoskey became a popular tourist destination, thanks to its natural beauty and its proximity to Lake Michigan. The city was home to several grand hotels, including the Grand Hotel, which was built in 1887 and is still in operation today.
Geography
Petoskey is located in the northern part of Michigan, in Emmet County. It is situated on the shores of Little Traverse Bay, a part of Lake Michigan. The city is surrounded by rolling hills and forests, and is home to several parks and nature preserves. The city is located about 30 miles from the Mackinac Bridge, which connects Michigan’s Upper and Lower Peninsulas.
The city has a total area of 8.2 square miles, of which 7.9 square miles is land and 0.3 square miles is water. The city has a humid continental climate, with cold winters and warm summers.
Economy
Petoskey’s economy is largely driven by tourism, thanks to its natural beauty and its proximity to Lake Michigan. The city is home to several resorts and hotels, as well as a variety of restaurants and shops. The city is also home to several manufacturing companies, including a paper mill and a furniture factory.
Demographics
As of the 2010 census, Petoskey had a population of 5,670. The racial makeup of the city was 94.2% White, 0.7% African American, 0.7% Native American, 0.7% Asian, 0.1% Pacific Islander, 1.3% from other races, and 2.3% from two or more races. Hispanic or Latino of any race were 3.2% of the population.
The median income for a household in the city was $41,944, and the median income for a family was $50,917. The per capita income for the city was $22,845. About 8.2% of families and 11.2% of the population were below the poverty line, including 16.2% of those under age 18 and 6.2% of those age 65 or over.
Petoskey is a vibrant city with a rich history, beautiful geography, and a diverse economy. The city is home to a variety of businesses, attractions, and cultural activities, making it a great place to live and visit.
Common Questions
What is Per Capita Income in Petoskey?
Per Capita income in Petoskey is $47,514.
What is the Median Family Income in Petoskey?
Median Family Income in Petoskey is $100,104.
What is the Median Household income in Petoskey?
Median Household Income in Petoskey is $69,784.
What is Income or Wage Gap in Petoskey?
Income or Wage Gap in Petoskey is 0.4%.
Women in Petoskey earn 99.6 cents for every dollar earned by a man.
What is Inequality or Gini Index in Petoskey?
Inequality or Gini Index in Petoskey is 0.50.
What is the Total Population of Petoskey?
Total Population of Petoskey is 5,859.
What is the Total Male Population of Petoskey?
Total Male Population of Petoskey is 2,775.
What is the Total Female Population of Petoskey?
Total Female Population of Petoskey is 3,084.
What is the Ratio of Males per 100 Females in Petoskey?
There are 89.98 Males per 100 Females in Petoskey.
What is the Ratio of Females per 100 Males in Petoskey?
There are 111.14 Females per 100 Males in Petoskey.
What is the Median Population Age in Petoskey?
Median Population Age in Petoskey is 41.0 Years.
What is the Average Family Size in Petoskey
Average Family Size in Petoskey is 2.9 People.
What is the Average Household Size in Petoskey
Average Household Size in Petoskey is 2.2 People.
How Large is the Labor Force in Petoskey?
There are 3,447 People in the Labor Forcein in Petoskey.
What is the Percentage of People in the Labor Force in Petoskey?
69.9% of People are in the Labor Force in Petoskey.
What is the Unemployment Rate in Petoskey?
Unemployment Rate in Petoskey is 1.2%.