Frankenmuth, MI Map & Demographics
Frankenmuth Map
Frankenmuth Overview
$49,056
PER CAPITA INCOME
$121,005
AVG FAMILY INCOME
$80,956
AVG HOUSEHOLD INCOME
60.7%
WAGE / INCOME GAP [ % ]
39.3¢/ $1
WAGE / INCOME GAP [ $ ]
0.43
INEQUALITY / GINI INDEX
5,064
TOTAL POPULATION
2,339
MALE POPULATION
2,725
FEMALE POPULATION
85.83
MALES / 100 FEMALES
116.50
FEMALES / 100 MALES
49.4
MEDIAN AGE
2.9
AVG FAMILY SIZE
2.0
AVG HOUSEHOLD SIZE
2,463
LABOR FORCE [ PEOPLE ]
58.4%
PERCENT IN LABOR FORCE
5.7%
UNEMPLOYMENT RATE
Frankenmuth Zip Codes
Frankenmuth Area Codes
Income in Frankenmuth
Income Overview in Frankenmuth
Per Capita Income in Frankenmuth is $49,056, while median incomes of families and households are $121,005 and $80,956 respectively.
| Characteristic | Number | Measure |
| Per Capita Income | 5,064 | $49,056 |
| Median Family Income | 1,227 | $121,005 |
| Mean Family Income | 1,227 | $144,693 |
| Median Household Income | 2,374 | $80,956 |
| Mean Household Income | 2,374 | $104,952 |
| Income Deficit | 1,227 | $0 |
| Wage / Income Gap (%) | 5,064 | 60.71% |
| Wage / Income Gap ($) | 5,064 | 39.29¢ per $1 |
| Gini / Inequality Index | 5,064 | 0.43 |
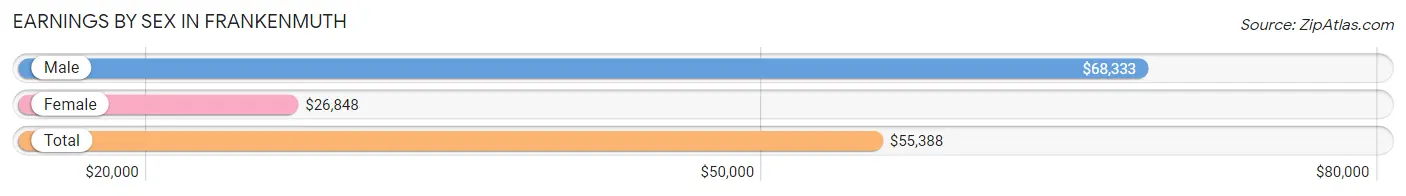
Earnings by Sex in Frankenmuth
Average Earnings in Frankenmuth are $55,388, $68,333 for men and $26,848 for women, a difference of 60.7%.
| Sex | Number | Average Earnings |
| Male | 1,374 (55.7%) | $68,333 |
| Female | 1,093 (44.3%) | $26,848 |
| Total | 2,467 (100.0%) | $55,388 |
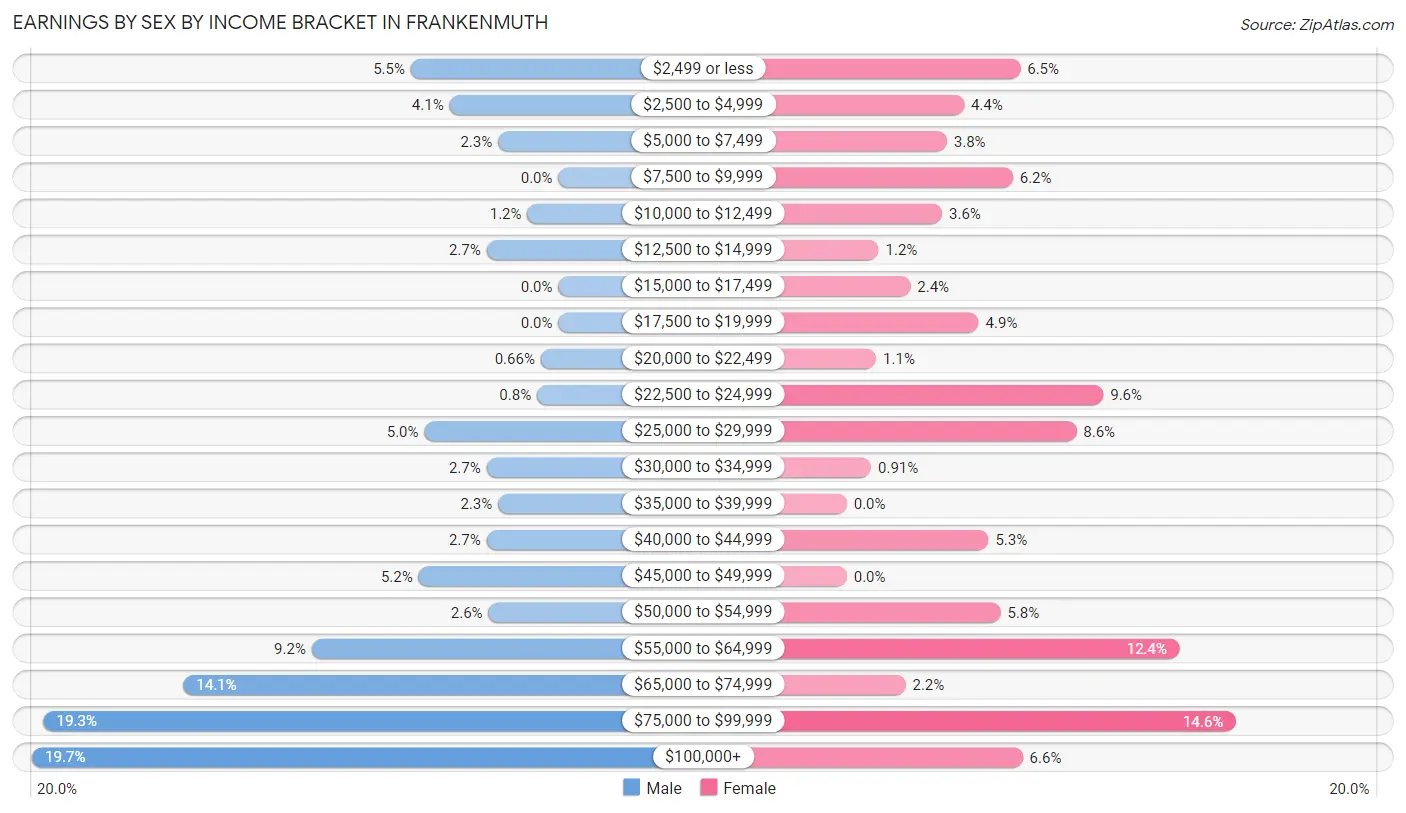
Earnings by Sex by Income Bracket in Frankenmuth
The most common earnings brackets in Frankenmuth are $100,000+ for men (271 | 19.7%) and $75,000 to $99,999 for women (159 | 14.5%).
| Income | Male | Female |
| $2,499 or less | 76 (5.5%) | 71 (6.5%) |
| $2,500 to $4,999 | 56 (4.1%) | 48 (4.4%) |
| $5,000 to $7,499 | 31 (2.3%) | 41 (3.7%) |
| $7,500 to $9,999 | 0 (0.0%) | 68 (6.2%) |
| $10,000 to $12,499 | 16 (1.2%) | 39 (3.6%) |
| $12,500 to $14,999 | 37 (2.7%) | 13 (1.2%) |
| $15,000 to $17,499 | 0 (0.0%) | 26 (2.4%) |
| $17,500 to $19,999 | 0 (0.0%) | 54 (4.9%) |
| $20,000 to $22,499 | 9 (0.7%) | 12 (1.1%) |
| $22,500 to $24,999 | 11 (0.8%) | 105 (9.6%) |
| $25,000 to $29,999 | 69 (5.0%) | 94 (8.6%) |
| $30,000 to $34,999 | 37 (2.7%) | 10 (0.9%) |
| $35,000 to $39,999 | 31 (2.3%) | 0 (0.0%) |
| $40,000 to $44,999 | 37 (2.7%) | 58 (5.3%) |
| $45,000 to $49,999 | 72 (5.2%) | 0 (0.0%) |
| $50,000 to $54,999 | 36 (2.6%) | 63 (5.8%) |
| $55,000 to $64,999 | 127 (9.2%) | 136 (12.4%) |
| $65,000 to $74,999 | 193 (14.1%) | 24 (2.2%) |
| $75,000 to $99,999 | 265 (19.3%) | 159 (14.5%) |
| $100,000+ | 271 (19.7%) | 72 (6.6%) |
| Total | 1,374 (100.0%) | 1,093 (100.0%) |
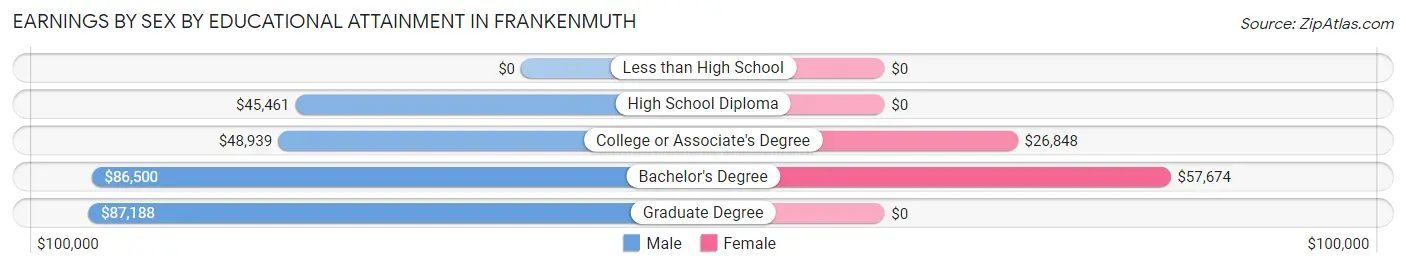
Earnings by Sex by Educational Attainment in Frankenmuth
Average earnings in Frankenmuth are $69,405 for men and $51,214 for women, a difference of 26.2%. Men with an educational attainment of graduate degree enjoy the highest average annual earnings of $87,188, while those with high school diploma education earn the least with $45,461. Women with an educational attainment of bachelor's degree earn the most with the average annual earnings of $57,674, while those with college or associate's degree education have the smallest earnings of $26,848.
| Educational Attainment | Male Income | Female Income |
| Less than High School | - | - |
| High School Diploma | $45,461 | $0 |
| College or Associate's Degree | $48,939 | $26,848 |
| Bachelor's Degree | $86,500 | $57,674 |
| Graduate Degree | $87,188 | $0 |
| Total | $69,405 | $51,214 |
Family Income in Frankenmuth
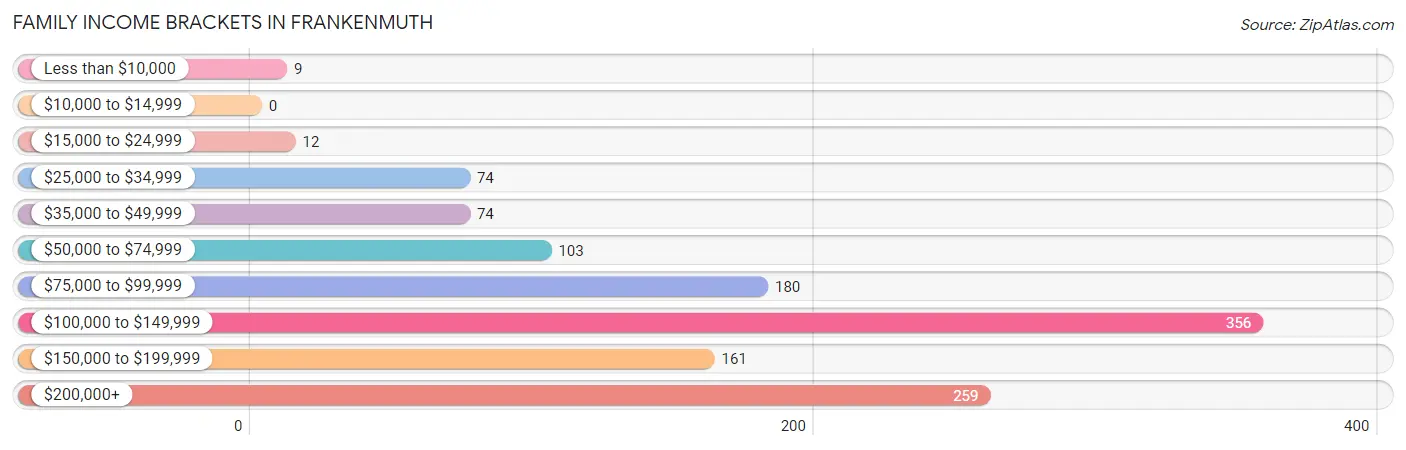
Family Income Brackets in Frankenmuth
According to the Frankenmuth family income data, there are 356 families falling into the $100,000 to $149,999 income range, which is the most common income bracket and makes up 29.0% of all families.
| Income Bracket | # Families | % Families |
| Less than $10,000 | 9 | 0.7% |
| $10,000 to $14,999 | 0 | 0.0% |
| $15,000 to $24,999 | 12 | 1.0% |
| $25,000 to $34,999 | 74 | 6.0% |
| $35,000 to $49,999 | 74 | 6.0% |
| $50,000 to $74,999 | 103 | 8.4% |
| $75,000 to $99,999 | 180 | 14.7% |
| $100,000 to $149,999 | 356 | 29.0% |
| $150,000 to $199,999 | 161 | 13.1% |
| $200,000+ | 259 | 21.1% |
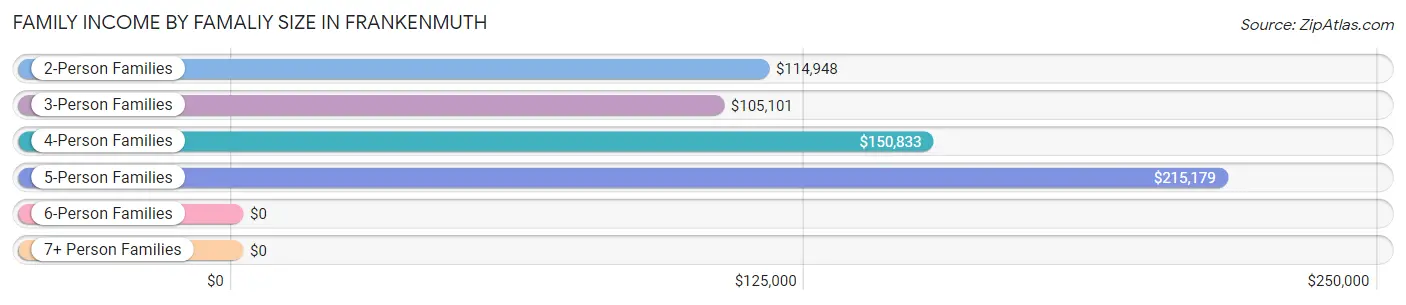
Family Income by Famaliy Size in Frankenmuth
5-person families (33 | 2.7%) account for the highest median family income in Frankenmuth with $215,179 per family, while 2-person families (537 | 43.8%) have the highest median income of $57,474 per family member.
| Income Bracket | # Families | Median Income |
| 2-Person Families | 537 (43.8%) | $114,948 |
| 3-Person Families | 331 (27.0%) | $105,101 |
| 4-Person Families | 280 (22.8%) | $150,833 |
| 5-Person Families | 33 (2.7%) | $215,179 |
| 6-Person Families | 46 (3.7%) | $0 |
| 7+ Person Families | 0 (0.0%) | $0 |
| Total | 1,227 (100.0%) | $121,005 |
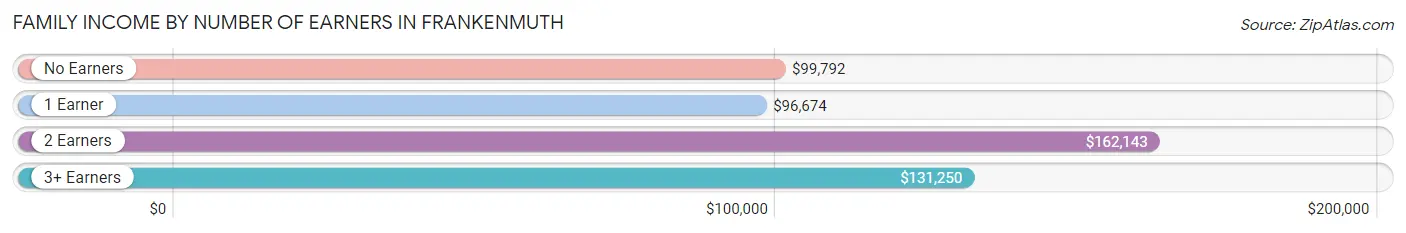
Family Income by Number of Earners in Frankenmuth
The median family income in Frankenmuth is $121,005, with families comprising 2 earners (406) having the highest median family income of $162,143, while families with 1 earner (349) have the lowest median family income of $96,674, accounting for 33.1% and 28.4% of families, respectively.
| Number of Earners | # Families | Median Income |
| No Earners | 262 (21.3%) | $99,792 |
| 1 Earner | 349 (28.4%) | $96,674 |
| 2 Earners | 406 (33.1%) | $162,143 |
| 3+ Earners | 210 (17.1%) | $131,250 |
| Total | 1,227 (100.0%) | $121,005 |
Household Income in Frankenmuth
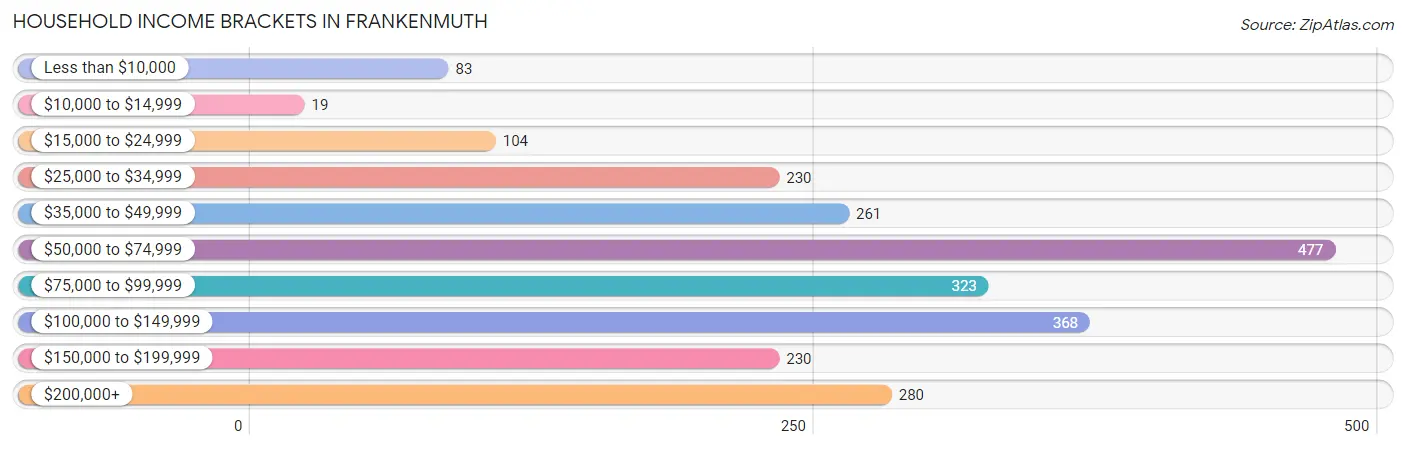
Household Income Brackets in Frankenmuth
With 477 households falling in the category, the $50,000 to $74,999 income range is the most frequent in Frankenmuth, accounting for 20.1% of all households. In contrast, only 19 households (0.8%) fall into the $10,000 to $14,999 income bracket, making it the least populous group.
| Income Bracket | # Households | % Households |
| Less than $10,000 | 83 | 3.5% |
| $10,000 to $14,999 | 19 | 0.8% |
| $15,000 to $24,999 | 104 | 4.4% |
| $25,000 to $34,999 | 230 | 9.7% |
| $35,000 to $49,999 | 261 | 11.0% |
| $50,000 to $74,999 | 477 | 20.1% |
| $75,000 to $99,999 | 323 | 13.6% |
| $100,000 to $149,999 | 368 | 15.5% |
| $150,000 to $199,999 | 230 | 9.7% |
| $200,000+ | 280 | 11.8% |
Household Income by Householder Age in Frankenmuth
The median household income in Frankenmuth is $80,956, with the highest median household income of $97,462 found in the 45 to 64 years age bracket for the primary householder. A total of 741 households (31.2%) fall into this category. Meanwhile, the 15 to 24 years age bracket for the primary householder has the lowest median household income of $0, with 133 households (5.6%) in this group.
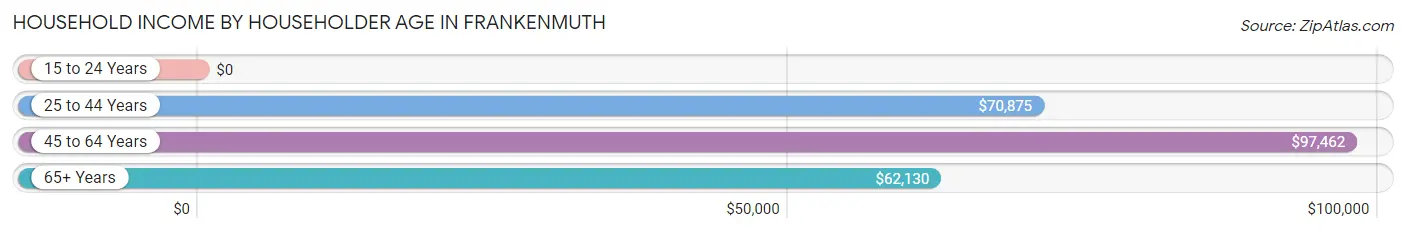
| Income Bracket | # Households | Median Income |
| 15 to 24 Years | 133 (5.6%) | $0 |
| 25 to 44 Years | 576 (24.3%) | $70,875 |
| 45 to 64 Years | 741 (31.2%) | $97,462 |
| 65+ Years | 924 (38.9%) | $62,130 |
| Total | 2,374 (100.0%) | $80,956 |
Poverty in Frankenmuth
Income Below Poverty by Sex and Age in Frankenmuth
With 1.9% poverty level for males and 4.4% for females among the residents of Frankenmuth, 15 year old males and 18 to 24 year old females are the most vulnerable to poverty, with 16 males (40.0%) and 36 females (20.4%) in their respective age groups living below the poverty level.
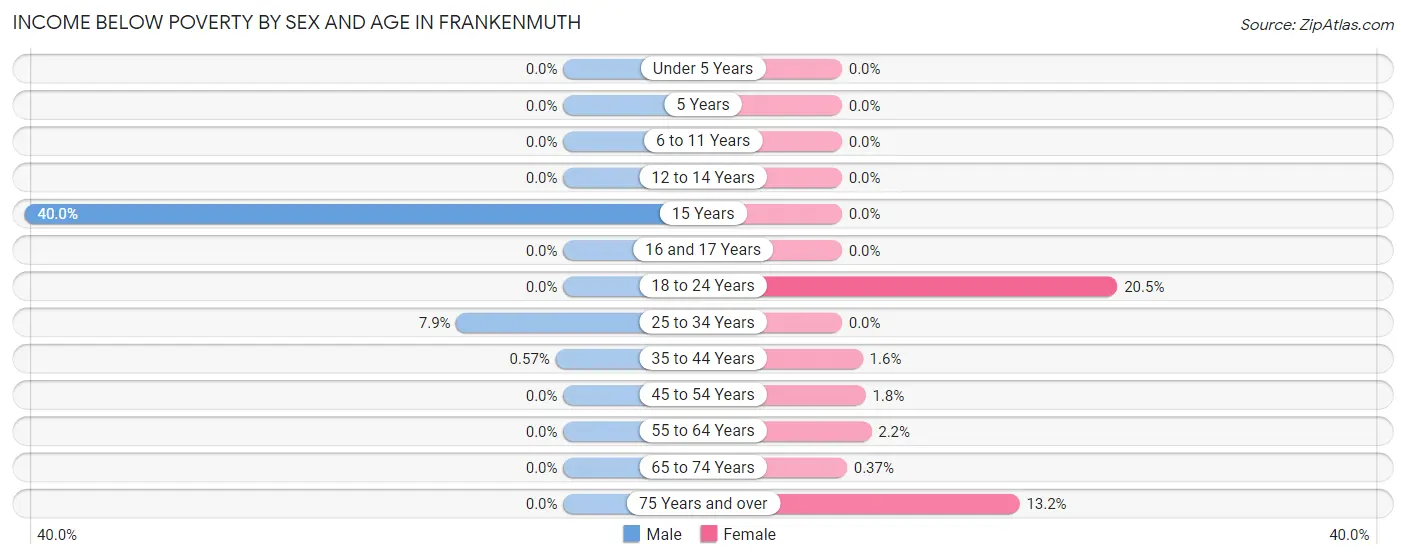
| Age Bracket | Male | Female |
| Under 5 Years | 0 (0.0%) | 0 (0.0%) |
| 5 Years | 0 (0.0%) | 0 (0.0%) |
| 6 to 11 Years | 0 (0.0%) | 0 (0.0%) |
| 12 to 14 Years | 0 (0.0%) | 0 (0.0%) |
| 15 Years | 16 (40.0%) | 0 (0.0%) |
| 16 and 17 Years | 0 (0.0%) | 0 (0.0%) |
| 18 to 24 Years | 0 (0.0%) | 36 (20.4%) |
| 25 to 34 Years | 27 (7.9%) | 0 (0.0%) |
| 35 to 44 Years | 1 (0.6%) | 3 (1.5%) |
| 45 to 54 Years | 0 (0.0%) | 5 (1.8%) |
| 55 to 64 Years | 0 (0.0%) | 8 (2.2%) |
| 65 to 74 Years | 0 (0.0%) | 1 (0.4%) |
| 75 Years and over | 0 (0.0%) | 60 (13.2%) |
| Total | 44 (1.9%) | 113 (4.4%) |
Income Above Poverty by Sex and Age in Frankenmuth
According to the poverty statistics in Frankenmuth, males aged under 5 years and females aged under 5 years are the age groups that are most secure financially, with 100.0% of males and 100.0% of females in these age groups living above the poverty line.
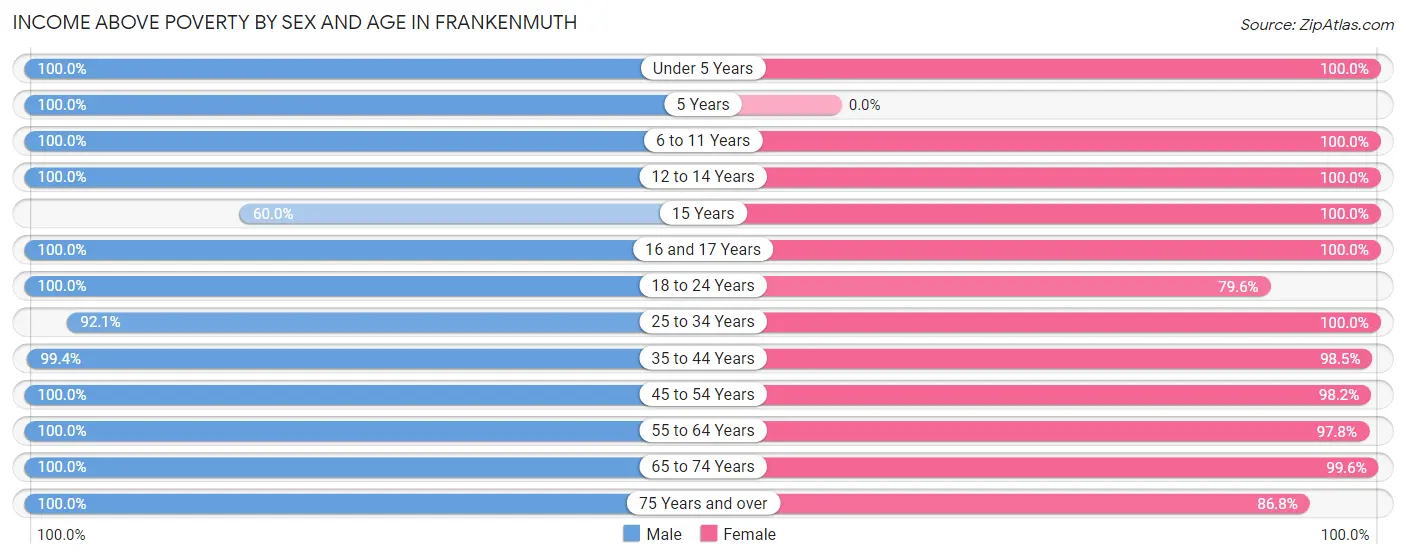
| Age Bracket | Male | Female |
| Under 5 Years | 167 (100.0%) | 135 (100.0%) |
| 5 Years | 30 (100.0%) | 0 (0.0%) |
| 6 to 11 Years | 116 (100.0%) | 84 (100.0%) |
| 12 to 14 Years | 45 (100.0%) | 178 (100.0%) |
| 15 Years | 24 (60.0%) | 52 (100.0%) |
| 16 and 17 Years | 18 (100.0%) | 64 (100.0%) |
| 18 to 24 Years | 190 (100.0%) | 140 (79.5%) |
| 25 to 34 Years | 313 (92.1%) | 287 (100.0%) |
| 35 to 44 Years | 174 (99.4%) | 190 (98.5%) |
| 45 to 54 Years | 360 (100.0%) | 279 (98.2%) |
| 55 to 64 Years | 295 (100.0%) | 358 (97.8%) |
| 65 to 74 Years | 282 (100.0%) | 268 (99.6%) |
| 75 Years and over | 256 (100.0%) | 395 (86.8%) |
| Total | 2,270 (98.1%) | 2,430 (95.6%) |
Income Below Poverty Among Married-Couple Families in Frankenmuth
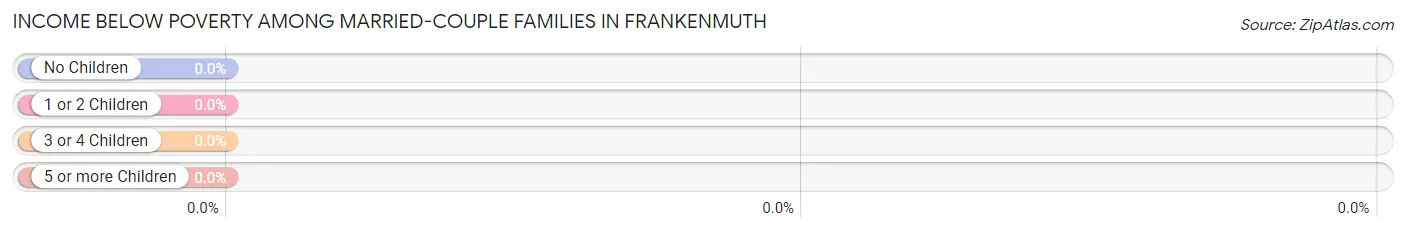
| Children | Above Poverty | Below Poverty |
| No Children | 672 (100.0%) | 0 (0.0%) |
| 1 or 2 Children | 368 (100.0%) | 0 (0.0%) |
| 3 or 4 Children | 69 (100.0%) | 0 (0.0%) |
| 5 or more Children | 0 (0.0%) | 0 (0.0%) |
| Total | 1,109 (100.0%) | 0 (0.0%) |
Income Below Poverty Among Single-Parent Households in Frankenmuth
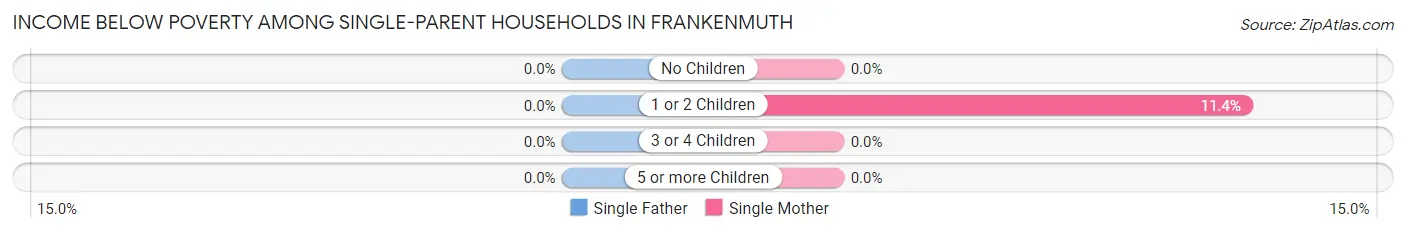
| Children | Single Father | Single Mother |
| No Children | 0 (0.0%) | 0 (0.0%) |
| 1 or 2 Children | 0 (0.0%) | 8 (11.4%) |
| 3 or 4 Children | 0 (0.0%) | 0 (0.0%) |
| 5 or more Children | 0 (0.0%) | 0 (0.0%) |
| Total | 0 (0.0%) | 8 (7.0%) |
Income Below Poverty Among Married-Couple vs Single-Parent Households in Frankenmuth
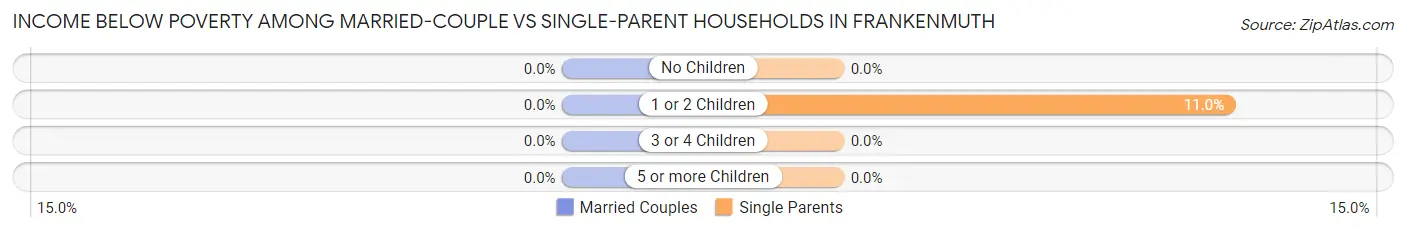
| Children | Married-Couple Families | Single-Parent Households |
| No Children | 0 (0.0%) | 0 (0.0%) |
| 1 or 2 Children | 0 (0.0%) | 8 (11.0%) |
| 3 or 4 Children | 0 (0.0%) | 0 (0.0%) |
| 5 or more Children | 0 (0.0%) | 0 (0.0%) |
| Total | 0 (0.0%) | 8 (6.8%) |
Race in Frankenmuth
The most populous races in Frankenmuth are White / Caucasian (4,609 | 91.0%), Hispanic or Latino (331 | 6.5%), and Black / African American (214 | 4.2%).
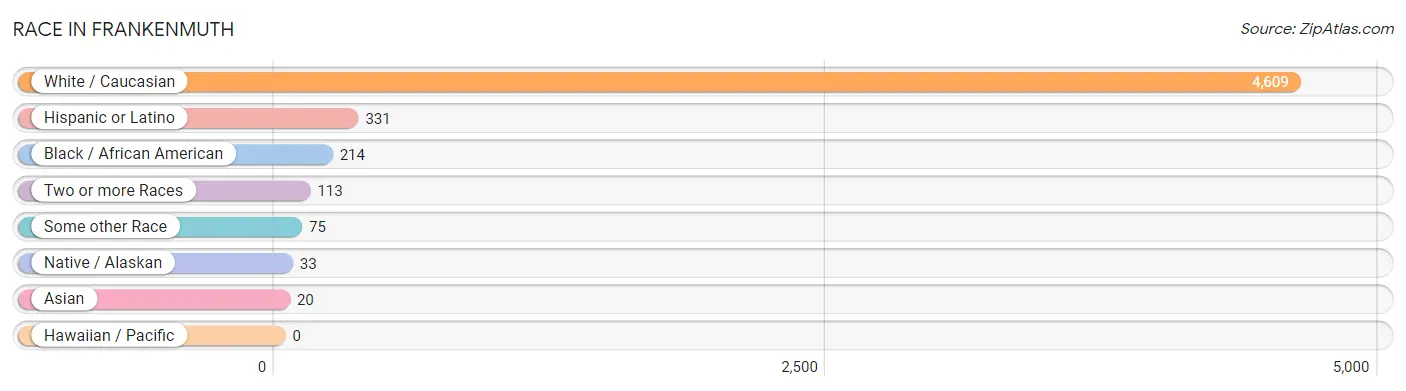
| Race | # Population | % Population |
| Asian | 20 | 0.4% |
| Black / African American | 214 | 4.2% |
| Hawaiian / Pacific | 0 | 0.0% |
| Hispanic or Latino | 331 | 6.5% |
| Native / Alaskan | 33 | 0.6% |
| White / Caucasian | 4,609 | 91.0% |
| Two or more Races | 113 | 2.2% |
| Some other Race | 75 | 1.5% |
| Total | 5,064 | 100.0% |
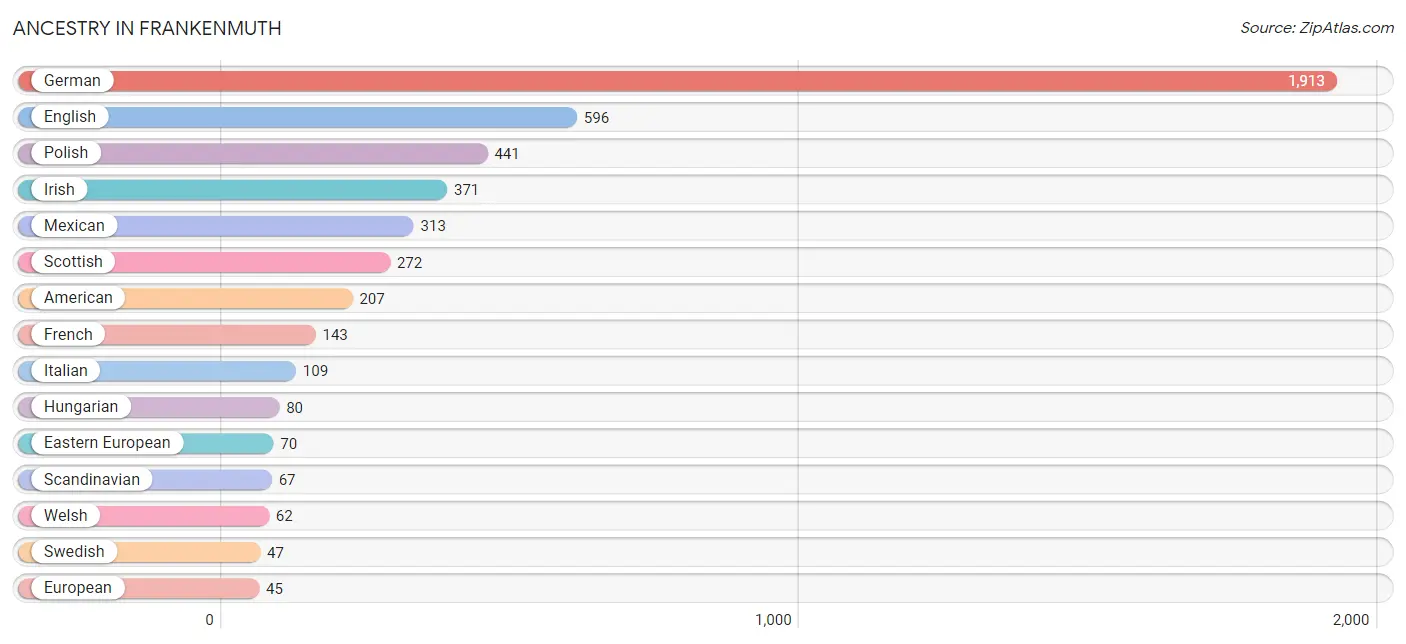
Ancestry in Frankenmuth
The most populous ancestries reported in Frankenmuth are German (1,913 | 37.8%), English (596 | 11.8%), Polish (441 | 8.7%), Irish (371 | 7.3%), and Mexican (313 | 6.2%), together accounting for 71.8% of all Frankenmuth residents.
| Ancestry | # Population | % Population |
| African | 21 | 0.4% |
| American | 207 | 4.1% |
| Arab | 18 | 0.4% |
| Austrian | 17 | 0.3% |
| Belgian | 12 | 0.2% |
| British | 16 | 0.3% |
| Central American | 18 | 0.4% |
| Central American Indian | 18 | 0.4% |
| Chippewa | 32 | 0.6% |
| Danish | 19 | 0.4% |
| Dutch | 29 | 0.6% |
| Eastern European | 70 | 1.4% |
| English | 596 | 11.8% |
| European | 45 | 0.9% |
| French | 143 | 2.8% |
| French Canadian | 27 | 0.5% |
| German | 1,913 | 37.8% |
| Greek | 32 | 0.6% |
| Guatemalan | 18 | 0.4% |
| Hungarian | 80 | 1.6% |
| Irish | 371 | 7.3% |
| Italian | 109 | 2.1% |
| Lebanese | 18 | 0.4% |
| Mexican | 313 | 6.2% |
| Northern European | 19 | 0.4% |
| Norwegian | 27 | 0.5% |
| Polish | 441 | 8.7% |
| Russian | 19 | 0.4% |
| Scandinavian | 67 | 1.3% |
| Scottish | 272 | 5.4% |
| Slovene | 17 | 0.3% |
| Subsaharan African | 21 | 0.4% |
| Swedish | 47 | 0.9% |
| Swiss | 17 | 0.3% |
| Thai | 20 | 0.4% |
| Ukrainian | 15 | 0.3% |
| Welsh | 62 | 1.2% | View All 37 Rows |
Immigrants in Frankenmuth
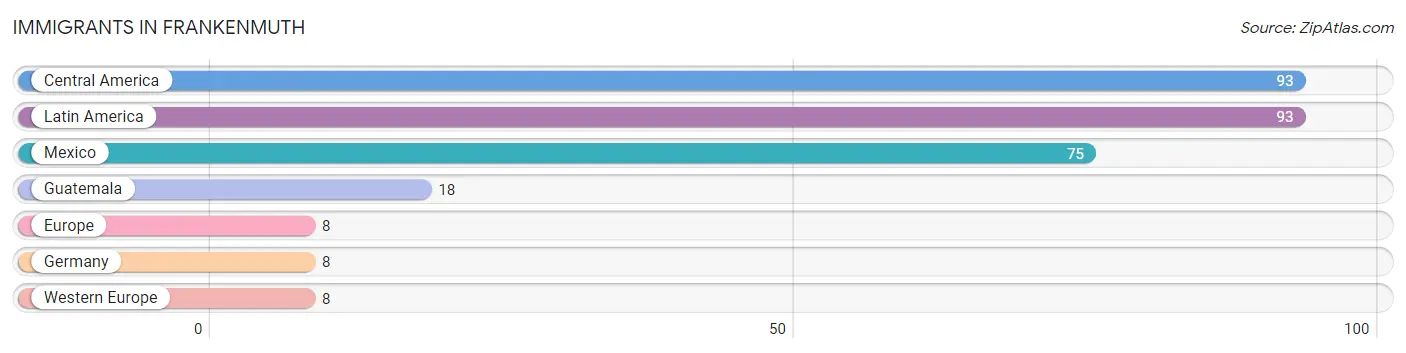
The most numerous immigrant groups reported in Frankenmuth came from Central America (93 | 1.8%), Latin America (93 | 1.8%), Mexico (75 | 1.5%), Guatemala (18 | 0.4%), and Europe (8 | 0.2%), together accounting for 5.7% of all Frankenmuth residents.
| Immigration Origin | # Population | % Population |
| Central America | 93 | 1.8% |
| Europe | 8 | 0.2% |
| Germany | 8 | 0.2% |
| Guatemala | 18 | 0.4% |
| Latin America | 93 | 1.8% |
| Mexico | 75 | 1.5% |
| Western Europe | 8 | 0.2% | View All 7 Rows |
Sex and Age in Frankenmuth
Sex and Age in Frankenmuth
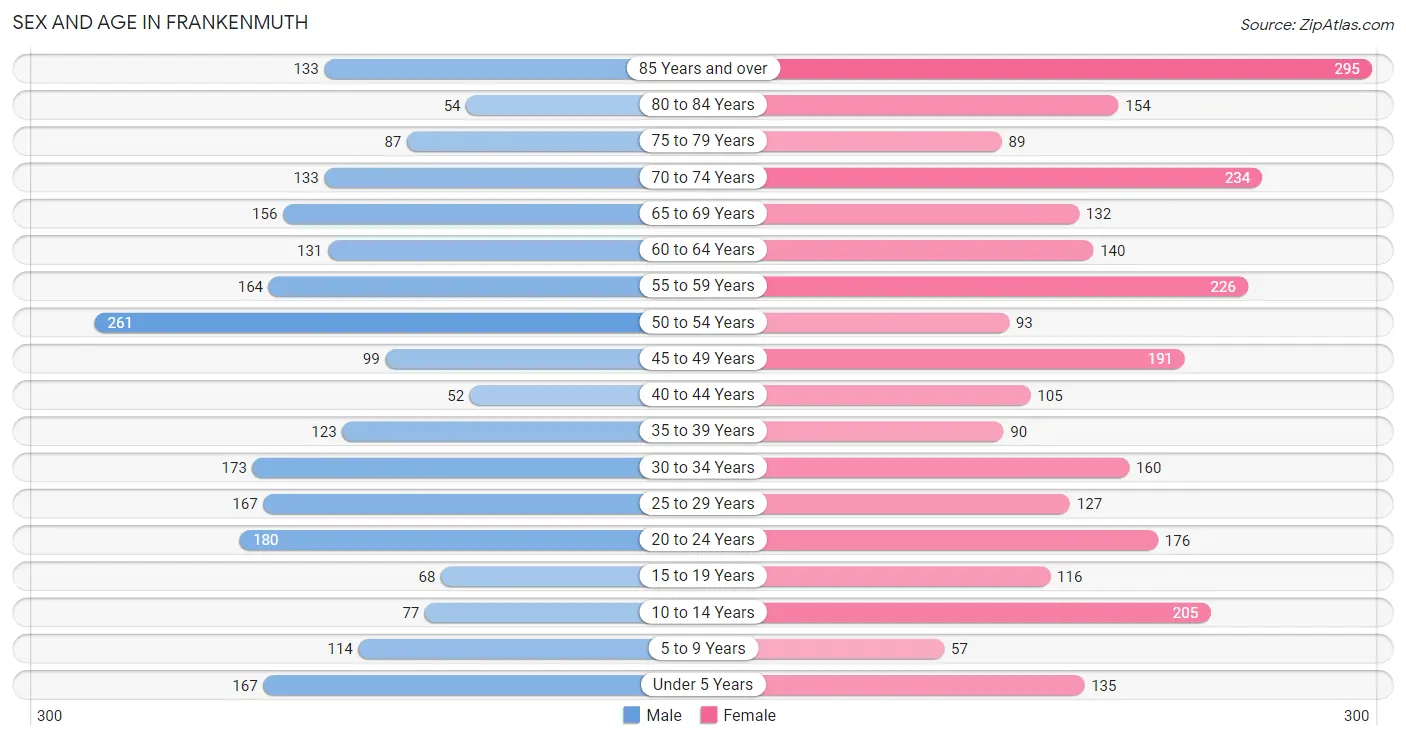
The most populous age groups in Frankenmuth are 50 to 54 Years (261 | 11.2%) for men and 85 Years and over (295 | 10.8%) for women.
| Age Bracket | Male | Female |
| Under 5 Years | 167 (7.1%) | 135 (5.0%) |
| 5 to 9 Years | 114 (4.9%) | 57 (2.1%) |
| 10 to 14 Years | 77 (3.3%) | 205 (7.5%) |
| 15 to 19 Years | 68 (2.9%) | 116 (4.3%) |
| 20 to 24 Years | 180 (7.7%) | 176 (6.5%) |
| 25 to 29 Years | 167 (7.1%) | 127 (4.7%) |
| 30 to 34 Years | 173 (7.4%) | 160 (5.9%) |
| 35 to 39 Years | 123 (5.3%) | 90 (3.3%) |
| 40 to 44 Years | 52 (2.2%) | 105 (3.8%) |
| 45 to 49 Years | 99 (4.2%) | 191 (7.0%) |
| 50 to 54 Years | 261 (11.2%) | 93 (3.4%) |
| 55 to 59 Years | 164 (7.0%) | 226 (8.3%) |
| 60 to 64 Years | 131 (5.6%) | 140 (5.1%) |
| 65 to 69 Years | 156 (6.7%) | 132 (4.8%) |
| 70 to 74 Years | 133 (5.7%) | 234 (8.6%) |
| 75 to 79 Years | 87 (3.7%) | 89 (3.3%) |
| 80 to 84 Years | 54 (2.3%) | 154 (5.7%) |
| 85 Years and over | 133 (5.7%) | 295 (10.8%) |
| Total | 2,339 (100.0%) | 2,725 (100.0%) |
Families and Households in Frankenmuth
Median Family Size in Frankenmuth
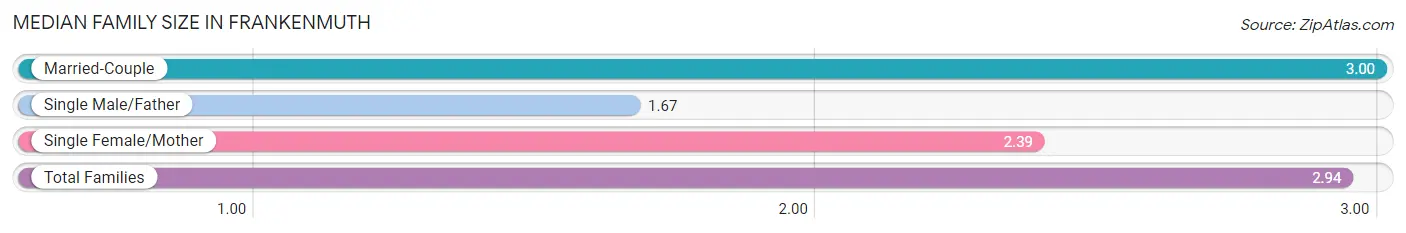
The median family size in Frankenmuth is 2.94 persons per family, with married-couple families (1,109 | 90.4%) accounting for the largest median family size of 3 persons per family. On the other hand, single male/father families (3 | 0.2%) represent the smallest median family size with 1.67 persons per family.
| Family Type | # Families | Family Size |
| Married-Couple | 1,109 (90.4%) | 3.00 |
| Single Male/Father | 3 (0.2%) | 1.67 |
| Single Female/Mother | 115 (9.4%) | 2.39 |
| Total Families | 1,227 (100.0%) | 2.94 |
Median Household Size in Frankenmuth
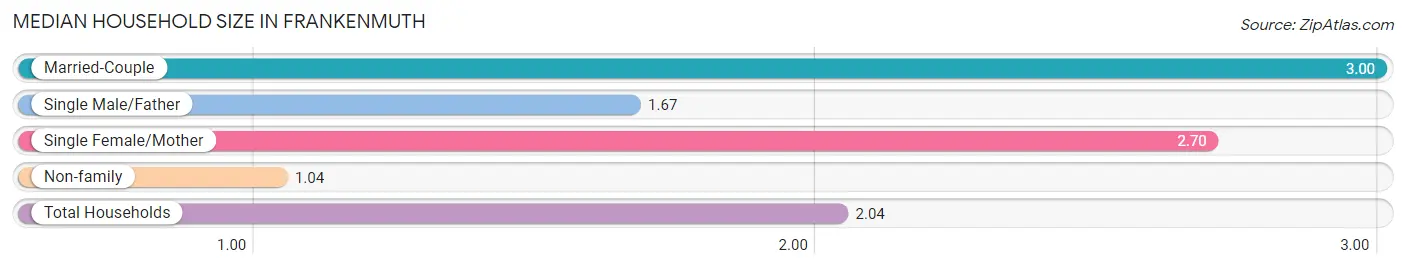
The median household size in Frankenmuth is 2.04 persons per household, with married-couple households (1,109 | 46.7%) accounting for the largest median household size of 3 persons per household. non-family households (1,147 | 48.3%) represent the smallest median household size with 1.04 persons per household.
| Household Type | # Households | Household Size |
| Married-Couple | 1,109 (46.7%) | 3.00 |
| Single Male/Father | 3 (0.1%) | 1.67 |
| Single Female/Mother | 115 (4.8%) | 2.70 |
| Non-family | 1,147 (48.3%) | 1.04 |
| Total Households | 2,374 (100.0%) | 2.04 |
Household Size by Marriage Status in Frankenmuth
Out of a total of 2,374 households in Frankenmuth, 1,227 (51.7%) are family households, while 1,147 (48.3%) are nonfamily households. The most numerous type of family households are 2-person households, comprising 522, and the most common type of nonfamily households are 1-person households, comprising 1,094.
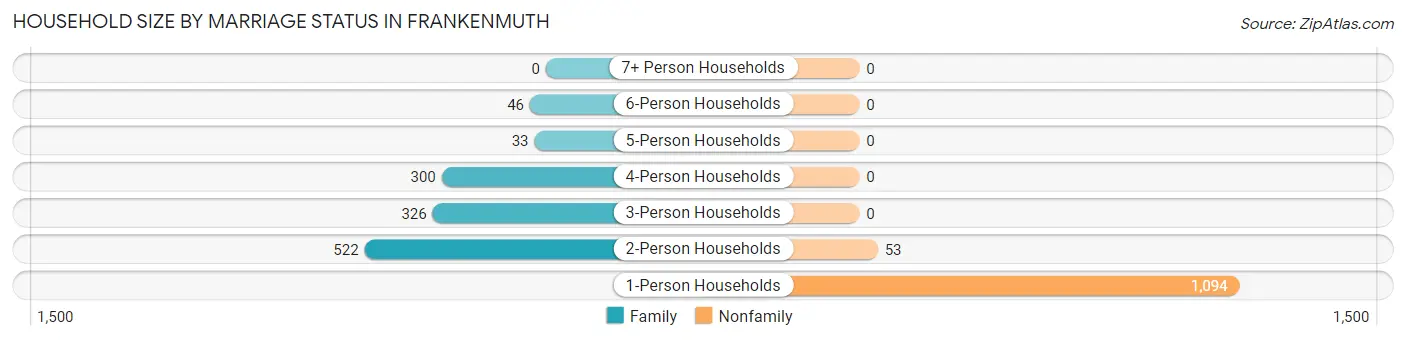
| Household Size | Family Households | Nonfamily Households |
| 1-Person Households | - | 1,094 (46.1%) |
| 2-Person Households | 522 (22.0%) | 53 (2.2%) |
| 3-Person Households | 326 (13.7%) | 0 (0.0%) |
| 4-Person Households | 300 (12.6%) | 0 (0.0%) |
| 5-Person Households | 33 (1.4%) | 0 (0.0%) |
| 6-Person Households | 46 (1.9%) | 0 (0.0%) |
| 7+ Person Households | 0 (0.0%) | 0 (0.0%) |
| Total | 1,227 (51.7%) | 1,147 (48.3%) |
Female Fertility in Frankenmuth
Fertility by Age in Frankenmuth
| Age Bracket | Women with Births | Births / 1,000 Women |
| 15 to 19 years | 0 (0.0%) | 0.0 |
| 20 to 34 years | 0 (0.0%) | 0.0 |
| 35 to 50 years | 0 (0.0%) | 0.0 |
| Total | 0 (0.0%) | 0.0 |
Fertility by Age by Marriage Status in Frankenmuth
| Age Bracket | Married | Unmarried |
| 15 to 19 years | 0 (0.0%) | 0 (0.0%) |
| 20 to 34 years | 0 (0.0%) | 0 (0.0%) |
| 35 to 50 years | 0 (0.0%) | 0 (0.0%) |
| Total | 0 (0.0%) | 0 (0.0%) |
Fertility by Education in Frankenmuth
| Educational Attainment | Women with Births | Births / 1,000 Women |
| Less than High School | 0 (0.0%) | 0.0 |
| High School Diploma | 0 (0.0%) | 0.0 |
| College or Associate's Degree | 0 (0.0%) | 0.0 |
| Bachelor's Degree | 0 (0.0%) | 0.0 |
| Graduate Degree | 0 (0.0%) | 0.0 |
| Total | 0 (0.0%) | 0.0 |
Fertility by Education by Marriage Status in Frankenmuth
| Educational Attainment | Married | Unmarried |
| Less than High School | 0 (0.0%) | 0 (0.0%) |
| High School Diploma | 0 (0.0%) | 0 (0.0%) |
| College or Associate's Degree | 0 (0.0%) | 0 (0.0%) |
| Bachelor's Degree | 0 (0.0%) | 0 (0.0%) |
| Graduate Degree | 0 (0.0%) | 0 (0.0%) |
| Total | 0 (0.0%) | 0 (0.0%) |
Employment Characteristics in Frankenmuth
Employment by Class of Employer in Frankenmuth
Among the 2,242 employed individuals in Frankenmuth, private company employees (1,619 | 72.2%), not-for-profit organizations (196 | 8.7%), and local government employees (195 | 8.7%) make up the most common classes of employment.
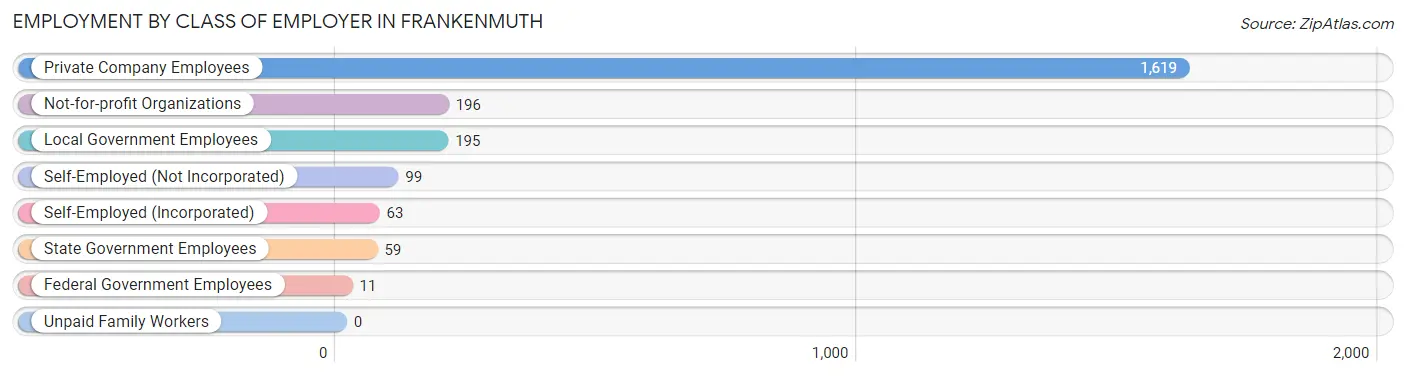
| Employer Class | # Employees | % Employees |
| Private Company Employees | 1,619 | 72.2% |
| Self-Employed (Incorporated) | 63 | 2.8% |
| Self-Employed (Not Incorporated) | 99 | 4.4% |
| Not-for-profit Organizations | 196 | 8.7% |
| Local Government Employees | 195 | 8.7% |
| State Government Employees | 59 | 2.6% |
| Federal Government Employees | 11 | 0.5% |
| Unpaid Family Workers | 0 | 0.0% |
| Total | 2,242 | 100.0% |
Employment Status by Age in Frankenmuth
According to the labor force statistics for Frankenmuth, out of the total population over 16 years of age (4,217), 58.4% or 2,463 individuals are in the labor force, with 5.7% or 140 of them unemployed. The age group with the highest labor force participation rate is 20 to 24 years, with 94.4% or 336 individuals in the labor force. Within the labor force, the 16 to 19 years age range has the highest percentage of unemployed individuals, with 57.7% or 41 of them being unemployed.
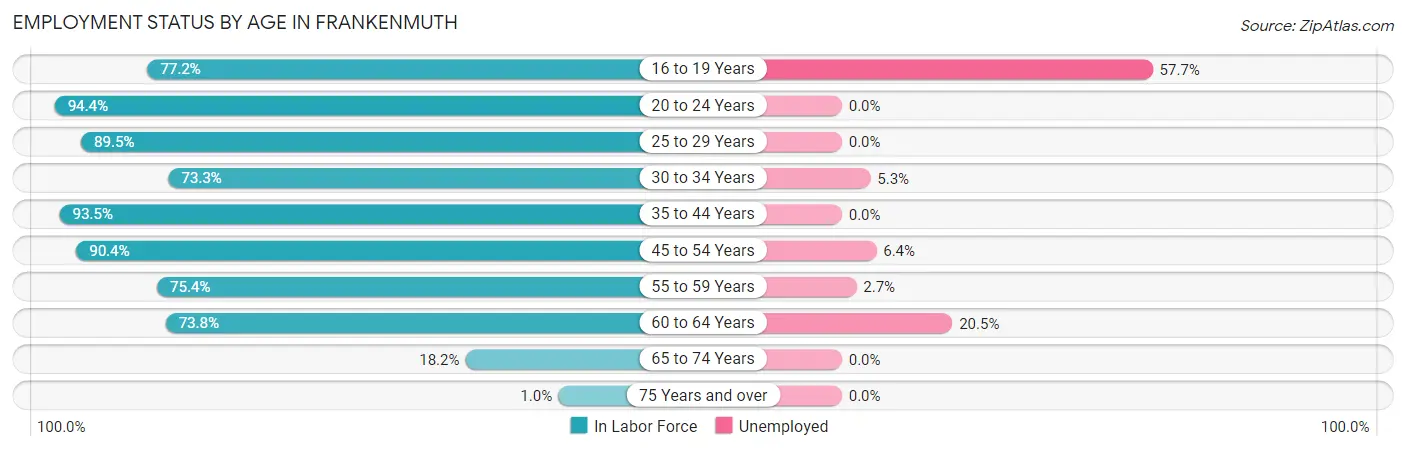
| Age Bracket | In Labor Force | Unemployed |
| 16 to 19 Years | 71 (77.2%) | 41 (57.7%) |
| 20 to 24 Years | 336 (94.4%) | 0 (0.0%) |
| 25 to 29 Years | 263 (89.5%) | 0 (0.0%) |
| 30 to 34 Years | 244 (73.3%) | 13 (5.3%) |
| 35 to 44 Years | 346 (93.5%) | 0 (0.0%) |
| 45 to 54 Years | 582 (90.4%) | 37 (6.4%) |
| 55 to 59 Years | 294 (75.4%) | 8 (2.7%) |
| 60 to 64 Years | 200 (73.8%) | 41 (20.5%) |
| 65 to 74 Years | 119 (18.2%) | 0 (0.0%) |
| 75 Years and over | 8 (1.0%) | 0 (0.0%) |
| Total | 2,463 (58.4%) | 140 (5.7%) |
Employment Status by Educational Attainment in Frankenmuth
According to labor force statistics for Frankenmuth, 83.8% of individuals (1,929) out of the total population between 25 and 64 years of age (2,302) are in the labor force, with 5.1% or 98 of them being unemployed. The group with the highest labor force participation rate are those with the educational attainment of bachelor's degree or higher, with 85.5% or 1,125 individuals in the labor force. Within the labor force, individuals with bachelor's degree or higher education have the highest percentage of unemployment, with 6.2% or 70 of them being unemployed.
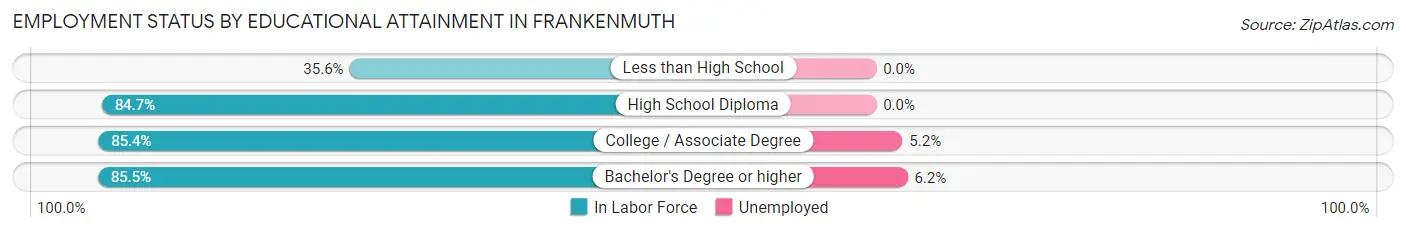
| Educational Attainment | In Labor Force | Unemployed |
| Less than High School | 26 (35.6%) | 0 (0.0%) |
| High School Diploma | 221 (84.7%) | 0 (0.0%) |
| College / Associate Degree | 557 (85.4%) | 34 (5.2%) |
| Bachelor's Degree or higher | 1,125 (85.5%) | 82 (6.2%) |
| Total | 1,929 (83.8%) | 117 (5.1%) |
Employment Occupations by Sex in Frankenmuth
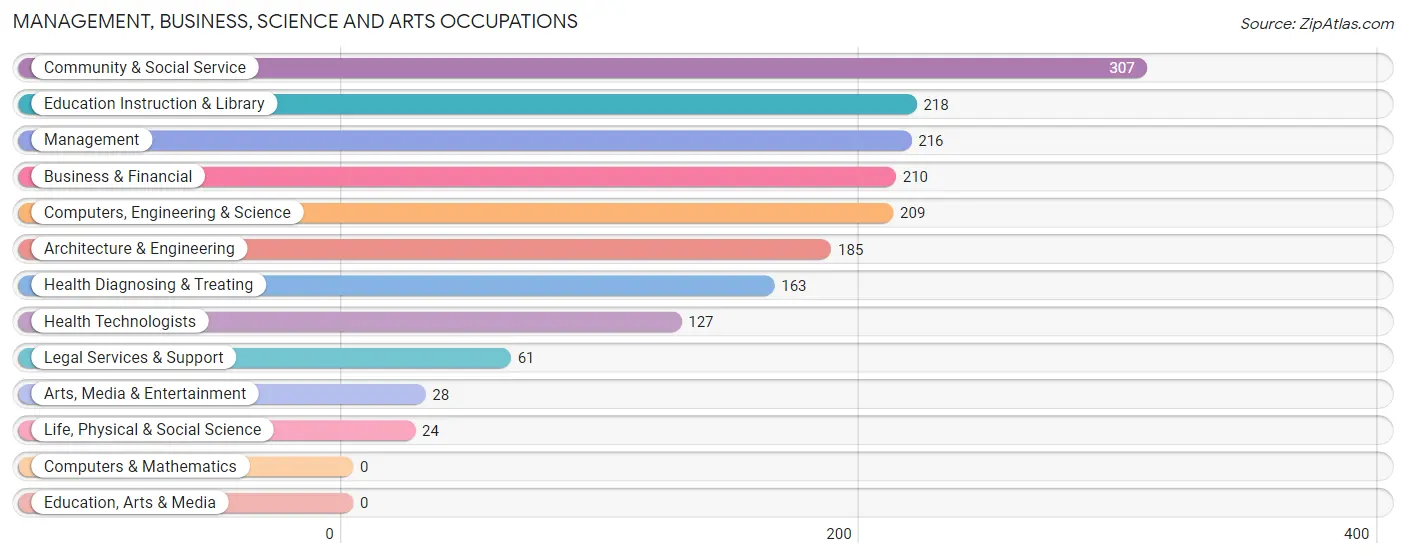
Management, Business, Science and Arts Occupations
The most common Management, Business, Science and Arts occupations in Frankenmuth are Community & Social Service (307 | 13.2%), Education Instruction & Library (218 | 9.4%), Management (216 | 9.3%), Business & Financial (210 | 9.0%), and Computers, Engineering & Science (209 | 9.0%).
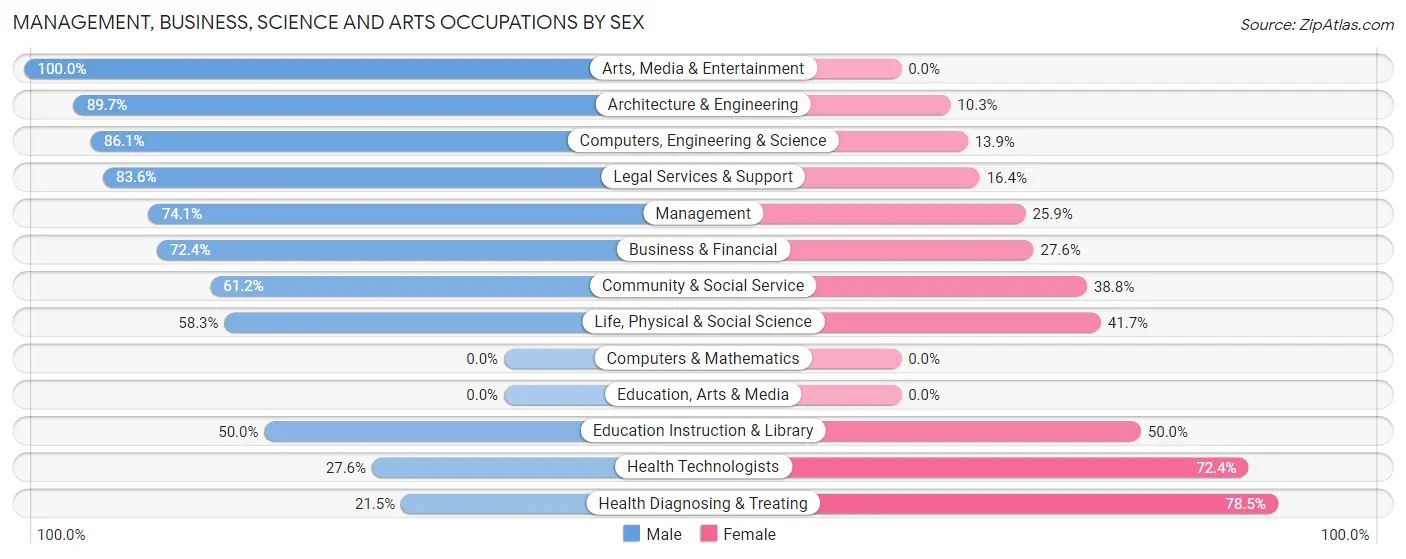
Management, Business, Science and Arts Occupations by Sex
Within the Management, Business, Science and Arts occupations in Frankenmuth, the most male-oriented occupations are Arts, Media & Entertainment (100.0%), Architecture & Engineering (89.7%), and Computers, Engineering & Science (86.1%), while the most female-oriented occupations are Health Diagnosing & Treating (78.5%), Health Technologists (72.4%), and Education Instruction & Library (50.0%).
| Occupation | Male | Female |
| Management | 160 (74.1%) | 56 (25.9%) |
| Business & Financial | 152 (72.4%) | 58 (27.6%) |
| Computers, Engineering & Science | 180 (86.1%) | 29 (13.9%) |
| Computers & Mathematics | 0 (0.0%) | 0 (0.0%) |
| Architecture & Engineering | 166 (89.7%) | 19 (10.3%) |
| Life, Physical & Social Science | 14 (58.3%) | 10 (41.7%) |
| Community & Social Service | 188 (61.2%) | 119 (38.8%) |
| Education, Arts & Media | 0 (0.0%) | 0 (0.0%) |
| Legal Services & Support | 51 (83.6%) | 10 (16.4%) |
| Education Instruction & Library | 109 (50.0%) | 109 (50.0%) |
| Arts, Media & Entertainment | 28 (100.0%) | 0 (0.0%) |
| Health Diagnosing & Treating | 35 (21.5%) | 128 (78.5%) |
| Health Technologists | 35 (27.6%) | 92 (72.4%) |
| Total (Category) | 715 (64.7%) | 390 (35.3%) |
| Total (Overall) | 1,299 (55.9%) | 1,024 (44.1%) |
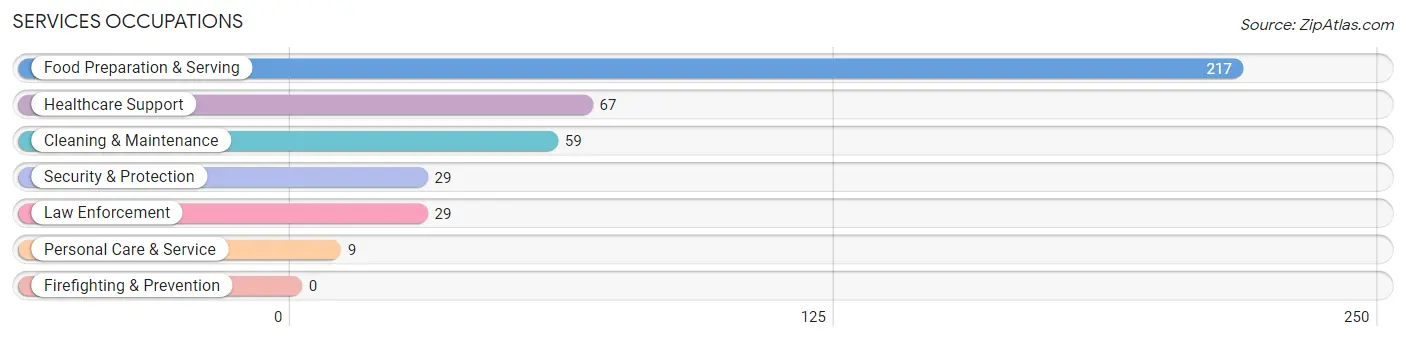
Services Occupations
The most common Services occupations in Frankenmuth are Food Preparation & Serving (217 | 9.3%), Healthcare Support (67 | 2.9%), Cleaning & Maintenance (59 | 2.5%), Security & Protection (29 | 1.3%), and Law Enforcement (29 | 1.3%).
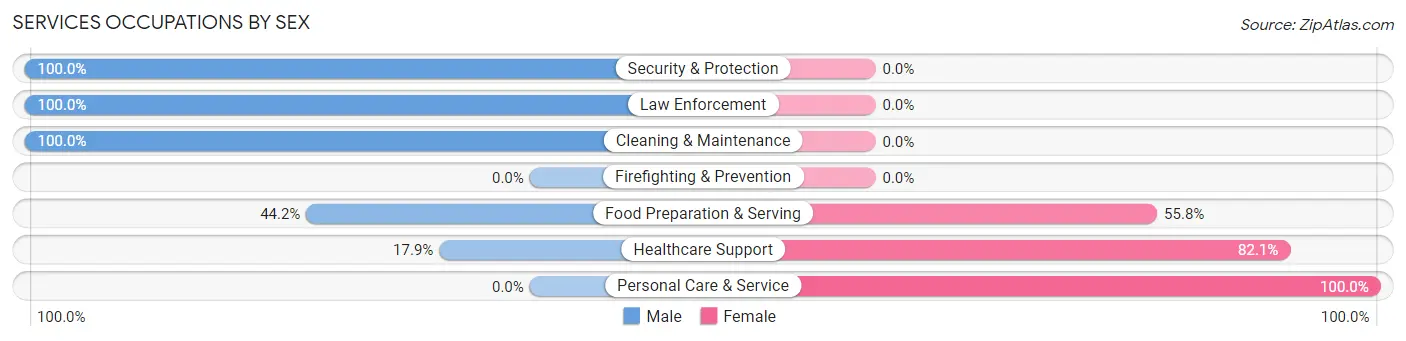
Services Occupations by Sex
Within the Services occupations in Frankenmuth, the most male-oriented occupations are Security & Protection (100.0%), Law Enforcement (100.0%), and Cleaning & Maintenance (100.0%), while the most female-oriented occupations are Personal Care & Service (100.0%), Healthcare Support (82.1%), and Food Preparation & Serving (55.8%).
| Occupation | Male | Female |
| Healthcare Support | 12 (17.9%) | 55 (82.1%) |
| Security & Protection | 29 (100.0%) | 0 (0.0%) |
| Firefighting & Prevention | 0 (0.0%) | 0 (0.0%) |
| Law Enforcement | 29 (100.0%) | 0 (0.0%) |
| Food Preparation & Serving | 96 (44.2%) | 121 (55.8%) |
| Cleaning & Maintenance | 59 (100.0%) | 0 (0.0%) |
| Personal Care & Service | 0 (0.0%) | 9 (100.0%) |
| Total (Category) | 196 (51.4%) | 185 (48.6%) |
| Total (Overall) | 1,299 (55.9%) | 1,024 (44.1%) |
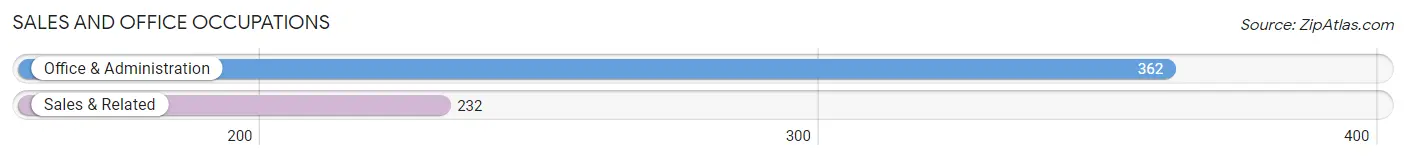
Sales and Office Occupations
The most common Sales and Office occupations in Frankenmuth are Office & Administration (362 | 15.6%), and Sales & Related (232 | 10.0%).
Sales and Office Occupations by Sex
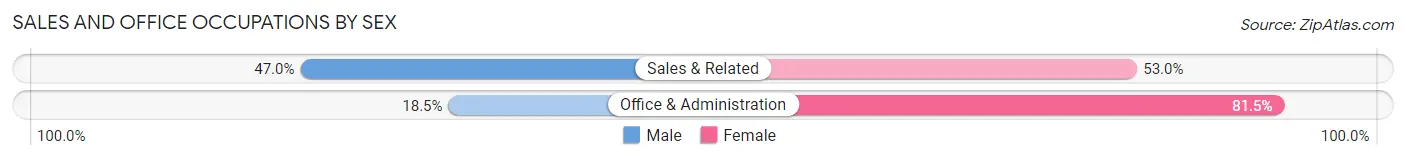
| Occupation | Male | Female |
| Sales & Related | 109 (47.0%) | 123 (53.0%) |
| Office & Administration | 67 (18.5%) | 295 (81.5%) |
| Total (Category) | 176 (29.6%) | 418 (70.4%) |
| Total (Overall) | 1,299 (55.9%) | 1,024 (44.1%) |
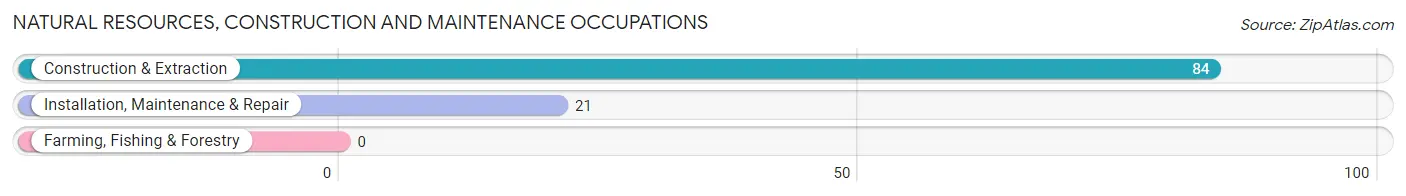
Natural Resources, Construction and Maintenance Occupations
The most common Natural Resources, Construction and Maintenance occupations in Frankenmuth are Construction & Extraction (84 | 3.6%), and Installation, Maintenance & Repair (21 | 0.9%).
Natural Resources, Construction and Maintenance Occupations by Sex
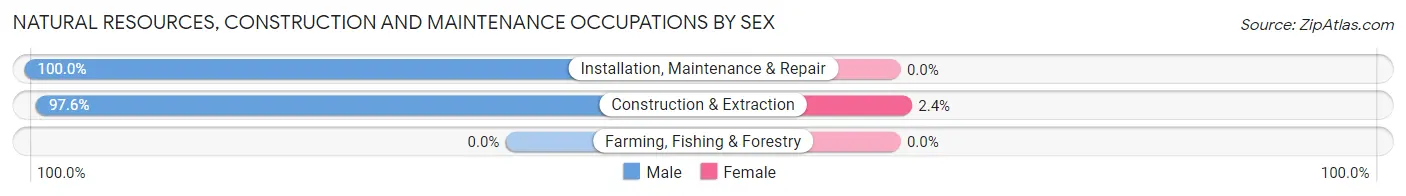
| Occupation | Male | Female |
| Farming, Fishing & Forestry | 0 (0.0%) | 0 (0.0%) |
| Construction & Extraction | 82 (97.6%) | 2 (2.4%) |
| Installation, Maintenance & Repair | 21 (100.0%) | 0 (0.0%) |
| Total (Category) | 103 (98.1%) | 2 (1.9%) |
| Total (Overall) | 1,299 (55.9%) | 1,024 (44.1%) |
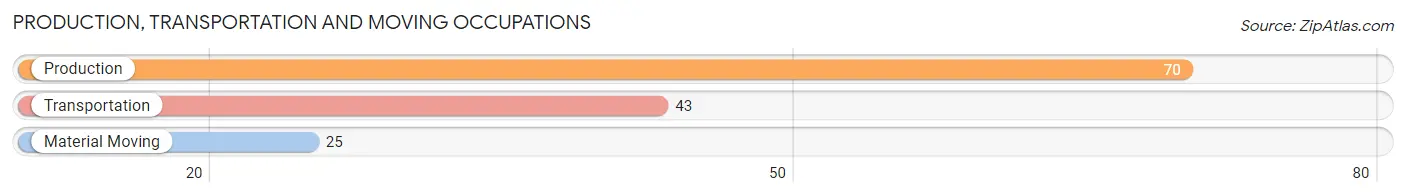
Production, Transportation and Moving Occupations
The most common Production, Transportation and Moving occupations in Frankenmuth are Production (70 | 3.0%), Transportation (43 | 1.8%), and Material Moving (25 | 1.1%).
Production, Transportation and Moving Occupations by Sex
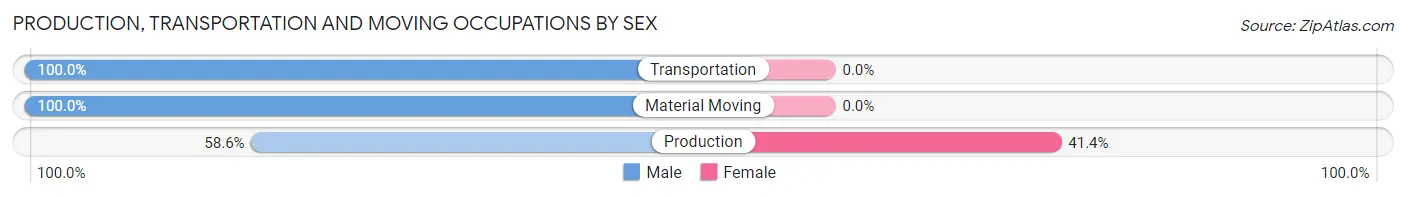
| Occupation | Male | Female |
| Production | 41 (58.6%) | 29 (41.4%) |
| Transportation | 43 (100.0%) | 0 (0.0%) |
| Material Moving | 25 (100.0%) | 0 (0.0%) |
| Total (Category) | 109 (79.0%) | 29 (21.0%) |
| Total (Overall) | 1,299 (55.9%) | 1,024 (44.1%) |
Employment Industries by Sex in Frankenmuth
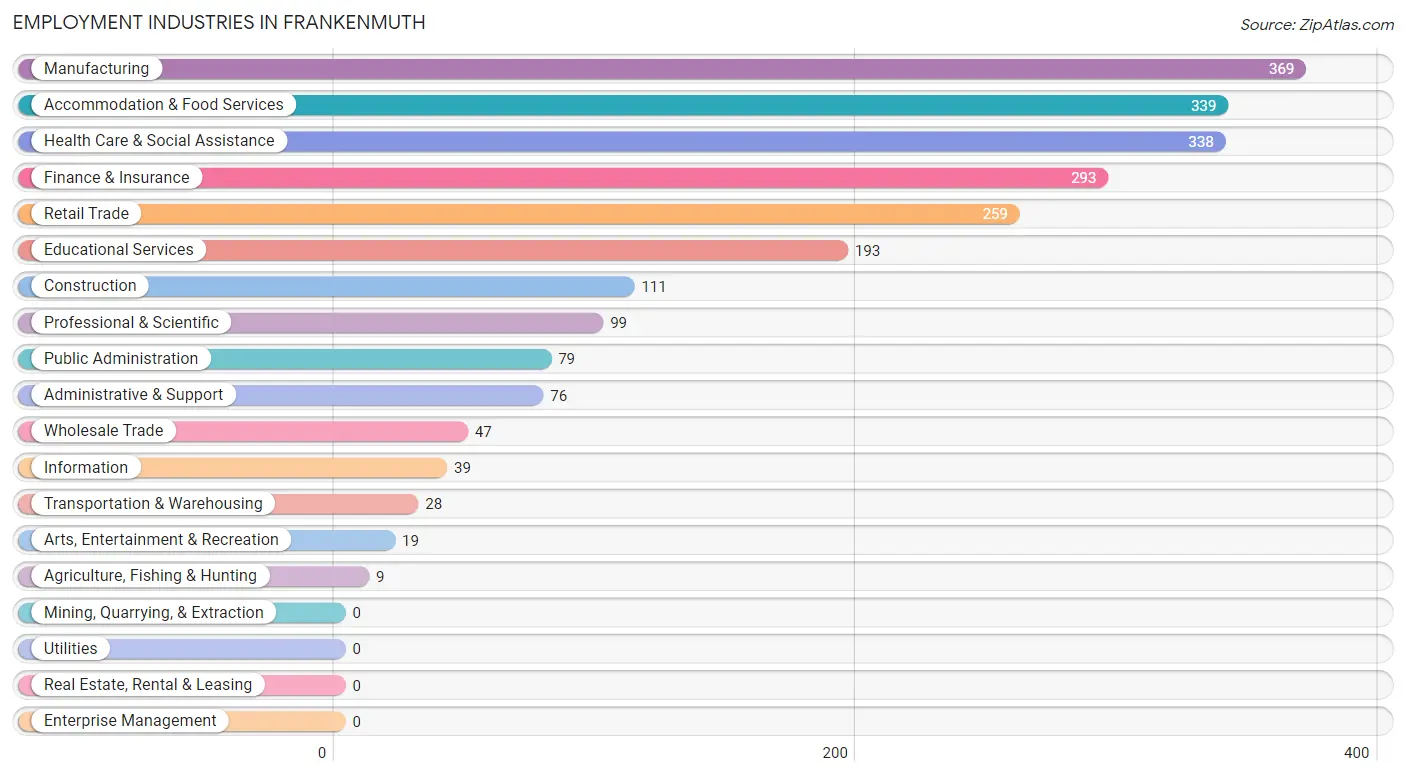
Employment Industries in Frankenmuth
The major employment industries in Frankenmuth include Manufacturing (369 | 15.9%), Accommodation & Food Services (339 | 14.6%), Health Care & Social Assistance (338 | 14.5%), Finance & Insurance (293 | 12.6%), and Retail Trade (259 | 11.2%).
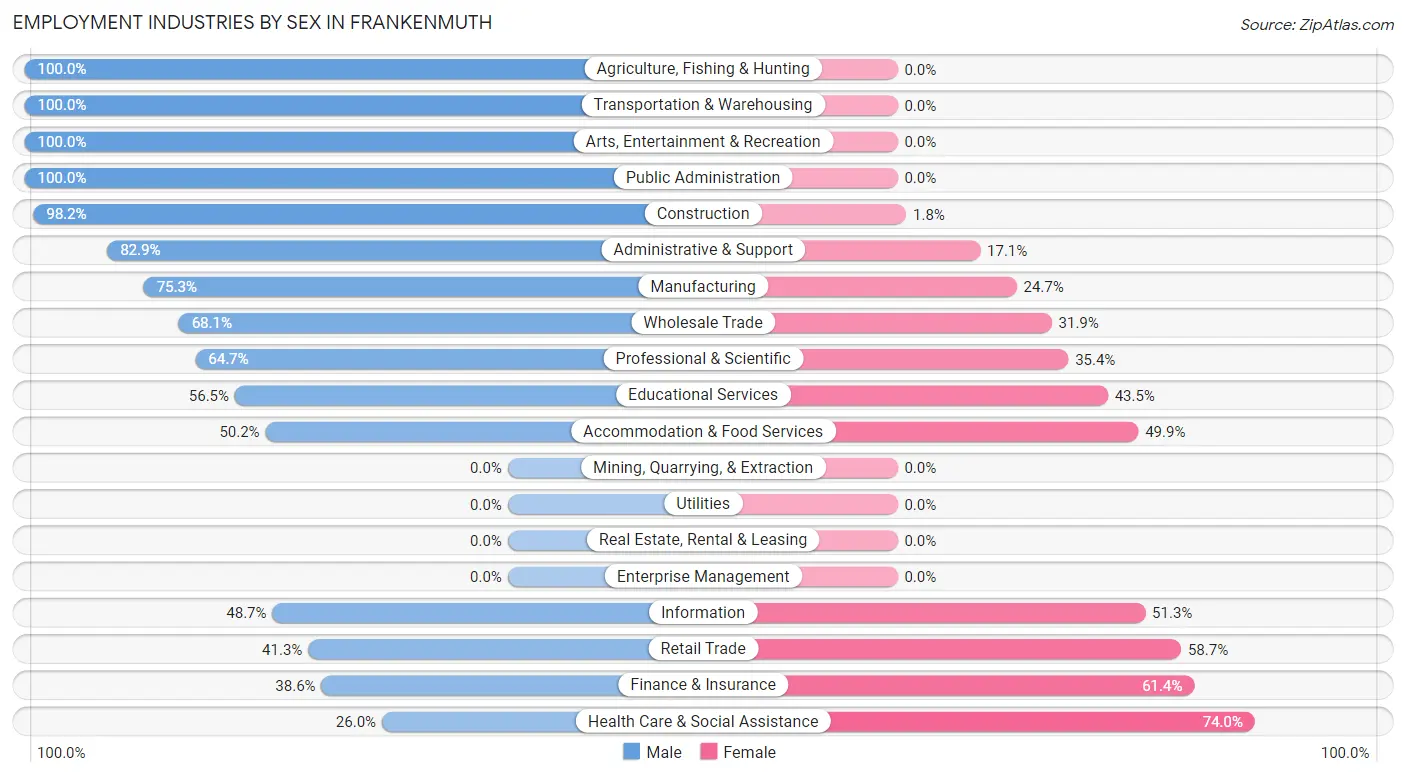
Employment Industries by Sex in Frankenmuth
The Frankenmuth industries that see more men than women are Agriculture, Fishing & Hunting (100.0%), Transportation & Warehousing (100.0%), and Arts, Entertainment & Recreation (100.0%), whereas the industries that tend to have a higher number of women are Health Care & Social Assistance (74.0%), Finance & Insurance (61.4%), and Retail Trade (58.7%).
| Industry | Male | Female |
| Agriculture, Fishing & Hunting | 9 (100.0%) | 0 (0.0%) |
| Mining, Quarrying, & Extraction | 0 (0.0%) | 0 (0.0%) |
| Construction | 109 (98.2%) | 2 (1.8%) |
| Manufacturing | 278 (75.3%) | 91 (24.7%) |
| Wholesale Trade | 32 (68.1%) | 15 (31.9%) |
| Retail Trade | 107 (41.3%) | 152 (58.7%) |
| Transportation & Warehousing | 28 (100.0%) | 0 (0.0%) |
| Utilities | 0 (0.0%) | 0 (0.0%) |
| Information | 19 (48.7%) | 20 (51.3%) |
| Finance & Insurance | 113 (38.6%) | 180 (61.4%) |
| Real Estate, Rental & Leasing | 0 (0.0%) | 0 (0.0%) |
| Professional & Scientific | 64 (64.6%) | 35 (35.3%) |
| Enterprise Management | 0 (0.0%) | 0 (0.0%) |
| Administrative & Support | 63 (82.9%) | 13 (17.1%) |
| Educational Services | 109 (56.5%) | 84 (43.5%) |
| Health Care & Social Assistance | 88 (26.0%) | 250 (74.0%) |
| Arts, Entertainment & Recreation | 19 (100.0%) | 0 (0.0%) |
| Accommodation & Food Services | 170 (50.1%) | 169 (49.8%) |
| Public Administration | 79 (100.0%) | 0 (0.0%) |
| Total | 1,299 (55.9%) | 1,024 (44.1%) |
Education in Frankenmuth
School Enrollment in Frankenmuth
The most common levels of schooling among the 827 students in Frankenmuth are high school (288 | 34.8%), middle school (168 | 20.3%), and college / undergraduate (116 | 14.0%).
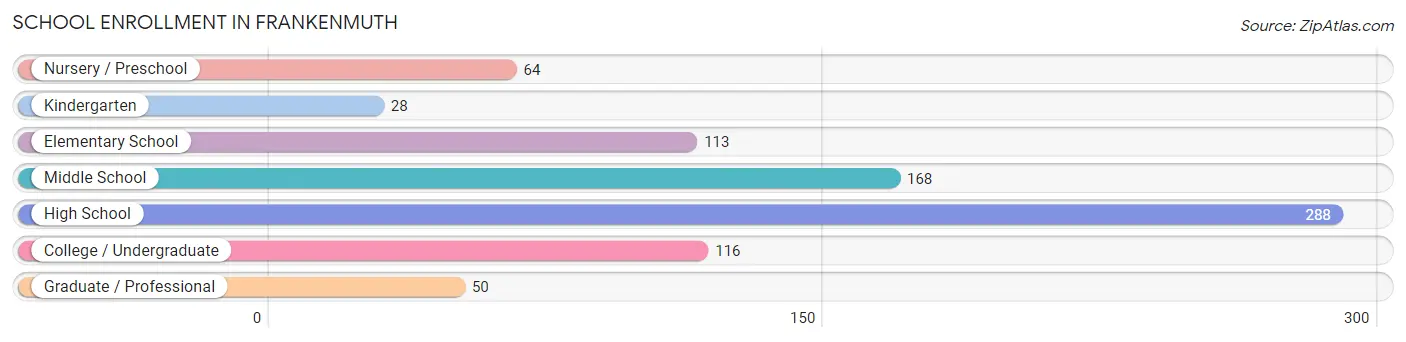
| School Level | # Students | % Students |
| Nursery / Preschool | 64 | 7.7% |
| Kindergarten | 28 | 3.4% |
| Elementary School | 113 | 13.7% |
| Middle School | 168 | 20.3% |
| High School | 288 | 34.8% |
| College / Undergraduate | 116 | 14.0% |
| Graduate / Professional | 50 | 6.0% |
| Total | 827 | 100.0% |
School Enrollment by Age by Funding Source in Frankenmuth
Out of a total of 827 students who are enrolled in schools in Frankenmuth, 70 (8.5%) attend a private institution, while the remaining 757 (91.5%) are enrolled in public schools. The age group of 3 to 4 year olds has the highest likelihood of being enrolled in private schools, with 34 (100.0% in the age bracket) enrolled. Conversely, the age group of 10 to 14 year olds has the lowest likelihood of being enrolled in a private school, with 282 (100.0% in the age bracket) attending a public institution.
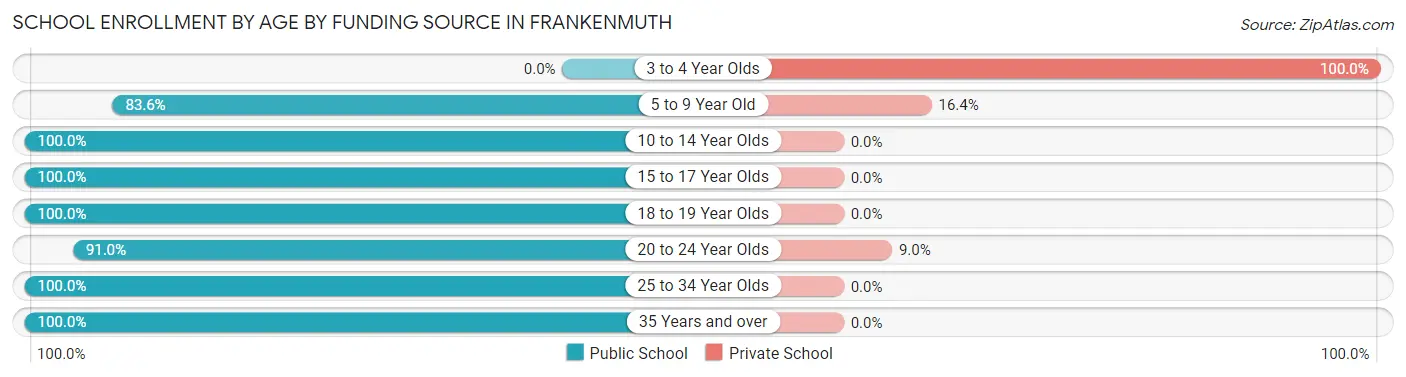
| Age Bracket | Public School | Private School |
| 3 to 4 Year Olds | 0 (0.0%) | 34 (100.0%) |
| 5 to 9 Year Old | 143 (83.6%) | 28 (16.4%) |
| 10 to 14 Year Olds | 282 (100.0%) | 0 (0.0%) |
| 15 to 17 Year Olds | 174 (100.0%) | 0 (0.0%) |
| 18 to 19 Year Olds | 10 (100.0%) | 0 (0.0%) |
| 20 to 24 Year Olds | 81 (91.0%) | 8 (9.0%) |
| 25 to 34 Year Olds | 6 (100.0%) | 0 (0.0%) |
| 35 Years and over | 61 (100.0%) | 0 (0.0%) |
| Total | 757 (91.5%) | 70 (8.5%) |
Educational Attainment by Field of Study in Frankenmuth
Business (480 | 25.9%), arts & humanities (271 | 14.6%), education (252 | 13.6%), science & technology (164 | 8.9%), and engineering (149 | 8.1%) are the most common fields of study among 1,852 individuals in Frankenmuth who have obtained a bachelor's degree or higher.
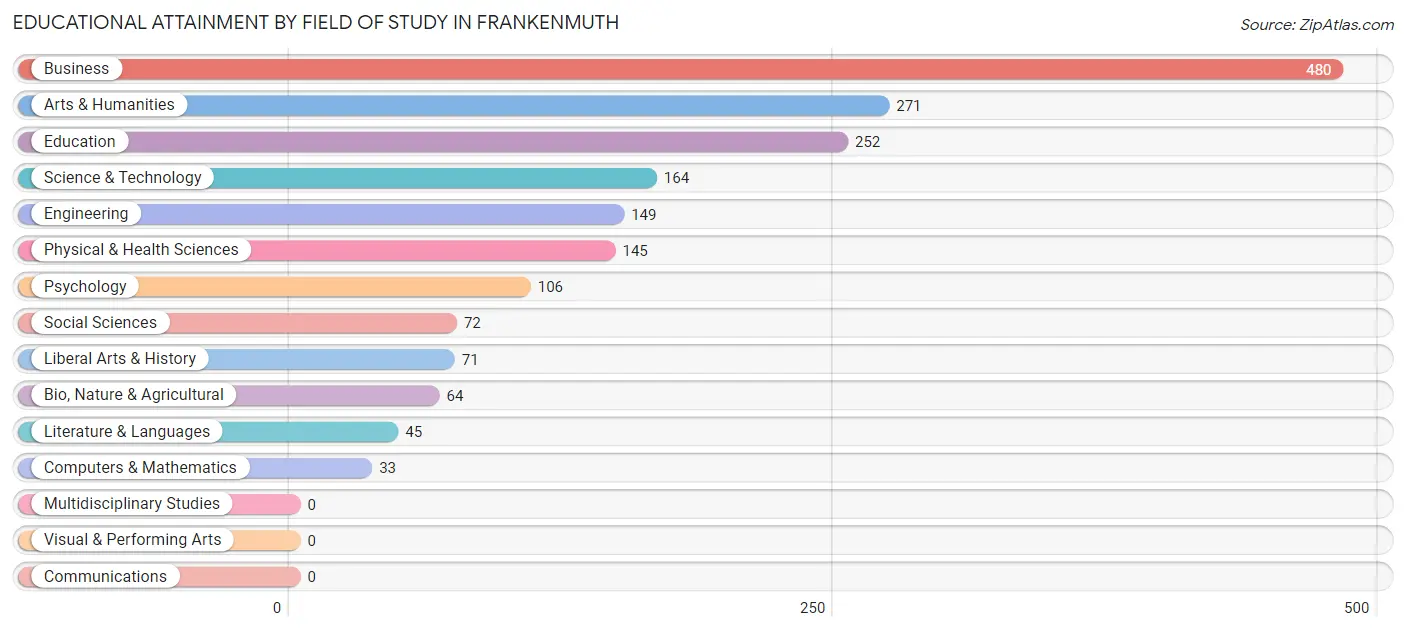
| Field of Study | # Graduates | % Graduates |
| Computers & Mathematics | 33 | 1.8% |
| Bio, Nature & Agricultural | 64 | 3.5% |
| Physical & Health Sciences | 145 | 7.8% |
| Psychology | 106 | 5.7% |
| Social Sciences | 72 | 3.9% |
| Engineering | 149 | 8.1% |
| Multidisciplinary Studies | 0 | 0.0% |
| Science & Technology | 164 | 8.9% |
| Business | 480 | 25.9% |
| Education | 252 | 13.6% |
| Literature & Languages | 45 | 2.4% |
| Liberal Arts & History | 71 | 3.8% |
| Visual & Performing Arts | 0 | 0.0% |
| Communications | 0 | 0.0% |
| Arts & Humanities | 271 | 14.6% |
| Total | 1,852 | 100.0% |
Transportation & Commute in Frankenmuth
Vehicle Availability by Sex in Frankenmuth
The most prevalent vehicle ownership categories in Frankenmuth are males with 2 vehicles (400, accounting for 31.9%) and females with 2 vehicles (367, making up 40.5%).
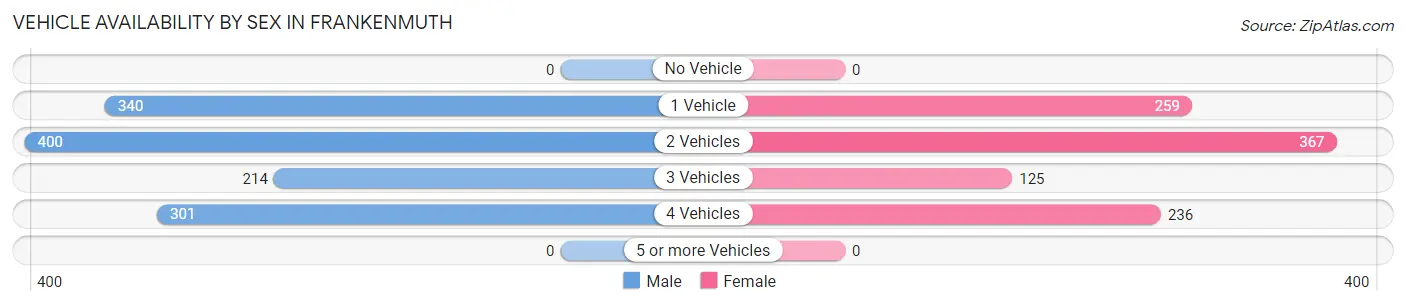
| Vehicles Available | Male | Female |
| No Vehicle | 0 (0.0%) | 0 (0.0%) |
| 1 Vehicle | 340 (27.1%) | 259 (26.2%) |
| 2 Vehicles | 400 (31.9%) | 367 (37.2%) |
| 3 Vehicles | 214 (17.1%) | 125 (12.7%) |
| 4 Vehicles | 301 (24.0%) | 236 (23.9%) |
| 5 or more Vehicles | 0 (0.0%) | 0 (0.0%) |
| Total | 1,255 (100.0%) | 987 (100.0%) |
Commute Time in Frankenmuth
The most frequently occuring commute durations in Frankenmuth are 5 to 9 minutes (527 commuters, 26.2%), less than 5 minutes (325 commuters, 16.2%), and 20 to 24 minutes (283 commuters, 14.1%).
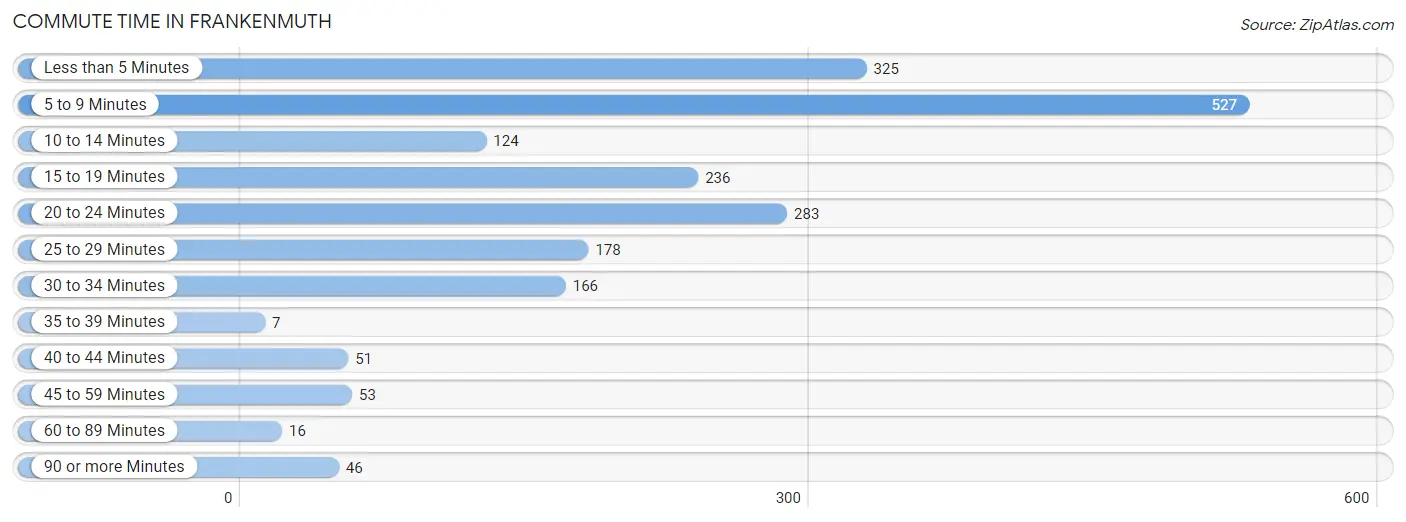
| Commute Time | # Commuters | % Commuters |
| Less than 5 Minutes | 325 | 16.2% |
| 5 to 9 Minutes | 527 | 26.2% |
| 10 to 14 Minutes | 124 | 6.2% |
| 15 to 19 Minutes | 236 | 11.7% |
| 20 to 24 Minutes | 283 | 14.1% |
| 25 to 29 Minutes | 178 | 8.8% |
| 30 to 34 Minutes | 166 | 8.3% |
| 35 to 39 Minutes | 7 | 0.4% |
| 40 to 44 Minutes | 51 | 2.5% |
| 45 to 59 Minutes | 53 | 2.6% |
| 60 to 89 Minutes | 16 | 0.8% |
| 90 or more Minutes | 46 | 2.3% |
Commute Time by Sex in Frankenmuth
The most common commute times in Frankenmuth are 20 to 24 minutes (224 commuters, 20.2%) for males and 5 to 9 minutes (308 commuters, 34.0%) for females.
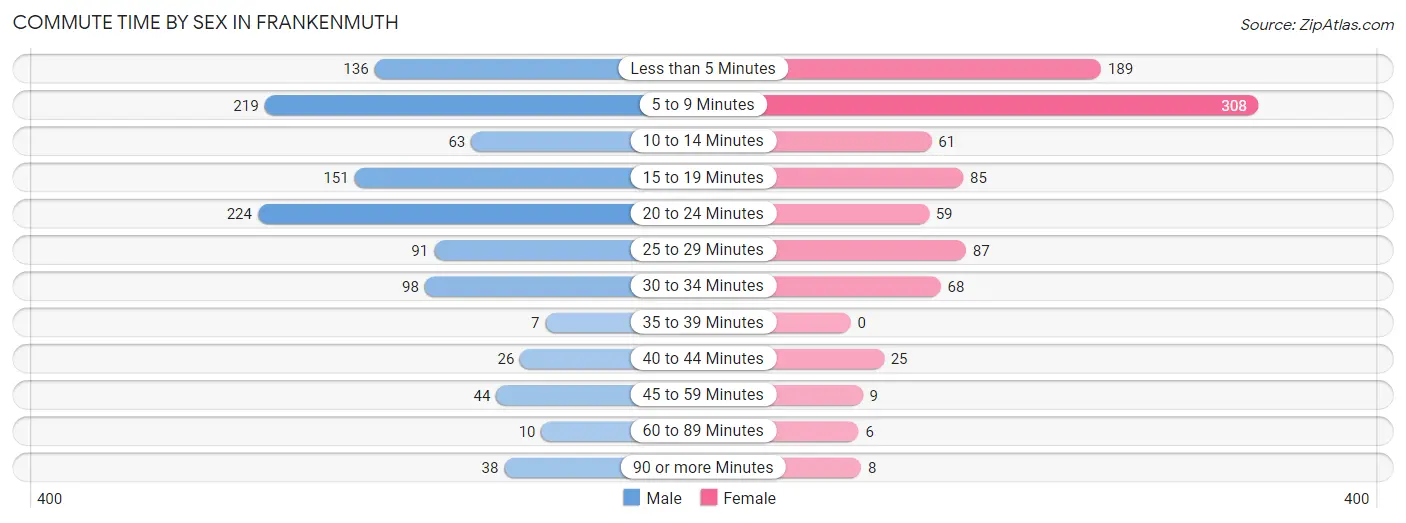
| Commute Time | Male | Female |
| Less than 5 Minutes | 136 (12.3%) | 189 (20.9%) |
| 5 to 9 Minutes | 219 (19.8%) | 308 (34.0%) |
| 10 to 14 Minutes | 63 (5.7%) | 61 (6.7%) |
| 15 to 19 Minutes | 151 (13.6%) | 85 (9.4%) |
| 20 to 24 Minutes | 224 (20.2%) | 59 (6.5%) |
| 25 to 29 Minutes | 91 (8.2%) | 87 (9.6%) |
| 30 to 34 Minutes | 98 (8.8%) | 68 (7.5%) |
| 35 to 39 Minutes | 7 (0.6%) | 0 (0.0%) |
| 40 to 44 Minutes | 26 (2.4%) | 25 (2.8%) |
| 45 to 59 Minutes | 44 (4.0%) | 9 (1.0%) |
| 60 to 89 Minutes | 10 (0.9%) | 6 (0.7%) |
| 90 or more Minutes | 38 (3.4%) | 8 (0.9%) |
Time of Departure to Work by Sex in Frankenmuth
The most frequent times of departure to work in Frankenmuth are 7:00 AM to 7:29 AM (295, 26.7%) for males and 7:30 AM to 7:59 AM (283, 31.3%) for females.
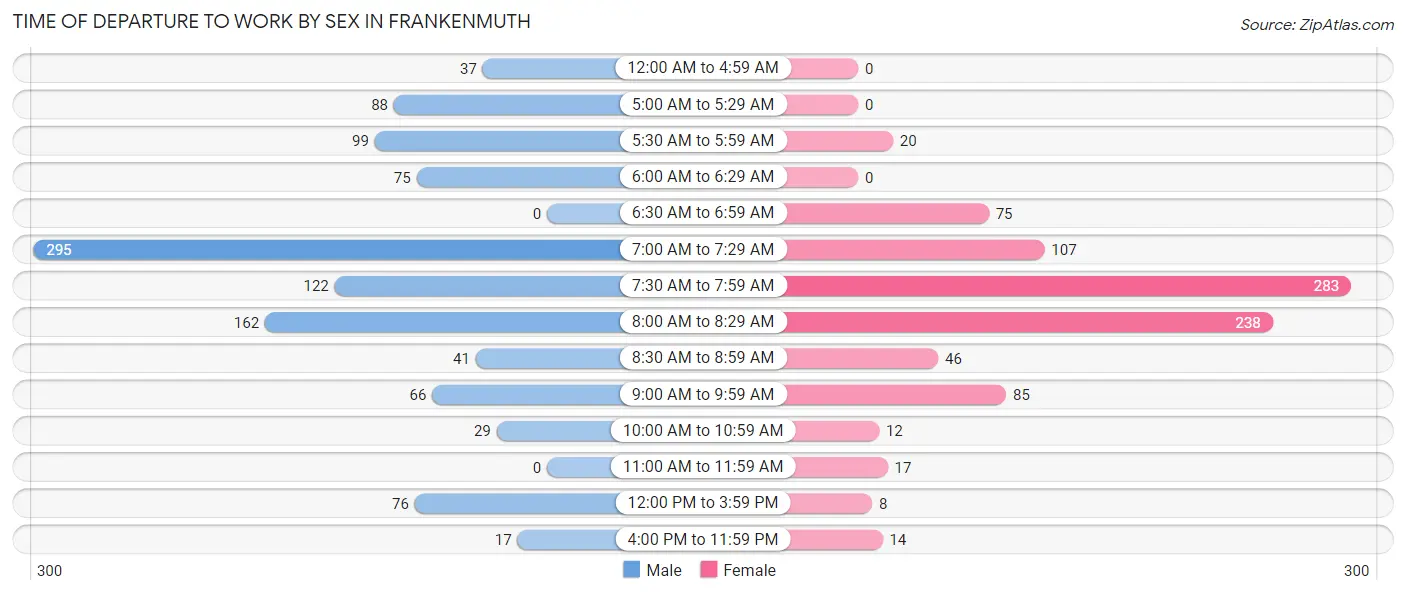
| Time of Departure | Male | Female |
| 12:00 AM to 4:59 AM | 37 (3.3%) | 0 (0.0%) |
| 5:00 AM to 5:29 AM | 88 (8.0%) | 0 (0.0%) |
| 5:30 AM to 5:59 AM | 99 (8.9%) | 20 (2.2%) |
| 6:00 AM to 6:29 AM | 75 (6.8%) | 0 (0.0%) |
| 6:30 AM to 6:59 AM | 0 (0.0%) | 75 (8.3%) |
| 7:00 AM to 7:29 AM | 295 (26.7%) | 107 (11.8%) |
| 7:30 AM to 7:59 AM | 122 (11.0%) | 283 (31.3%) |
| 8:00 AM to 8:29 AM | 162 (14.6%) | 238 (26.3%) |
| 8:30 AM to 8:59 AM | 41 (3.7%) | 46 (5.1%) |
| 9:00 AM to 9:59 AM | 66 (6.0%) | 85 (9.4%) |
| 10:00 AM to 10:59 AM | 29 (2.6%) | 12 (1.3%) |
| 11:00 AM to 11:59 AM | 0 (0.0%) | 17 (1.9%) |
| 12:00 PM to 3:59 PM | 76 (6.9%) | 8 (0.9%) |
| 4:00 PM to 11:59 PM | 17 (1.5%) | 14 (1.5%) |
| Total | 1,107 (100.0%) | 905 (100.0%) |
Housing Occupancy in Frankenmuth
Occupancy by Ownership in Frankenmuth
Of the total 2,374 dwellings in Frankenmuth, owner-occupied units account for 1,515 (63.8%), while renter-occupied units make up 859 (36.2%).
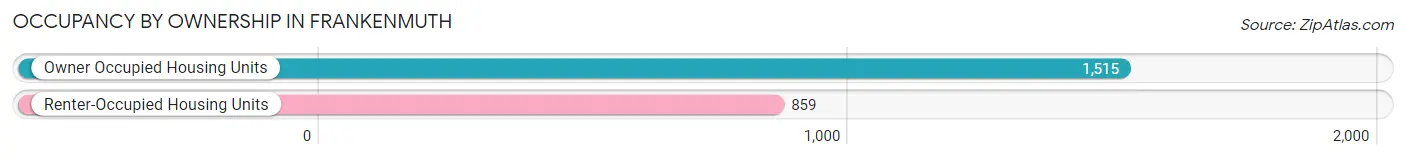
| Occupancy | # Housing Units | % Housing Units |
| Owner Occupied Housing Units | 1,515 | 63.8% |
| Renter-Occupied Housing Units | 859 | 36.2% |
| Total Occupied Housing Units | 2,374 | 100.0% |
Occupancy by Household Size in Frankenmuth
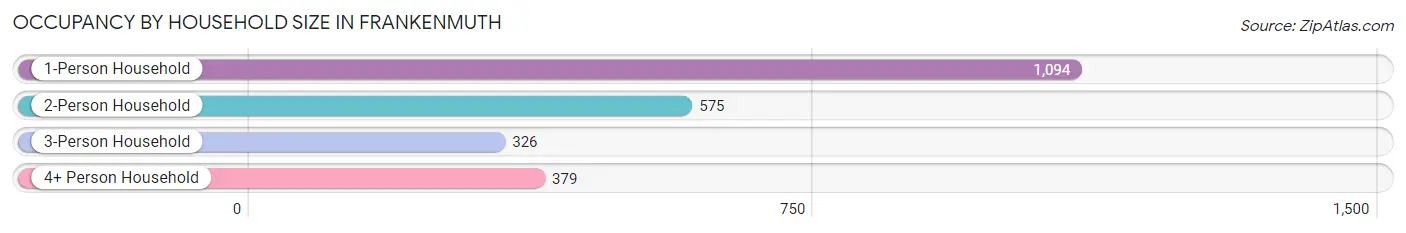
| Household Size | # Housing Units | % Housing Units |
| 1-Person Household | 1,094 | 46.1% |
| 2-Person Household | 575 | 24.2% |
| 3-Person Household | 326 | 13.7% |
| 4+ Person Household | 379 | 16.0% |
| Total Housing Units | 2,374 | 100.0% |
Occupancy by Ownership by Household Size in Frankenmuth
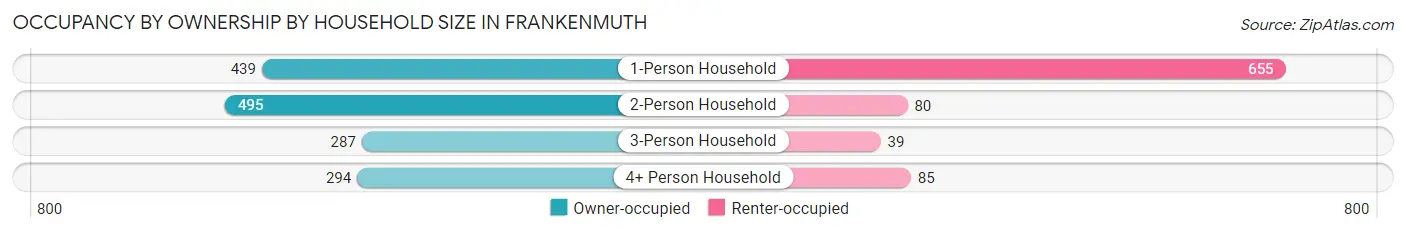
| Household Size | Owner-occupied | Renter-occupied |
| 1-Person Household | 439 (40.1%) | 655 (59.9%) |
| 2-Person Household | 495 (86.1%) | 80 (13.9%) |
| 3-Person Household | 287 (88.0%) | 39 (12.0%) |
| 4+ Person Household | 294 (77.6%) | 85 (22.4%) |
| Total Housing Units | 1,515 (63.8%) | 859 (36.2%) |
Occupancy by Educational Attainment in Frankenmuth
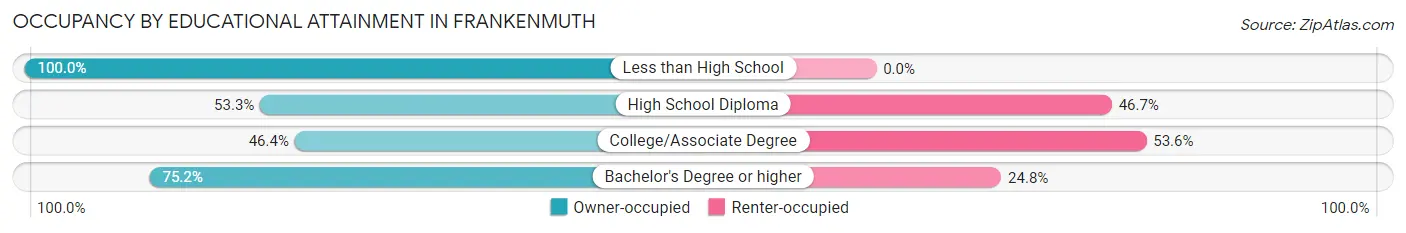
| Household Size | Owner-occupied | Renter-occupied |
| Less than High School | 27 (100.0%) | 0 (0.0%) |
| High School Diploma | 242 (53.3%) | 212 (46.7%) |
| College/Associate Degree | 287 (46.4%) | 331 (53.6%) |
| Bachelor's Degree or higher | 959 (75.2%) | 316 (24.8%) |
Occupancy by Age of Householder in Frankenmuth
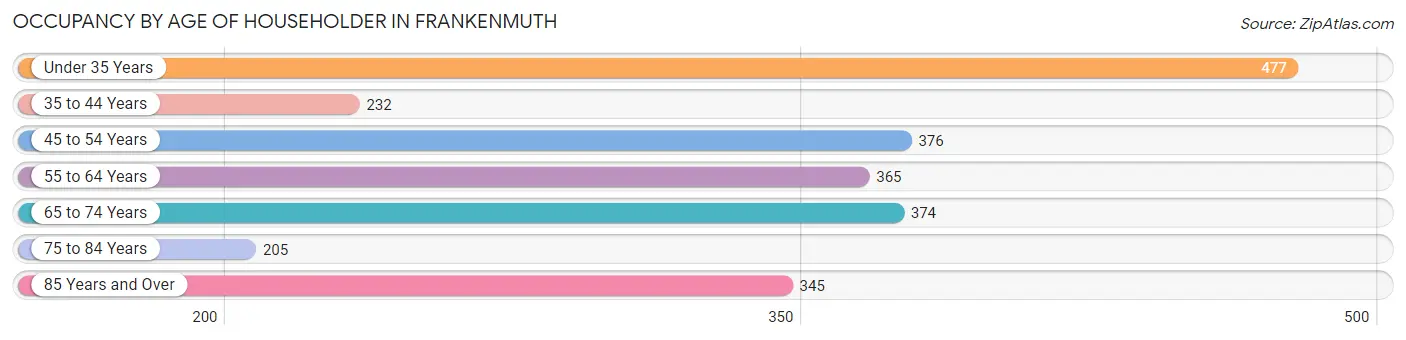
| Age Bracket | # Households | % Households |
| Under 35 Years | 477 | 20.1% |
| 35 to 44 Years | 232 | 9.8% |
| 45 to 54 Years | 376 | 15.8% |
| 55 to 64 Years | 365 | 15.4% |
| 65 to 74 Years | 374 | 15.8% |
| 75 to 84 Years | 205 | 8.6% |
| 85 Years and Over | 345 | 14.5% |
| Total | 2,374 | 100.0% |
Housing Finances in Frankenmuth
Median Income by Occupancy in Frankenmuth
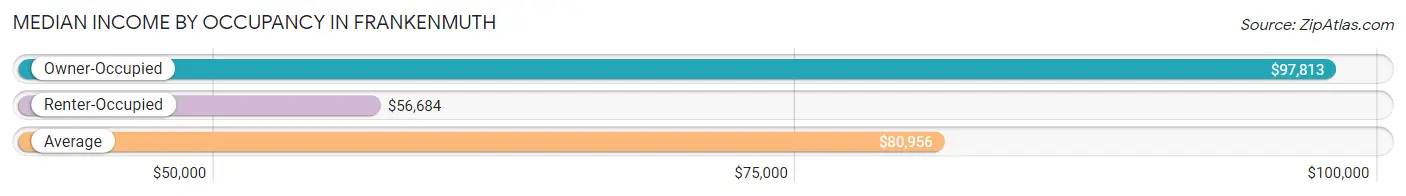
| Occupancy Type | # Households | Median Income |
| Owner-Occupied | 1,515 (63.8%) | $97,813 |
| Renter-Occupied | 859 (36.2%) | $56,684 |
| Average | 2,374 (100.0%) | $80,956 |
Occupancy by Householder Income Bracket in Frankenmuth
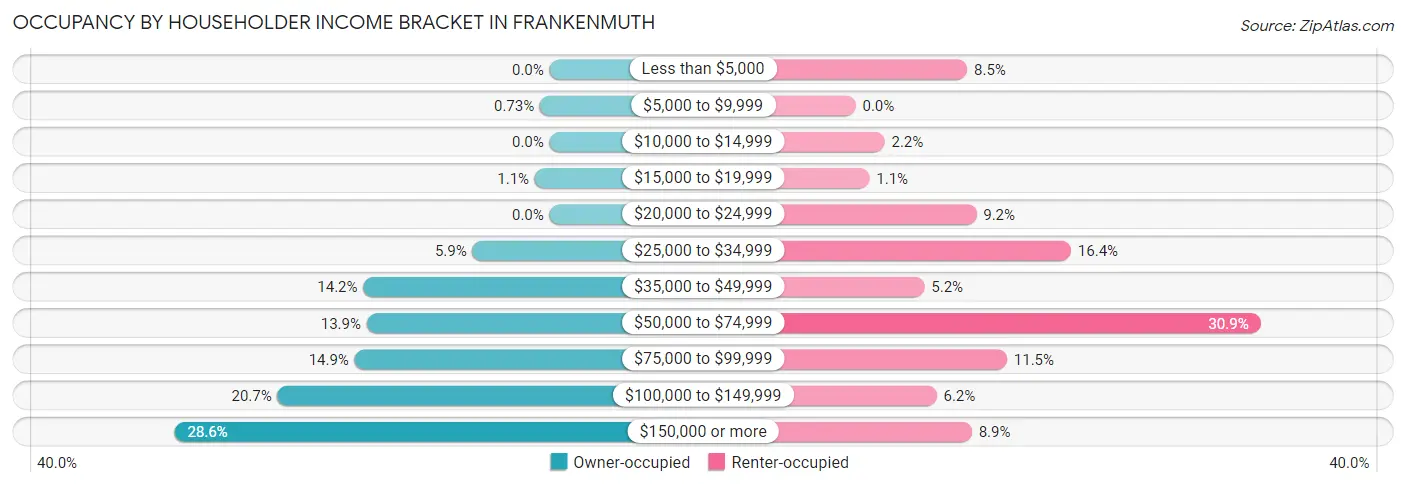
| Income Bracket | Owner-occupied | Renter-occupied |
| Less than $5,000 | 0 (0.0%) | 73 (8.5%) |
| $5,000 to $9,999 | 11 (0.7%) | 0 (0.0%) |
| $10,000 to $14,999 | 0 (0.0%) | 19 (2.2%) |
| $15,000 to $19,999 | 17 (1.1%) | 9 (1.1%) |
| $20,000 to $24,999 | 0 (0.0%) | 79 (9.2%) |
| $25,000 to $34,999 | 89 (5.9%) | 141 (16.4%) |
| $35,000 to $49,999 | 215 (14.2%) | 45 (5.2%) |
| $50,000 to $74,999 | 211 (13.9%) | 265 (30.8%) |
| $75,000 to $99,999 | 225 (14.8%) | 99 (11.5%) |
| $100,000 to $149,999 | 314 (20.7%) | 53 (6.2%) |
| $150,000 or more | 433 (28.6%) | 76 (8.8%) |
| Total | 1,515 (100.0%) | 859 (100.0%) |
Monthly Housing Cost Tiers in Frankenmuth
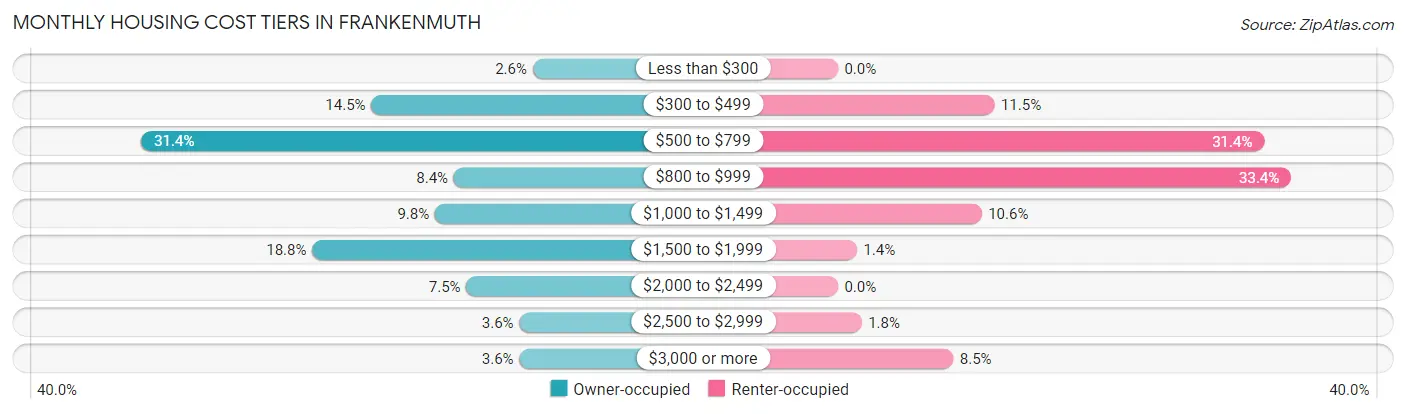
| Monthly Cost | Owner-occupied | Renter-occupied |
| Less than $300 | 39 (2.6%) | 0 (0.0%) |
| $300 to $499 | 219 (14.5%) | 99 (11.5%) |
| $500 to $799 | 476 (31.4%) | 270 (31.4%) |
| $800 to $999 | 127 (8.4%) | 287 (33.4%) |
| $1,000 to $1,499 | 148 (9.8%) | 91 (10.6%) |
| $1,500 to $1,999 | 285 (18.8%) | 12 (1.4%) |
| $2,000 to $2,499 | 113 (7.5%) | 0 (0.0%) |
| $2,500 to $2,999 | 54 (3.6%) | 15 (1.8%) |
| $3,000 or more | 54 (3.6%) | 73 (8.5%) |
| Total | 1,515 (100.0%) | 859 (100.0%) |
Physical Housing Characteristics in Frankenmuth
Housing Structures in Frankenmuth
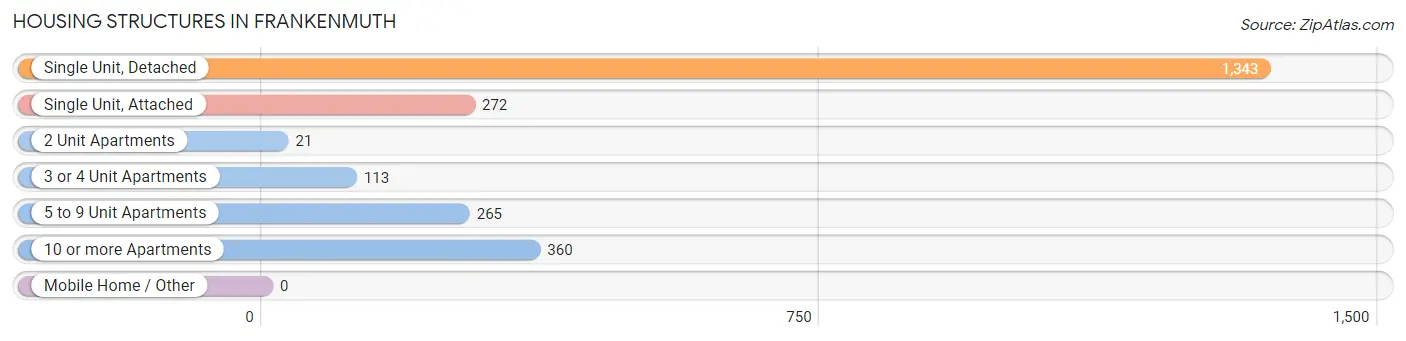
| Structure Type | # Housing Units | % Housing Units |
| Single Unit, Detached | 1,343 | 56.6% |
| Single Unit, Attached | 272 | 11.5% |
| 2 Unit Apartments | 21 | 0.9% |
| 3 or 4 Unit Apartments | 113 | 4.8% |
| 5 to 9 Unit Apartments | 265 | 11.2% |
| 10 or more Apartments | 360 | 15.2% |
| Mobile Home / Other | 0 | 0.0% |
| Total | 2,374 | 100.0% |
Housing Structures by Occupancy in Frankenmuth
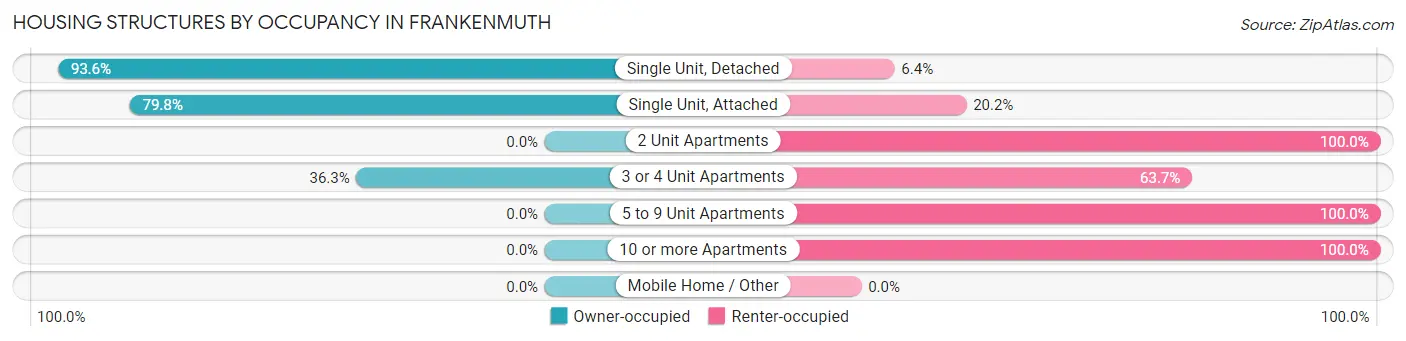
| Structure Type | Owner-occupied | Renter-occupied |
| Single Unit, Detached | 1,257 (93.6%) | 86 (6.4%) |
| Single Unit, Attached | 217 (79.8%) | 55 (20.2%) |
| 2 Unit Apartments | 0 (0.0%) | 21 (100.0%) |
| 3 or 4 Unit Apartments | 41 (36.3%) | 72 (63.7%) |
| 5 to 9 Unit Apartments | 0 (0.0%) | 265 (100.0%) |
| 10 or more Apartments | 0 (0.0%) | 360 (100.0%) |
| Mobile Home / Other | 0 (0.0%) | 0 (0.0%) |
| Total | 1,515 (63.8%) | 859 (36.2%) |
Housing Structures by Number of Rooms in Frankenmuth
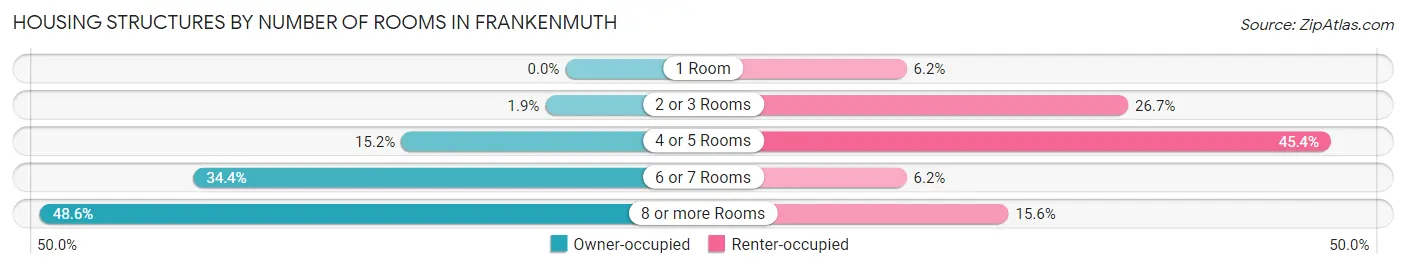
| Number of Rooms | Owner-occupied | Renter-occupied |
| 1 Room | 0 (0.0%) | 53 (6.2%) |
| 2 or 3 Rooms | 28 (1.8%) | 229 (26.7%) |
| 4 or 5 Rooms | 230 (15.2%) | 390 (45.4%) |
| 6 or 7 Rooms | 521 (34.4%) | 53 (6.2%) |
| 8 or more Rooms | 736 (48.6%) | 134 (15.6%) |
| Total | 1,515 (100.0%) | 859 (100.0%) |
Housing Structure by Heating Type in Frankenmuth
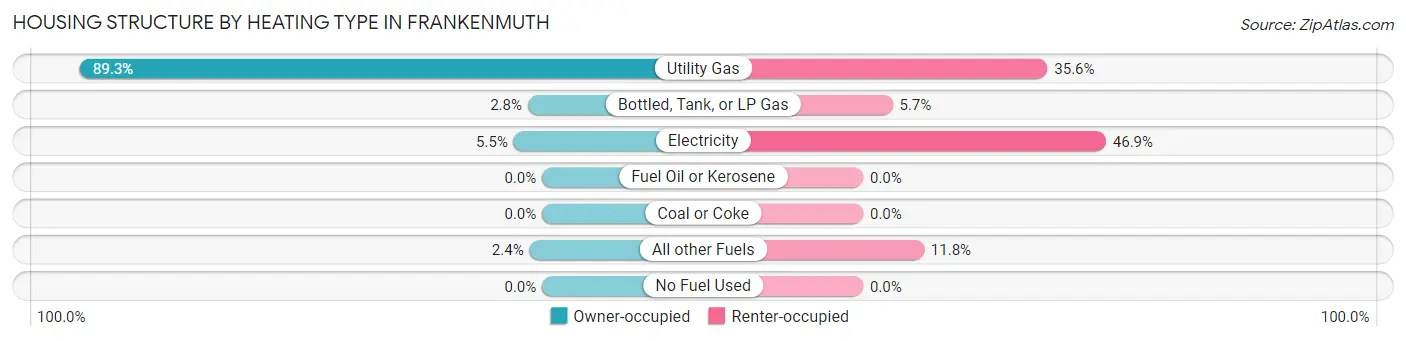
| Heating Type | Owner-occupied | Renter-occupied |
| Utility Gas | 1,353 (89.3%) | 306 (35.6%) |
| Bottled, Tank, or LP Gas | 42 (2.8%) | 49 (5.7%) |
| Electricity | 83 (5.5%) | 403 (46.9%) |
| Fuel Oil or Kerosene | 0 (0.0%) | 0 (0.0%) |
| Coal or Coke | 0 (0.0%) | 0 (0.0%) |
| All other Fuels | 37 (2.4%) | 101 (11.8%) |
| No Fuel Used | 0 (0.0%) | 0 (0.0%) |
| Total | 1,515 (100.0%) | 859 (100.0%) |
Household Vehicle Usage in Frankenmuth
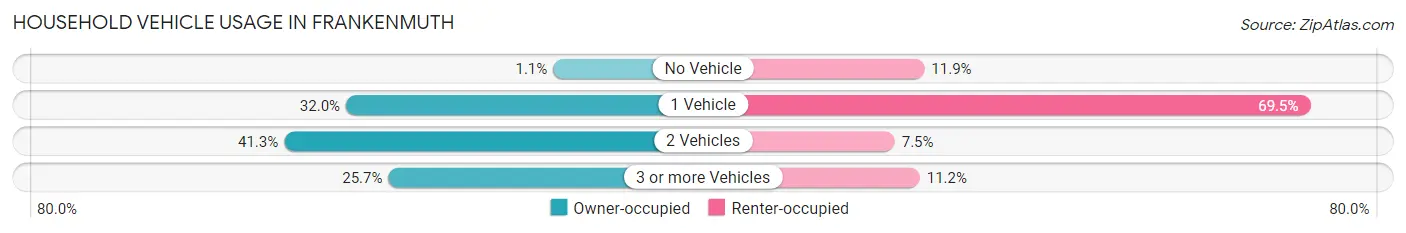
| Vehicles per Household | Owner-occupied | Renter-occupied |
| No Vehicle | 16 (1.1%) | 102 (11.9%) |
| 1 Vehicle | 485 (32.0%) | 597 (69.5%) |
| 2 Vehicles | 625 (41.2%) | 64 (7.4%) |
| 3 or more Vehicles | 389 (25.7%) | 96 (11.2%) |
| Total | 1,515 (100.0%) | 859 (100.0%) |
Real Estate & Mortgages in Frankenmuth
Real Estate and Mortgage Overview in Frankenmuth
| Characteristic | Without Mortgage | With Mortgage |
| Housing Units | 842 | 673 |
| Median Property Value | $228,100 | $270,300 |
| Median Household Income | $80,263 | $249 |
| Monthly Housing Costs | $568 | $54 |
| Real Estate Taxes | $2,720 | $43 |
Property Value by Mortgage Status in Frankenmuth
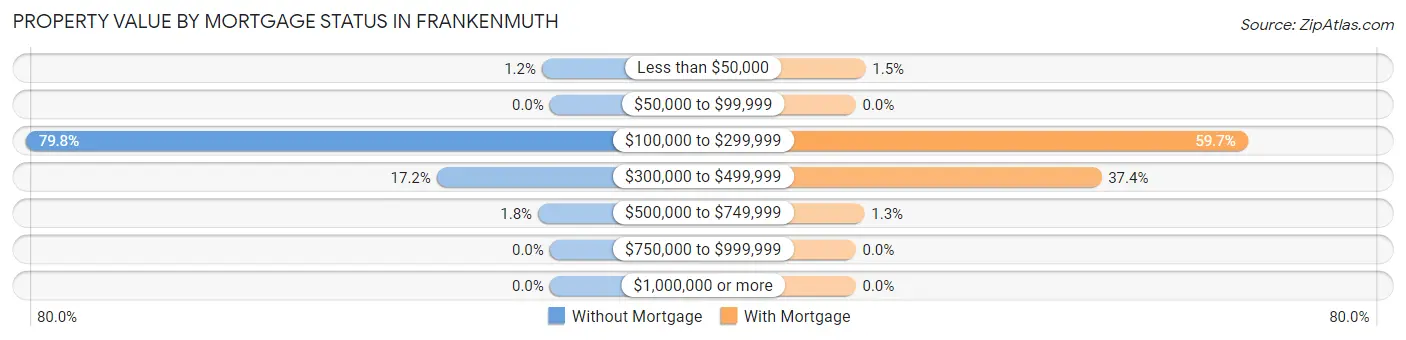
| Property Value | Without Mortgage | With Mortgage |
| Less than $50,000 | 10 (1.2%) | 10 (1.5%) |
| $50,000 to $99,999 | 0 (0.0%) | 0 (0.0%) |
| $100,000 to $299,999 | 672 (79.8%) | 402 (59.7%) |
| $300,000 to $499,999 | 145 (17.2%) | 252 (37.4%) |
| $500,000 to $749,999 | 15 (1.8%) | 9 (1.3%) |
| $750,000 to $999,999 | 0 (0.0%) | 0 (0.0%) |
| $1,000,000 or more | 0 (0.0%) | 0 (0.0%) |
| Total | 842 (100.0%) | 673 (100.0%) |
Household Income by Mortgage Status in Frankenmuth
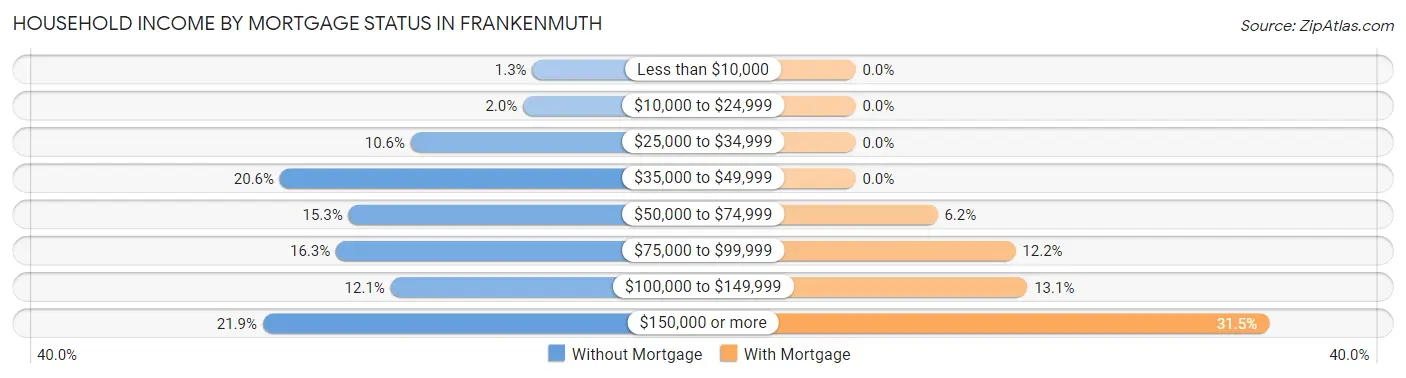
| Household Income | Without Mortgage | With Mortgage |
| Less than $10,000 | 11 (1.3%) | 0 (0.0%) |
| $10,000 to $24,999 | 17 (2.0%) | 0 (0.0%) |
| $25,000 to $34,999 | 89 (10.6%) | 0 (0.0%) |
| $35,000 to $49,999 | 173 (20.5%) | 0 (0.0%) |
| $50,000 to $74,999 | 129 (15.3%) | 42 (6.2%) |
| $75,000 to $99,999 | 137 (16.3%) | 82 (12.2%) |
| $100,000 to $149,999 | 102 (12.1%) | 88 (13.1%) |
| $150,000 or more | 184 (21.8%) | 212 (31.5%) |
| Total | 842 (100.0%) | 673 (100.0%) |
Property Value to Household Income Ratio in Frankenmuth
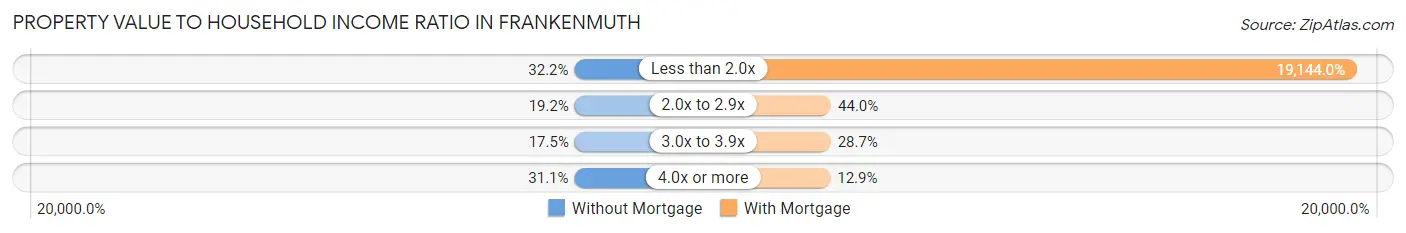
| Value-to-Income Ratio | Without Mortgage | With Mortgage |
| Less than 2.0x | 271 (32.2%) | 128,839 (19,144.0%) |
| 2.0x to 2.9x | 162 (19.2%) | 296 (44.0%) |
| 3.0x to 3.9x | 147 (17.5%) | 193 (28.7%) |
| 4.0x or more | 262 (31.1%) | 87 (12.9%) |
| Total | 842 (100.0%) | 673 (100.0%) |
Real Estate Taxes by Mortgage Status in Frankenmuth
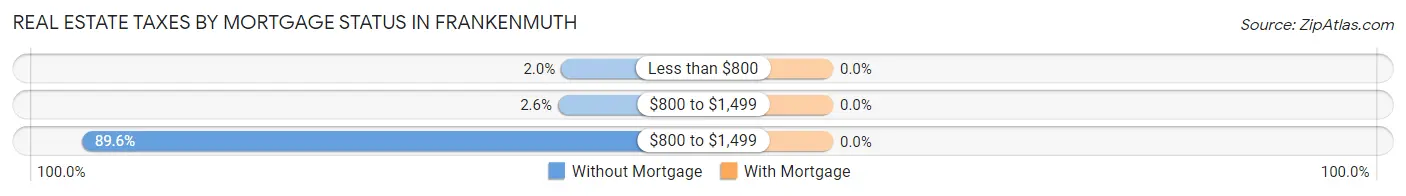
| Property Taxes | Without Mortgage | With Mortgage |
| Less than $800 | 17 (2.0%) | 0 (0.0%) |
| $800 to $1,499 | 22 (2.6%) | 0 (0.0%) |
| $800 to $1,499 | 754 (89.5%) | 0 (0.0%) |
| Total | 842 (100.0%) | 673 (100.0%) |
Health & Disability in Frankenmuth
Health Insurance Coverage by Age in Frankenmuth
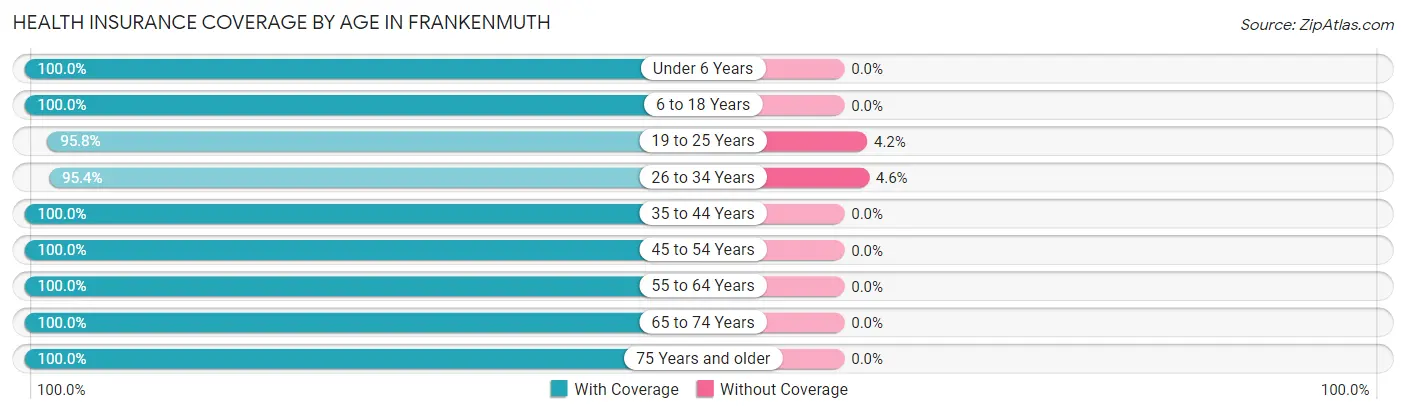
| Age Bracket | With Coverage | Without Coverage |
| Under 6 Years | 332 (100.0%) | 0 (0.0%) |
| 6 to 18 Years | 597 (100.0%) | 0 (0.0%) |
| 19 to 25 Years | 407 (95.8%) | 18 (4.2%) |
| 26 to 34 Years | 542 (95.4%) | 26 (4.6%) |
| 35 to 44 Years | 368 (100.0%) | 0 (0.0%) |
| 45 to 54 Years | 644 (100.0%) | 0 (0.0%) |
| 55 to 64 Years | 661 (100.0%) | 0 (0.0%) |
| 65 to 74 Years | 551 (100.0%) | 0 (0.0%) |
| 75 Years and older | 711 (100.0%) | 0 (0.0%) |
| Total | 4,813 (99.1%) | 44 (0.9%) |
Health Insurance Coverage by Citizenship Status in Frankenmuth
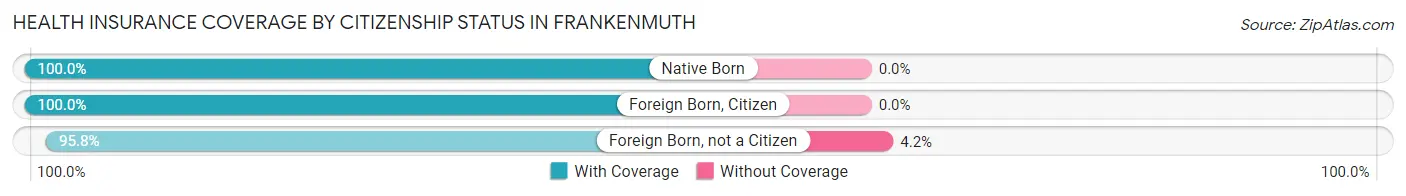
| Citizenship Status | With Coverage | Without Coverage |
| Native Born | 332 (100.0%) | 0 (0.0%) |
| Foreign Born, Citizen | 597 (100.0%) | 0 (0.0%) |
| Foreign Born, not a Citizen | 407 (95.8%) | 18 (4.2%) |
Health Insurance Coverage by Household Income in Frankenmuth
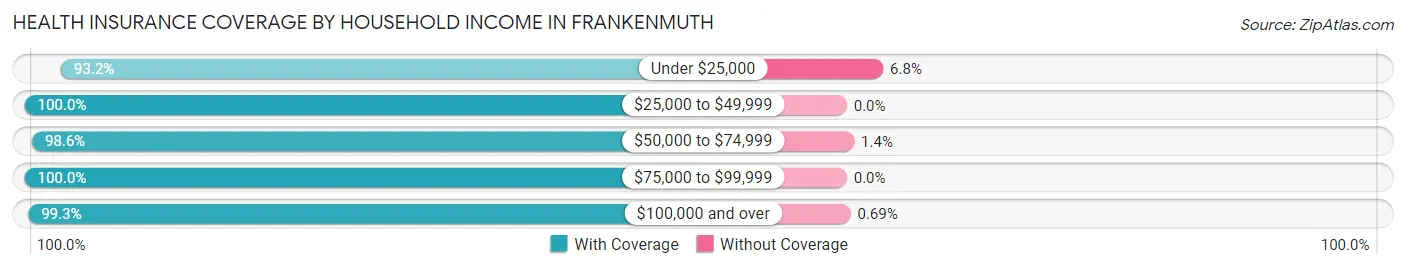
| Household Income | With Coverage | Without Coverage |
| Under $25,000 | 219 (93.2%) | 16 (6.8%) |
| $25,000 to $49,999 | 694 (100.0%) | 0 (0.0%) |
| $50,000 to $74,999 | 717 (98.6%) | 10 (1.4%) |
| $75,000 to $99,999 | 595 (100.0%) | 0 (0.0%) |
| $100,000 and over | 2,576 (99.3%) | 18 (0.7%) |
Public vs Private Health Insurance Coverage by Age in Frankenmuth
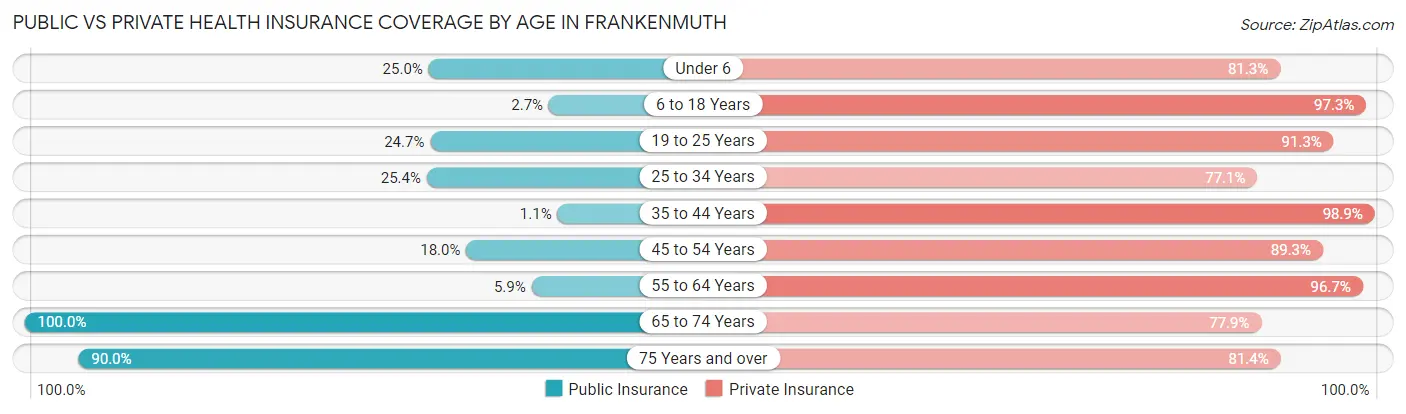
| Age Bracket | Public Insurance | Private Insurance |
| Under 6 | 83 (25.0%) | 270 (81.3%) |
| 6 to 18 Years | 16 (2.7%) | 581 (97.3%) |
| 19 to 25 Years | 105 (24.7%) | 388 (91.3%) |
| 25 to 34 Years | 144 (25.4%) | 438 (77.1%) |
| 35 to 44 Years | 4 (1.1%) | 364 (98.9%) |
| 45 to 54 Years | 116 (18.0%) | 575 (89.3%) |
| 55 to 64 Years | 39 (5.9%) | 639 (96.7%) |
| 65 to 74 Years | 551 (100.0%) | 429 (77.9%) |
| 75 Years and over | 640 (90.0%) | 579 (81.4%) |
| Total | 1,698 (35.0%) | 4,263 (87.8%) |
Disability Status by Sex by Age in Frankenmuth
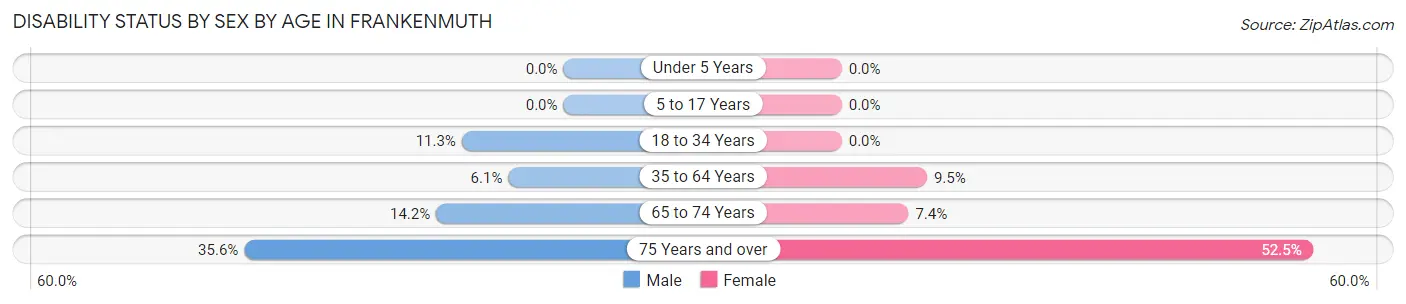
| Age Bracket | Male | Female |
| Under 5 Years | 0 (0.0%) | 0 (0.0%) |
| 5 to 17 Years | 0 (0.0%) | 0 (0.0%) |
| 18 to 34 Years | 60 (11.3%) | 0 (0.0%) |
| 35 to 64 Years | 51 (6.1%) | 80 (9.5%) |
| 65 to 74 Years | 40 (14.2%) | 20 (7.4%) |
| 75 Years and over | 91 (35.5%) | 239 (52.5%) |
Disability Class by Sex by Age in Frankenmuth
Disability Class: Hearing Difficulty
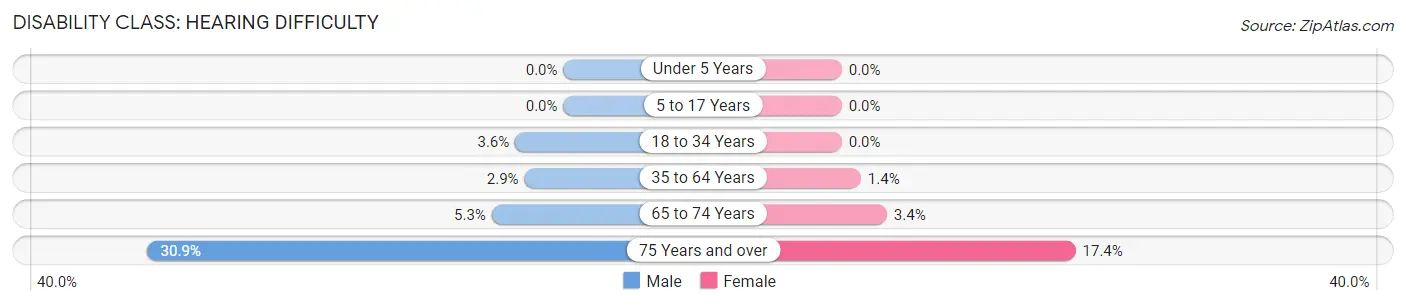
| Age Bracket | Male | Female |
| Under 5 Years | 0 (0.0%) | 0 (0.0%) |
| 5 to 17 Years | 0 (0.0%) | 0 (0.0%) |
| 18 to 34 Years | 19 (3.6%) | 0 (0.0%) |
| 35 to 64 Years | 24 (2.9%) | 12 (1.4%) |
| 65 to 74 Years | 15 (5.3%) | 9 (3.4%) |
| 75 Years and over | 79 (30.9%) | 79 (17.4%) |
Disability Class: Vision Difficulty
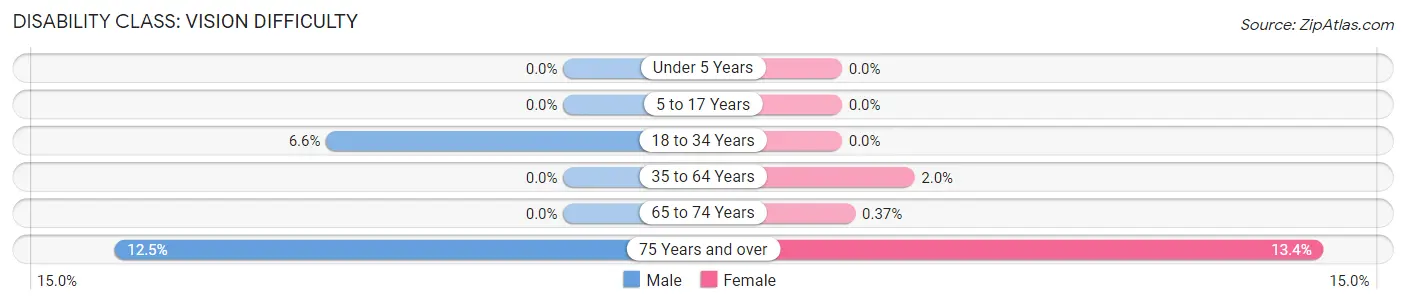
| Age Bracket | Male | Female |
| Under 5 Years | 0 (0.0%) | 0 (0.0%) |
| 5 to 17 Years | 0 (0.0%) | 0 (0.0%) |
| 18 to 34 Years | 35 (6.6%) | 0 (0.0%) |
| 35 to 64 Years | 0 (0.0%) | 17 (2.0%) |
| 65 to 74 Years | 0 (0.0%) | 1 (0.4%) |
| 75 Years and over | 32 (12.5%) | 61 (13.4%) |
Disability Class: Cognitive Difficulty
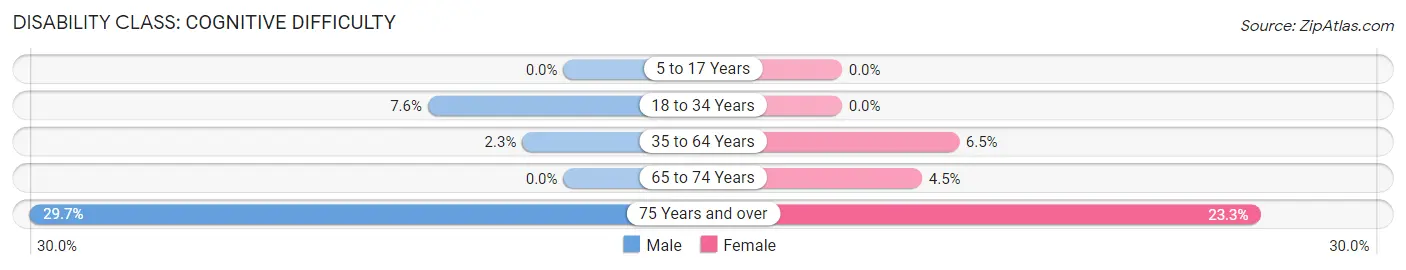
| Age Bracket | Male | Female |
| 5 to 17 Years | 0 (0.0%) | 0 (0.0%) |
| 18 to 34 Years | 40 (7.5%) | 0 (0.0%) |
| 35 to 64 Years | 19 (2.3%) | 55 (6.5%) |
| 65 to 74 Years | 0 (0.0%) | 12 (4.5%) |
| 75 Years and over | 76 (29.7%) | 106 (23.3%) |
Disability Class: Ambulatory Difficulty
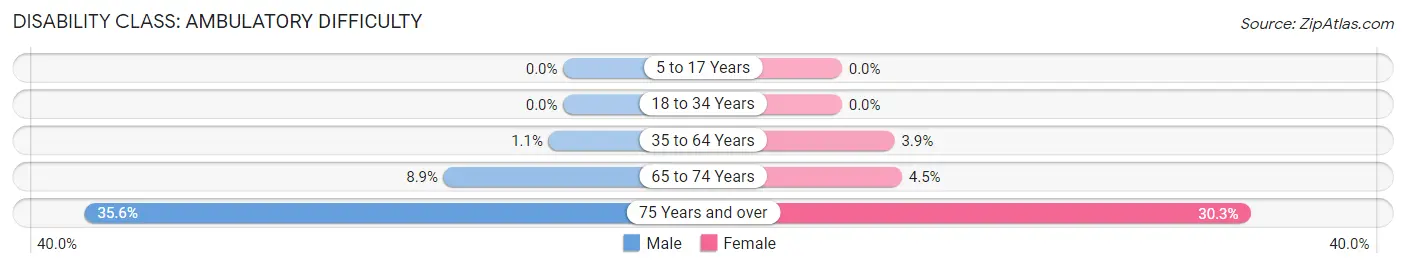
| Age Bracket | Male | Female |
| 5 to 17 Years | 0 (0.0%) | 0 (0.0%) |
| 18 to 34 Years | 0 (0.0%) | 0 (0.0%) |
| 35 to 64 Years | 9 (1.1%) | 33 (3.9%) |
| 65 to 74 Years | 25 (8.9%) | 12 (4.5%) |
| 75 Years and over | 91 (35.5%) | 138 (30.3%) |
Disability Class: Self-Care Difficulty
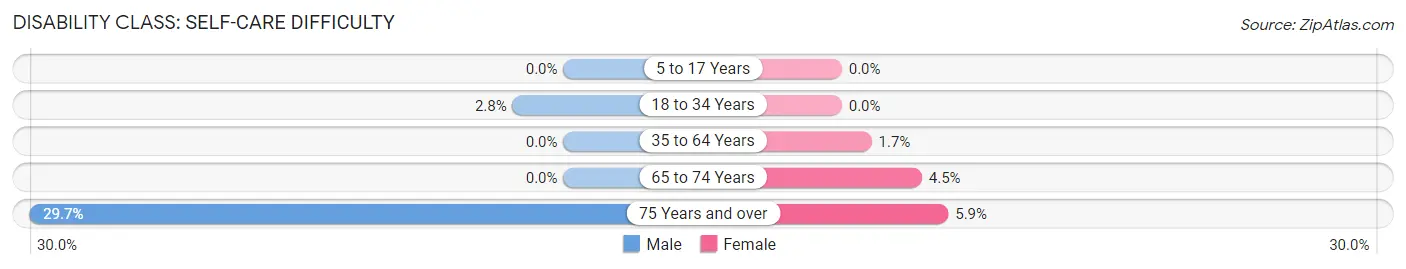
| Age Bracket | Male | Female |
| 5 to 17 Years | 0 (0.0%) | 0 (0.0%) |
| 18 to 34 Years | 15 (2.8%) | 0 (0.0%) |
| 35 to 64 Years | 0 (0.0%) | 14 (1.7%) |
| 65 to 74 Years | 0 (0.0%) | 12 (4.5%) |
| 75 Years and over | 76 (29.7%) | 27 (5.9%) |
Technology Access in Frankenmuth
Computing Device Access in Frankenmuth
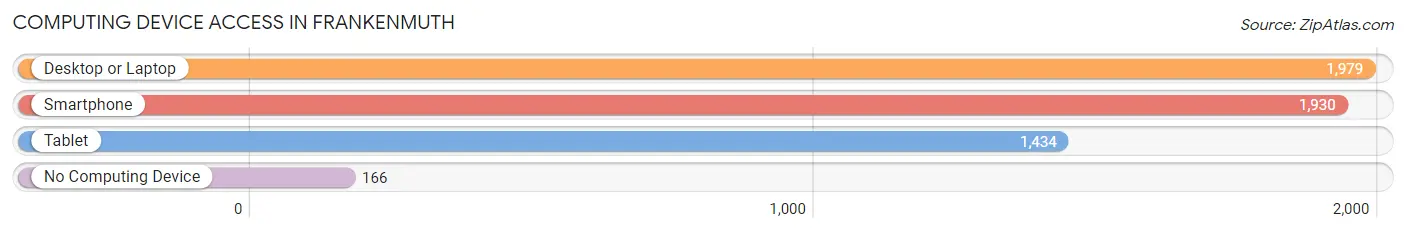
| Device Type | # Households | % Households |
| Desktop or Laptop | 1,979 | 83.4% |
| Smartphone | 1,930 | 81.3% |
| Tablet | 1,434 | 60.4% |
| No Computing Device | 166 | 7.0% |
| Total | 2,374 | 100.0% |
Internet Access in Frankenmuth
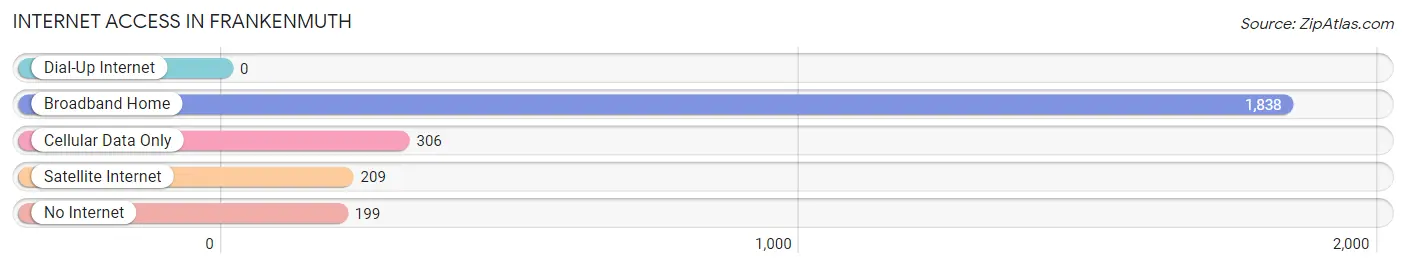
| Internet Type | # Households | % Households |
| Dial-Up Internet | 0 | 0.0% |
| Broadband Home | 1,838 | 77.4% |
| Cellular Data Only | 306 | 12.9% |
| Satellite Internet | 209 | 8.8% |
| No Internet | 199 | 8.4% |
| Total | 2,374 | 100.0% |
Frankenmuth Summary
Frankenmuth, Michigan is a small city located in Saginaw County, Michigan. It is situated on the Cass River, about 90 miles north of Detroit. The city is known for its Bavarian-style architecture, its annual Bavarian Festival, and its world-famous chicken dinners. It is also home to Bronner's Christmas Wonderland, the world's largest Christmas store.
History
Frankenmuth was founded in 1845 by a group of German Lutheran immigrants led by Pastor Ludwig Schaeffer. The group was looking for a place to settle and practice their faith without persecution. They chose the area because of its fertile soil and abundant natural resources. The name Frankenmuth is derived from two German words, Franken, meaning "friar" or "monk," and muth, meaning "courage."
The settlers built a log cabin church and named it St. Lorenz Lutheran Church. The church still stands today and is the oldest continuously operating Lutheran church in Michigan. The settlers also built a school, a store, and a brewery.
In the late 1800s, the city began to attract tourists who were drawn to its Bavarian-style architecture and its annual Bavarian Festival. The festival, which is held every summer, features traditional German music, dancing, and food.
Geography
Frankenmuth is located in Saginaw County, Michigan. It is situated on the Cass River, about 90 miles north of Detroit. The city covers an area of 4.2 square miles and has a population of 4,944 people, according to the 2010 census.
The city is located in the Saginaw Valley, which is part of the Great Lakes region. The climate is humid continental, with hot summers and cold winters. The average annual temperature is 48°F, and the average annual precipitation is 33 inches.
Economy
Frankenmuth's economy is largely based on tourism. The city is home to Bronner's Christmas Wonderland, the world's largest Christmas store, which attracts thousands of visitors each year. The city also hosts the annual Bavarian Festival, which features traditional German music, dancing, and food.
The city is also home to several manufacturing companies, including Frankenmuth Brewery, Frankenmuth Cheese Haus, and Frankenmuth Woolen Mill. The city also has a number of retail stores, restaurants, and hotels.
Demographics
According to the 2010 census, the population of Frankenmuth was 4,944. The racial makeup of the city was 95.3% White, 0.7% African American, 0.3% Native American, 0.7% Asian, 0.1% Pacific Islander, 1.2% from other races, and 1.7% from two or more races. Hispanic or Latino of any race were 3.2% of the population.
The median household income in Frankenmuth was $45,938, and the median family income was $54,844. The per capita income was $22,945. About 8.2% of families and 10.2% of the population were below the poverty line, including 14.2% of those under age 18 and 5.2% of those age 65 or over.
Common Questions
What is Per Capita Income in Frankenmuth?
Per Capita income in Frankenmuth is $49,056.
What is the Median Family Income in Frankenmuth?
Median Family Income in Frankenmuth is $121,005.
What is the Median Household income in Frankenmuth?
Median Household Income in Frankenmuth is $80,956.
What is Income or Wage Gap in Frankenmuth?
Income or Wage Gap in Frankenmuth is 60.7%.
Women in Frankenmuth earn 39.3 cents for every dollar earned by a man.
What is Inequality or Gini Index in Frankenmuth?
Inequality or Gini Index in Frankenmuth is 0.43.
What is the Total Population of Frankenmuth?
Total Population of Frankenmuth is 5,064.
What is the Total Male Population of Frankenmuth?
Total Male Population of Frankenmuth is 2,339.
What is the Total Female Population of Frankenmuth?
Total Female Population of Frankenmuth is 2,725.
What is the Ratio of Males per 100 Females in Frankenmuth?
There are 85.83 Males per 100 Females in Frankenmuth.
What is the Ratio of Females per 100 Males in Frankenmuth?
There are 116.50 Females per 100 Males in Frankenmuth.
What is the Median Population Age in Frankenmuth?
Median Population Age in Frankenmuth is 49.4 Years.
What is the Average Family Size in Frankenmuth
Average Family Size in Frankenmuth is 2.9 People.
What is the Average Household Size in Frankenmuth
Average Household Size in Frankenmuth is 2.0 People.
How Large is the Labor Force in Frankenmuth?
There are 2,463 People in the Labor Forcein in Frankenmuth.
What is the Percentage of People in the Labor Force in Frankenmuth?
58.4% of People are in the Labor Force in Frankenmuth.
What is the Unemployment Rate in Frankenmuth?
Unemployment Rate in Frankenmuth is 5.7%.