Rockford, MI Map & Demographics
Rockford Map
Rockford Overview
$51,801
PER CAPITA INCOME
$109,529
AVG FAMILY INCOME
$100,380
AVG HOUSEHOLD INCOME
25.2%
WAGE / INCOME GAP [ % ]
74.8¢/ $1
WAGE / INCOME GAP [ $ ]
0.45
INEQUALITY / GINI INDEX
6,144
TOTAL POPULATION
3,087
MALE POPULATION
3,057
FEMALE POPULATION
100.98
MALES / 100 FEMALES
99.03
FEMALES / 100 MALES
40.3
MEDIAN AGE
2.9
AVG FAMILY SIZE
2.4
AVG HOUSEHOLD SIZE
3,635
LABOR FORCE [ PEOPLE ]
75.5%
PERCENT IN LABOR FORCE
8.4%
UNEMPLOYMENT RATE
Rockford Zip Codes
Rockford Area Codes
Income in Rockford
Income Overview in Rockford
Per Capita Income in Rockford is $51,801, while median incomes of families and households are $109,529 and $100,380 respectively.
| Characteristic | Number | Measure |
| Per Capita Income | 6,144 | $51,801 |
| Median Family Income | 1,709 | $109,529 |
| Mean Family Income | 1,709 | $148,998 |
| Median Household Income | 2,601 | $100,380 |
| Mean Household Income | 2,601 | $122,247 |
| Income Deficit | 1,709 | $0 |
| Wage / Income Gap (%) | 6,144 | 25.16% |
| Wage / Income Gap ($) | 6,144 | 74.84¢ per $1 |
| Gini / Inequality Index | 6,144 | 0.45 |
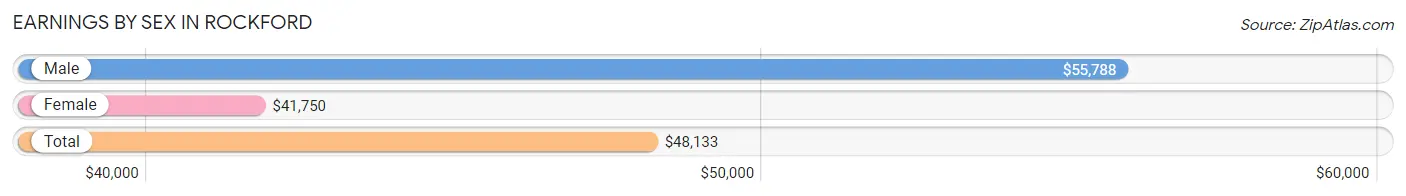
Earnings by Sex in Rockford
Average Earnings in Rockford are $48,133, $55,788 for men and $41,750 for women, a difference of 25.2%.
| Sex | Number | Average Earnings |
| Male | 2,026 (54.8%) | $55,788 |
| Female | 1,669 (45.2%) | $41,750 |
| Total | 3,695 (100.0%) | $48,133 |
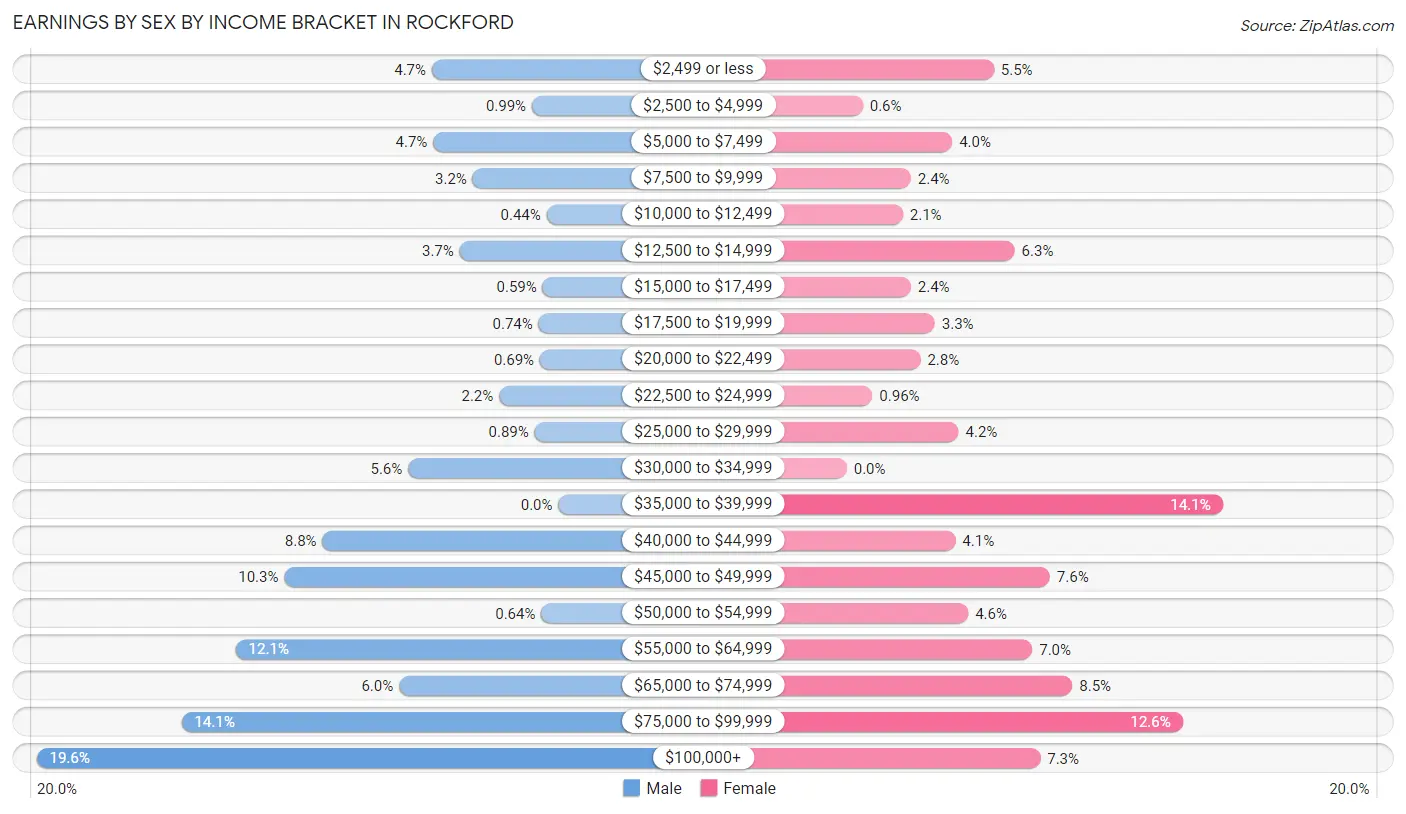
Earnings by Sex by Income Bracket in Rockford
The most common earnings brackets in Rockford are $100,000+ for men (396 | 19.6%) and $35,000 to $39,999 for women (235 | 14.1%).
| Income | Male | Female |
| $2,499 or less | 96 (4.7%) | 92 (5.5%) |
| $2,500 to $4,999 | 20 (1.0%) | 10 (0.6%) |
| $5,000 to $7,499 | 95 (4.7%) | 66 (4.0%) |
| $7,500 to $9,999 | 65 (3.2%) | 40 (2.4%) |
| $10,000 to $12,499 | 9 (0.4%) | 35 (2.1%) |
| $12,500 to $14,999 | 75 (3.7%) | 105 (6.3%) |
| $15,000 to $17,499 | 12 (0.6%) | 40 (2.4%) |
| $17,500 to $19,999 | 15 (0.7%) | 55 (3.3%) |
| $20,000 to $22,499 | 14 (0.7%) | 46 (2.8%) |
| $22,500 to $24,999 | 45 (2.2%) | 16 (1.0%) |
| $25,000 to $29,999 | 18 (0.9%) | 70 (4.2%) |
| $30,000 to $34,999 | 114 (5.6%) | 0 (0.0%) |
| $35,000 to $39,999 | 0 (0.0%) | 235 (14.1%) |
| $40,000 to $44,999 | 179 (8.8%) | 68 (4.1%) |
| $45,000 to $49,999 | 208 (10.3%) | 127 (7.6%) |
| $50,000 to $54,999 | 13 (0.6%) | 76 (4.5%) |
| $55,000 to $64,999 | 245 (12.1%) | 116 (7.0%) |
| $65,000 to $74,999 | 121 (6.0%) | 141 (8.5%) |
| $75,000 to $99,999 | 286 (14.1%) | 210 (12.6%) |
| $100,000+ | 396 (19.6%) | 121 (7.2%) |
| Total | 2,026 (100.0%) | 1,669 (100.0%) |
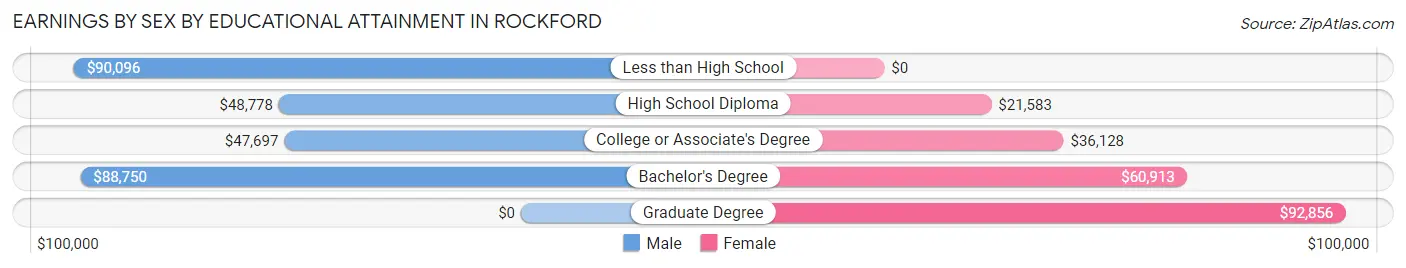
Earnings by Sex by Educational Attainment in Rockford
Average earnings in Rockford are $61,311 for men and $44,563 for women, a difference of 27.3%. Men with an educational attainment of less than high school enjoy the highest average annual earnings of $90,096, while those with college or associate's degree education earn the least with $47,697. Women with an educational attainment of graduate degree earn the most with the average annual earnings of $92,856, while those with high school diploma education have the smallest earnings of $21,583.
| Educational Attainment | Male Income | Female Income |
| Less than High School | $90,096 | $0 |
| High School Diploma | $48,778 | $21,583 |
| College or Associate's Degree | $47,697 | $36,128 |
| Bachelor's Degree | $88,750 | $60,913 |
| Graduate Degree | - | - |
| Total | $61,311 | $44,563 |
Family Income in Rockford
Family Income Brackets in Rockford
According to the Rockford family income data, there are 602 families falling into the $100,000 to $149,999 income range, which is the most common income bracket and makes up 35.2% of all families. Conversely, the $15,000 to $24,999 income bracket is the least frequent group with only 15 families (0.9%) belonging to this category.
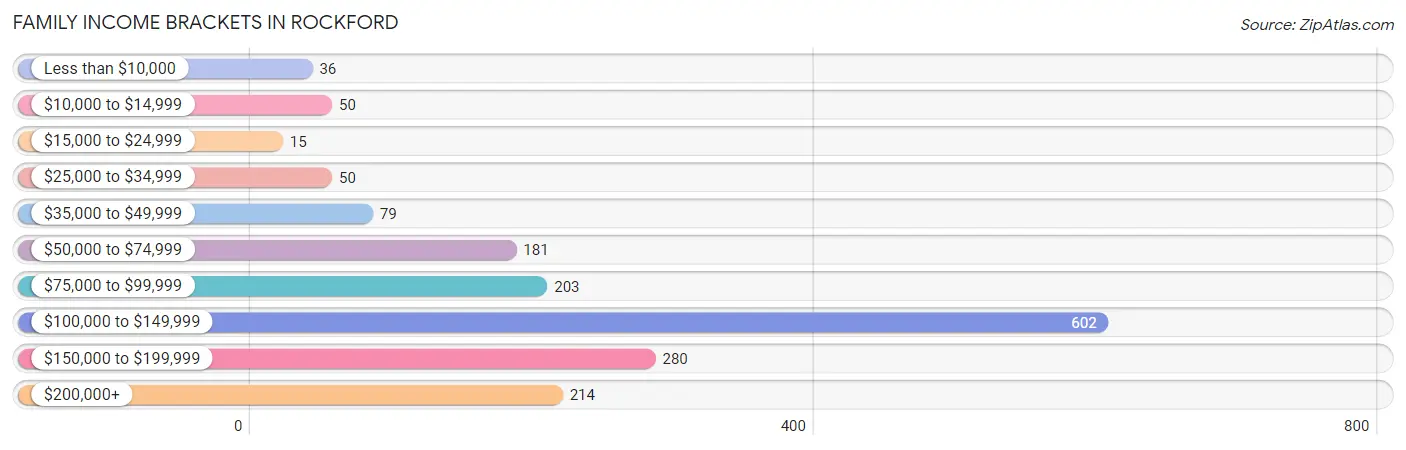
| Income Bracket | # Families | % Families |
| Less than $10,000 | 36 | 2.1% |
| $10,000 to $14,999 | 50 | 2.9% |
| $15,000 to $24,999 | 15 | 0.9% |
| $25,000 to $34,999 | 50 | 2.9% |
| $35,000 to $49,999 | 79 | 4.6% |
| $50,000 to $74,999 | 181 | 10.6% |
| $75,000 to $99,999 | 203 | 11.9% |
| $100,000 to $149,999 | 602 | 35.2% |
| $150,000 to $199,999 | 280 | 16.4% |
| $200,000+ | 214 | 12.5% |
Family Income by Famaliy Size in Rockford
5-person families (136 | 8.0%) account for the highest median family income in Rockford with $191,932 per family, while 2-person families (832 | 48.7%) have the highest median income of $54,354 per family member.
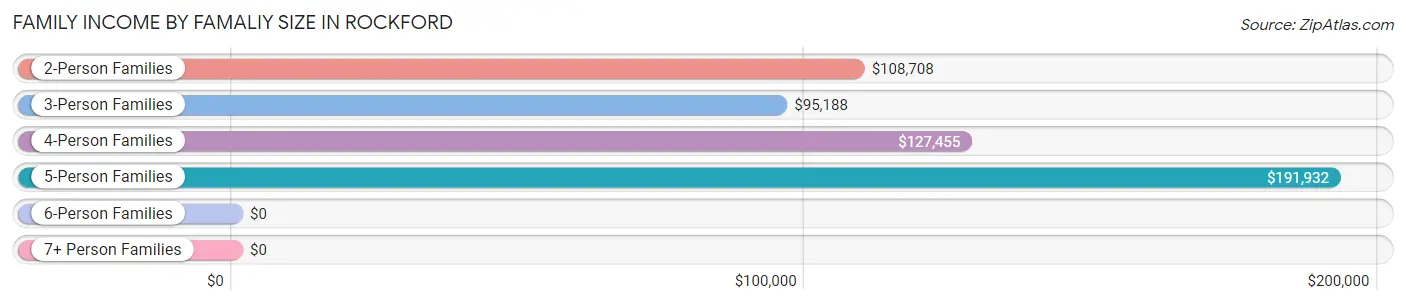
| Income Bracket | # Families | Median Income |
| 2-Person Families | 832 (48.7%) | $108,708 |
| 3-Person Families | 286 (16.7%) | $95,188 |
| 4-Person Families | 455 (26.6%) | $127,455 |
| 5-Person Families | 136 (8.0%) | $191,932 |
| 6-Person Families | 0 (0.0%) | $0 |
| 7+ Person Families | 0 (0.0%) | $0 |
| Total | 1,709 (100.0%) | $109,529 |
Family Income by Number of Earners in Rockford
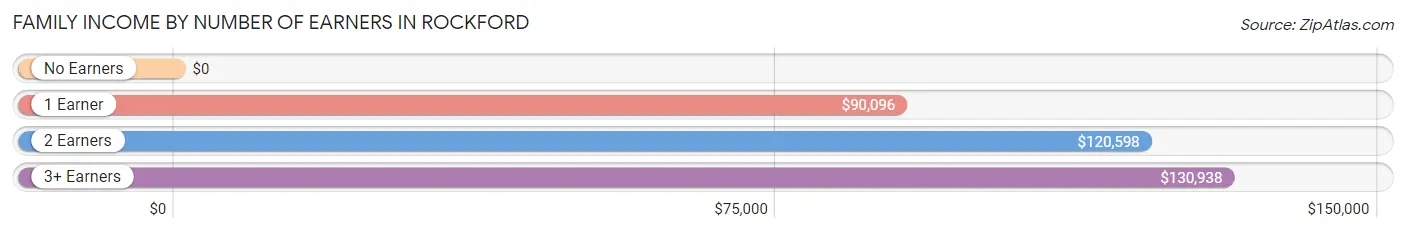
| Number of Earners | # Families | Median Income |
| No Earners | 165 (9.7%) | $0 |
| 1 Earner | 380 (22.2%) | $90,096 |
| 2 Earners | 903 (52.8%) | $120,598 |
| 3+ Earners | 261 (15.3%) | $130,938 |
| Total | 1,709 (100.0%) | $109,529 |
Household Income in Rockford
Household Income Brackets in Rockford
With 645 households falling in the category, the $100,000 to $149,999 income range is the most frequent in Rockford, accounting for 24.8% of all households. In contrast, only 70 households (2.7%) fall into the less than $10,000 income bracket, making it the least populous group.
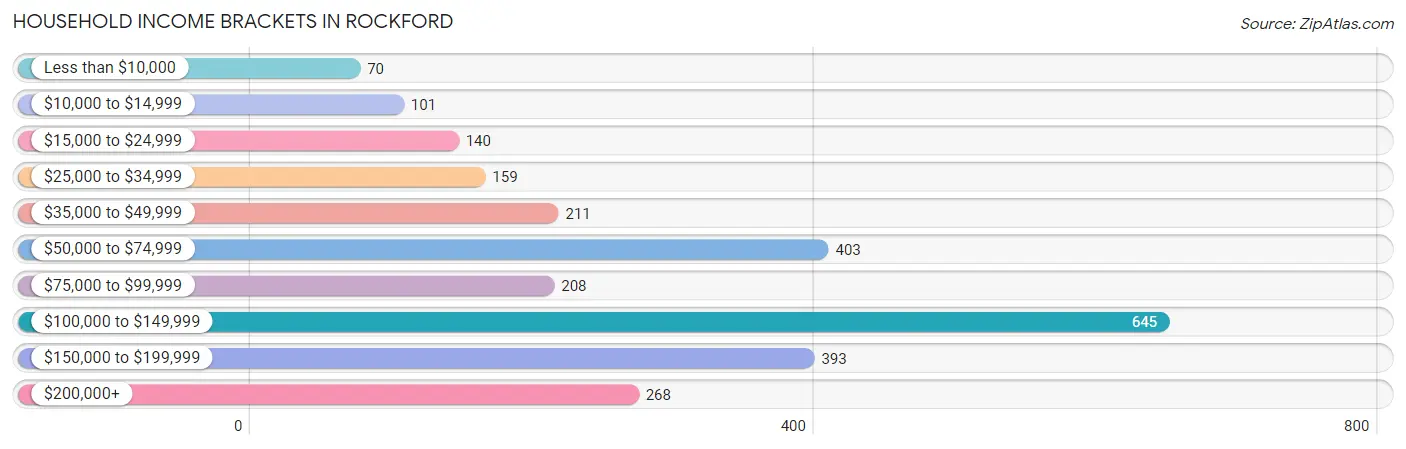
| Income Bracket | # Households | % Households |
| Less than $10,000 | 70 | 2.7% |
| $10,000 to $14,999 | 101 | 3.9% |
| $15,000 to $24,999 | 140 | 5.4% |
| $25,000 to $34,999 | 159 | 6.1% |
| $35,000 to $49,999 | 211 | 8.1% |
| $50,000 to $74,999 | 403 | 15.5% |
| $75,000 to $99,999 | 208 | 8.0% |
| $100,000 to $149,999 | 645 | 24.8% |
| $150,000 to $199,999 | 393 | 15.1% |
| $200,000+ | 268 | 10.3% |
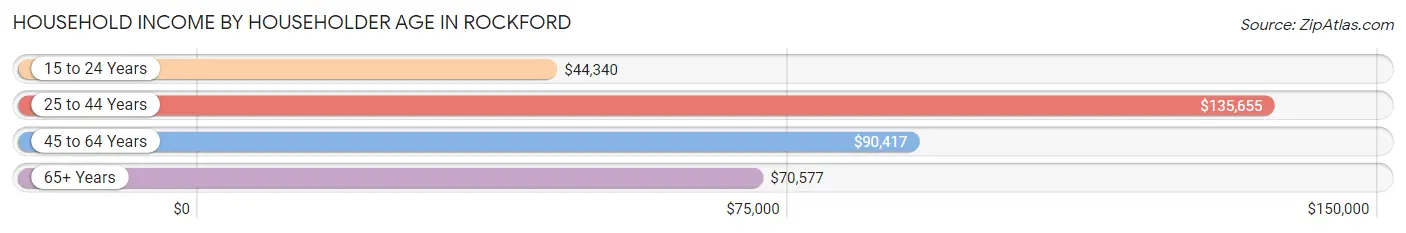
Household Income by Householder Age in Rockford
The median household income in Rockford is $100,380, with the highest median household income of $135,655 found in the 25 to 44 years age bracket for the primary householder. A total of 869 households (33.4%) fall into this category. Meanwhile, the 15 to 24 years age bracket for the primary householder has the lowest median household income of $44,340, with 131 households (5.0%) in this group.
| Income Bracket | # Households | Median Income |
| 15 to 24 Years | 131 (5.0%) | $44,340 |
| 25 to 44 Years | 869 (33.4%) | $135,655 |
| 45 to 64 Years | 903 (34.7%) | $90,417 |
| 65+ Years | 698 (26.8%) | $70,577 |
| Total | 2,601 (100.0%) | $100,380 |
Poverty in Rockford
Income Below Poverty by Sex and Age in Rockford
With 5.7% poverty level for males and 6.8% for females among the residents of Rockford, 12 to 14 year old males and 5 year old females are the most vulnerable to poverty, with 48 males (44.9%) and 22 females (36.7%) in their respective age groups living below the poverty level.
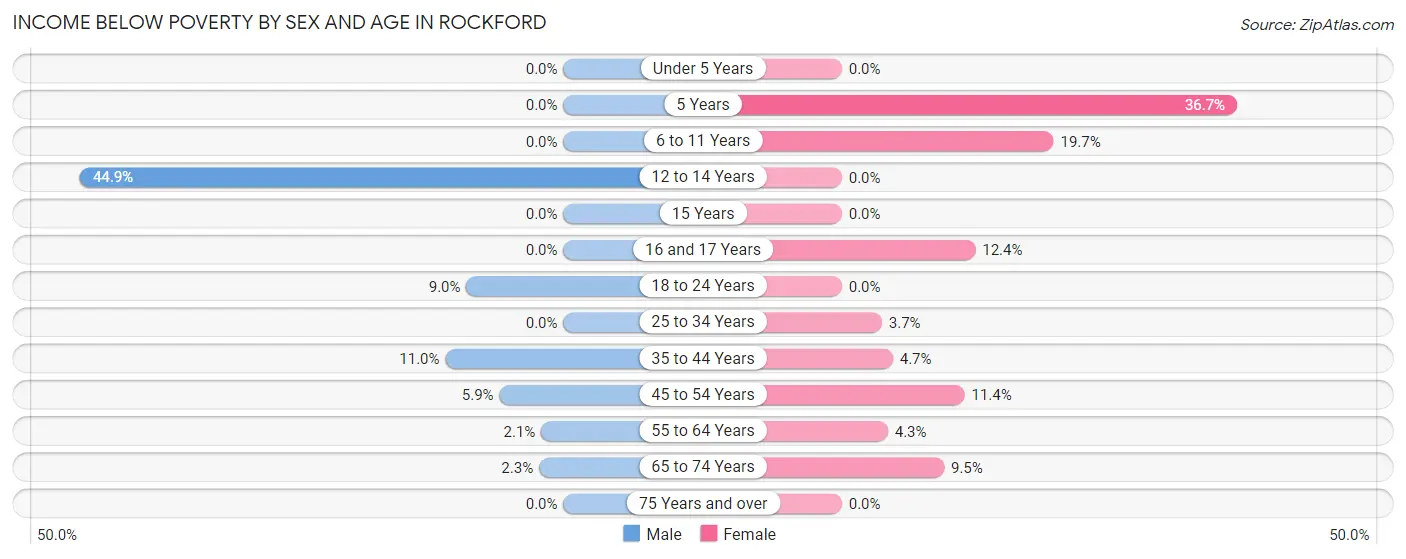
| Age Bracket | Male | Female |
| Under 5 Years | 0 (0.0%) | 0 (0.0%) |
| 5 Years | 0 (0.0%) | 22 (36.7%) |
| 6 to 11 Years | 0 (0.0%) | 34 (19.7%) |
| 12 to 14 Years | 48 (44.9%) | 0 (0.0%) |
| 15 Years | 0 (0.0%) | 0 (0.0%) |
| 16 and 17 Years | 0 (0.0%) | 14 (12.4%) |
| 18 to 24 Years | 28 (9.0%) | 0 (0.0%) |
| 25 to 34 Years | 0 (0.0%) | 13 (3.7%) |
| 35 to 44 Years | 61 (11.0%) | 21 (4.7%) |
| 45 to 54 Years | 21 (5.9%) | 50 (11.4%) |
| 55 to 64 Years | 11 (2.1%) | 15 (4.3%) |
| 65 to 74 Years | 6 (2.3%) | 37 (9.5%) |
| 75 Years and over | 0 (0.0%) | 0 (0.0%) |
| Total | 175 (5.7%) | 206 (6.8%) |
Income Above Poverty by Sex and Age in Rockford
According to the poverty statistics in Rockford, males aged under 5 years and females aged under 5 years are the age groups that are most secure financially, with 100.0% of males and 100.0% of females in these age groups living above the poverty line.
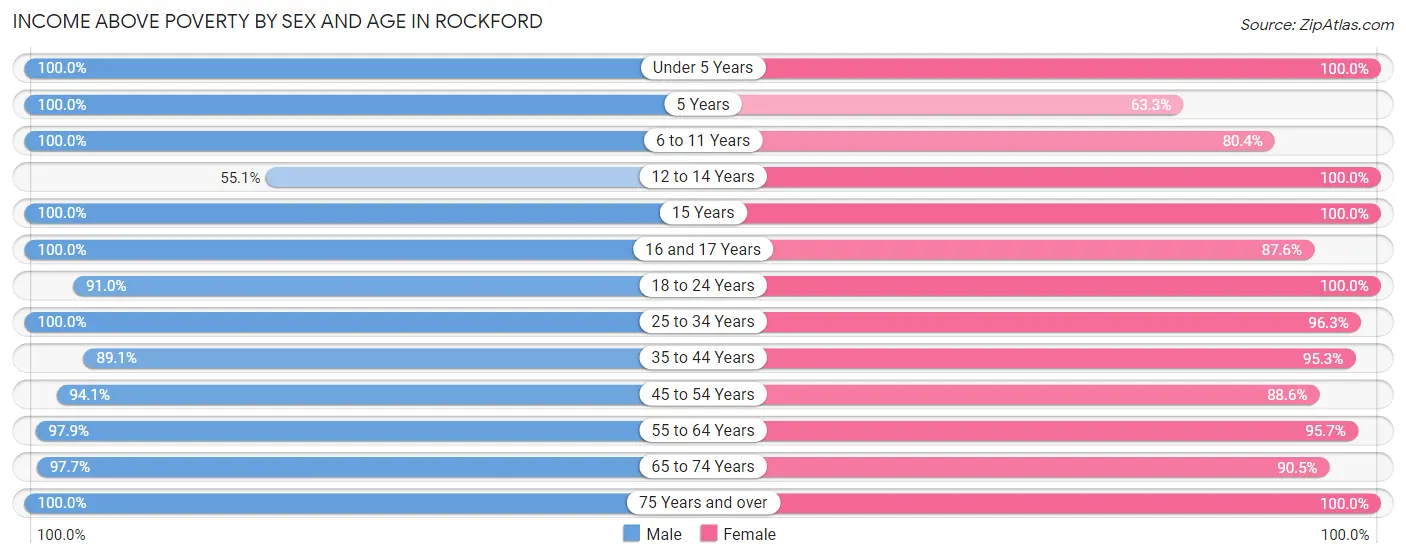
| Age Bracket | Male | Female |
| Under 5 Years | 167 (100.0%) | 203 (100.0%) |
| 5 Years | 31 (100.0%) | 38 (63.3%) |
| 6 to 11 Years | 332 (100.0%) | 139 (80.3%) |
| 12 to 14 Years | 59 (55.1%) | 151 (100.0%) |
| 15 Years | 37 (100.0%) | 68 (100.0%) |
| 16 and 17 Years | 21 (100.0%) | 99 (87.6%) |
| 18 to 24 Years | 283 (91.0%) | 141 (100.0%) |
| 25 to 34 Years | 313 (100.0%) | 336 (96.3%) |
| 35 to 44 Years | 496 (89.0%) | 423 (95.3%) |
| 45 to 54 Years | 333 (94.1%) | 389 (88.6%) |
| 55 to 64 Years | 522 (97.9%) | 336 (95.7%) |
| 65 to 74 Years | 260 (97.7%) | 353 (90.5%) |
| 75 Years and over | 58 (100.0%) | 161 (100.0%) |
| Total | 2,912 (94.3%) | 2,837 (93.2%) |
Income Below Poverty Among Married-Couple Families in Rockford
The poverty statistics for married-couple families in Rockford show that 2.1% or 29 of the total 1,376 families live below the poverty line. Families with 1 or 2 children have the highest poverty rate of 3.0%, comprising of 14 families. On the other hand, families with 3 or 4 children have the lowest poverty rate of 0.0%, which includes 0 families.
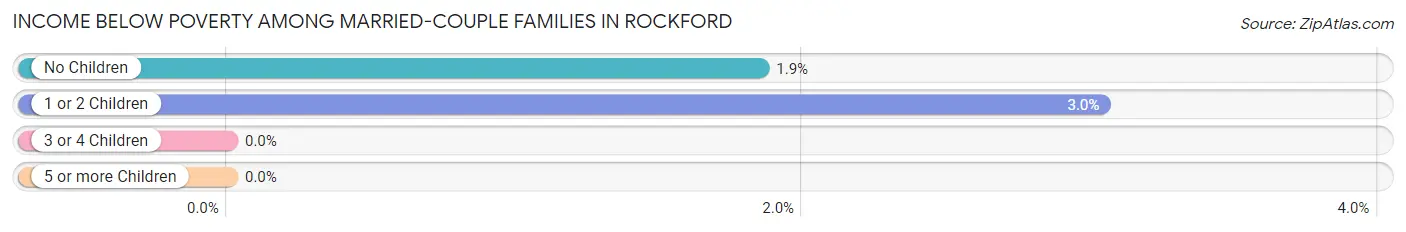
| Children | Above Poverty | Below Poverty |
| No Children | 797 (98.2%) | 15 (1.8%) |
| 1 or 2 Children | 446 (97.0%) | 14 (3.0%) |
| 3 or 4 Children | 104 (100.0%) | 0 (0.0%) |
| 5 or more Children | 0 (0.0%) | 0 (0.0%) |
| Total | 1,347 (97.9%) | 29 (2.1%) |
Income Below Poverty Among Single-Parent Households in Rockford
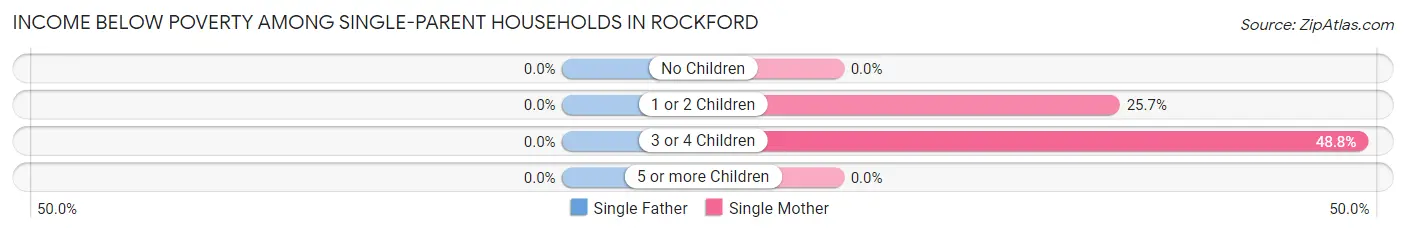
| Children | Single Father | Single Mother |
| No Children | 0 (0.0%) | 0 (0.0%) |
| 1 or 2 Children | 0 (0.0%) | 36 (25.7%) |
| 3 or 4 Children | 0 (0.0%) | 21 (48.8%) |
| 5 or more Children | 0 (0.0%) | 0 (0.0%) |
| Total | 0 (0.0%) | 57 (22.2%) |
Income Below Poverty Among Married-Couple vs Single-Parent Households in Rockford
The poverty data for Rockford shows that 29 of the married-couple family households (2.1%) and 57 of the single-parent households (17.1%) are living below the poverty level. Within the married-couple family households, those with 1 or 2 children have the highest poverty rate, with 14 households (3.0%) falling below the poverty line. Among the single-parent households, those with 3 or 4 children have the highest poverty rate, with 21 household (38.2%) living below poverty.
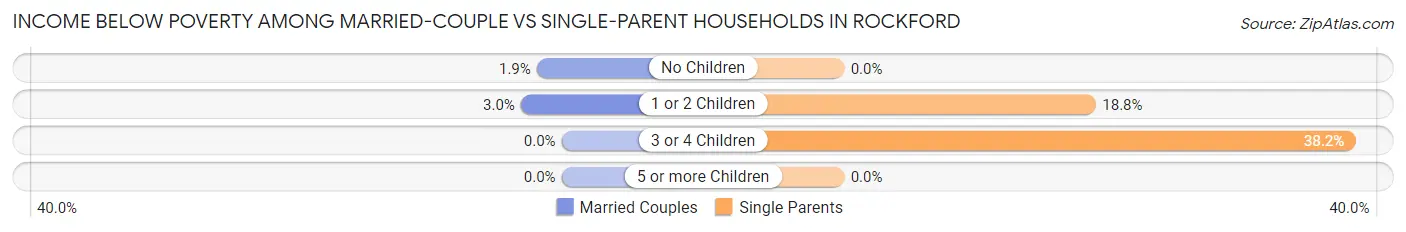
| Children | Married-Couple Families | Single-Parent Households |
| No Children | 15 (1.8%) | 0 (0.0%) |
| 1 or 2 Children | 14 (3.0%) | 36 (18.8%) |
| 3 or 4 Children | 0 (0.0%) | 21 (38.2%) |
| 5 or more Children | 0 (0.0%) | 0 (0.0%) |
| Total | 29 (2.1%) | 57 (17.1%) |
Race in Rockford
The most populous races in Rockford are White / Caucasian (5,659 | 92.1%), Two or more Races (312 | 5.1%), and Hispanic or Latino (242 | 3.9%).
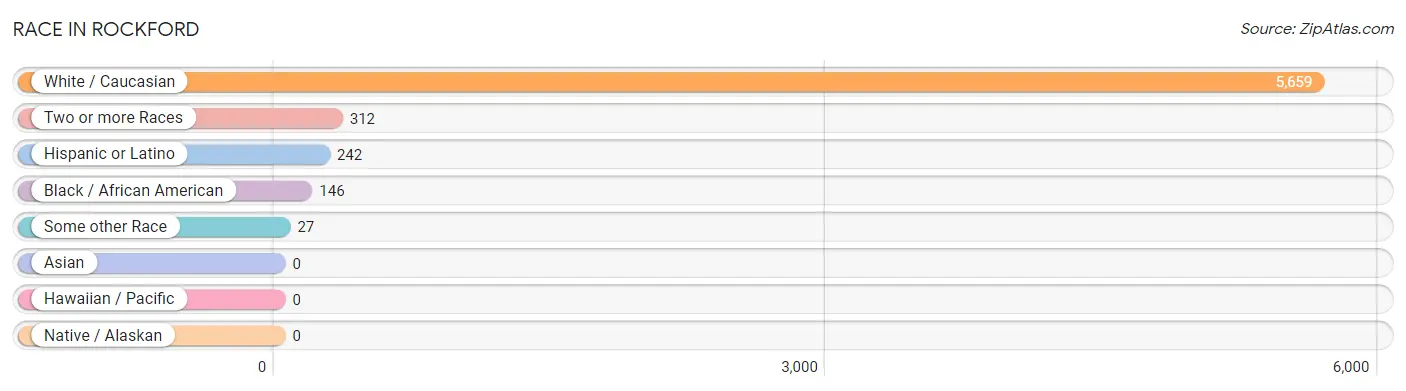
| Race | # Population | % Population |
| Asian | 0 | 0.0% |
| Black / African American | 146 | 2.4% |
| Hawaiian / Pacific | 0 | 0.0% |
| Hispanic or Latino | 242 | 3.9% |
| Native / Alaskan | 0 | 0.0% |
| White / Caucasian | 5,659 | 92.1% |
| Two or more Races | 312 | 5.1% |
| Some other Race | 27 | 0.4% |
| Total | 6,144 | 100.0% |
Ancestry in Rockford
The most populous ancestries reported in Rockford are German (1,324 | 21.5%), Dutch (872 | 14.2%), Polish (812 | 13.2%), Irish (735 | 12.0%), and English (644 | 10.5%), together accounting for 71.4% of all Rockford residents.
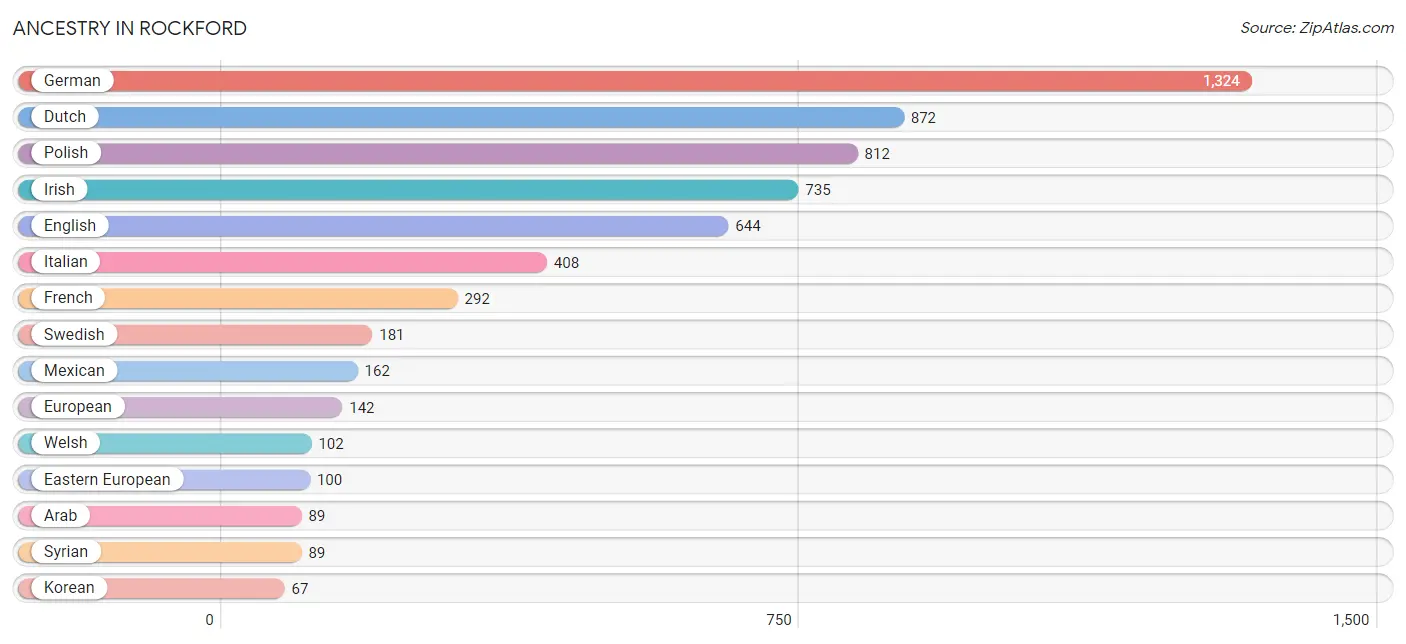
| Ancestry | # Population | % Population |
| American | 66 | 1.1% |
| Arab | 89 | 1.5% |
| Austrian | 27 | 0.4% |
| British | 41 | 0.7% |
| Cherokee | 4 | 0.1% |
| Croatian | 22 | 0.4% |
| Cuban | 55 | 0.9% |
| Czech | 32 | 0.5% |
| Czechoslovakian | 8 | 0.1% |
| Danish | 35 | 0.6% |
| Dutch | 872 | 14.2% |
| Eastern European | 100 | 1.6% |
| English | 644 | 10.5% |
| European | 142 | 2.3% |
| Finnish | 37 | 0.6% |
| French | 292 | 4.8% |
| German | 1,324 | 21.5% |
| Hungarian | 9 | 0.2% |
| Irish | 735 | 12.0% |
| Italian | 408 | 6.6% |
| Jamaican | 10 | 0.2% |
| Korean | 67 | 1.1% |
| Lithuanian | 34 | 0.5% |
| Mexican | 162 | 2.6% |
| Polish | 812 | 13.2% |
| Russian | 52 | 0.9% |
| Scandinavian | 14 | 0.2% |
| Scotch-Irish | 18 | 0.3% |
| Scottish | 36 | 0.6% |
| Slovak | 14 | 0.2% |
| Spaniard | 25 | 0.4% |
| Swedish | 181 | 2.9% |
| Swiss | 16 | 0.3% |
| Syrian | 89 | 1.5% |
| Ukrainian | 28 | 0.5% |
| Welsh | 102 | 1.7% | View All 36 Rows |
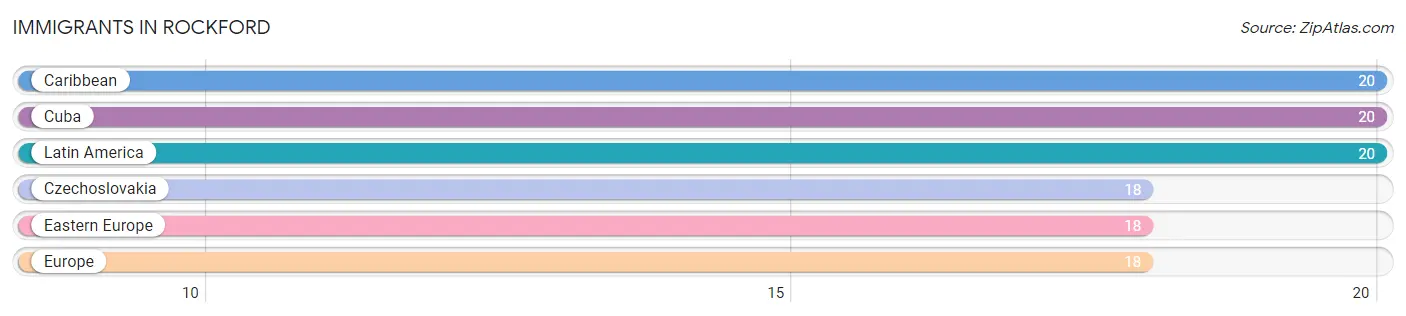
Immigrants in Rockford
The most numerous immigrant groups reported in Rockford came from Caribbean (20 | 0.3%), Cuba (20 | 0.3%), Latin America (20 | 0.3%), Czechoslovakia (18 | 0.3%), and Eastern Europe (18 | 0.3%), together accounting for 1.6% of all Rockford residents.
| Immigration Origin | # Population | % Population |
| Caribbean | 20 | 0.3% |
| Cuba | 20 | 0.3% |
| Czechoslovakia | 18 | 0.3% |
| Eastern Europe | 18 | 0.3% |
| Europe | 18 | 0.3% |
| Latin America | 20 | 0.3% | View All 6 Rows |
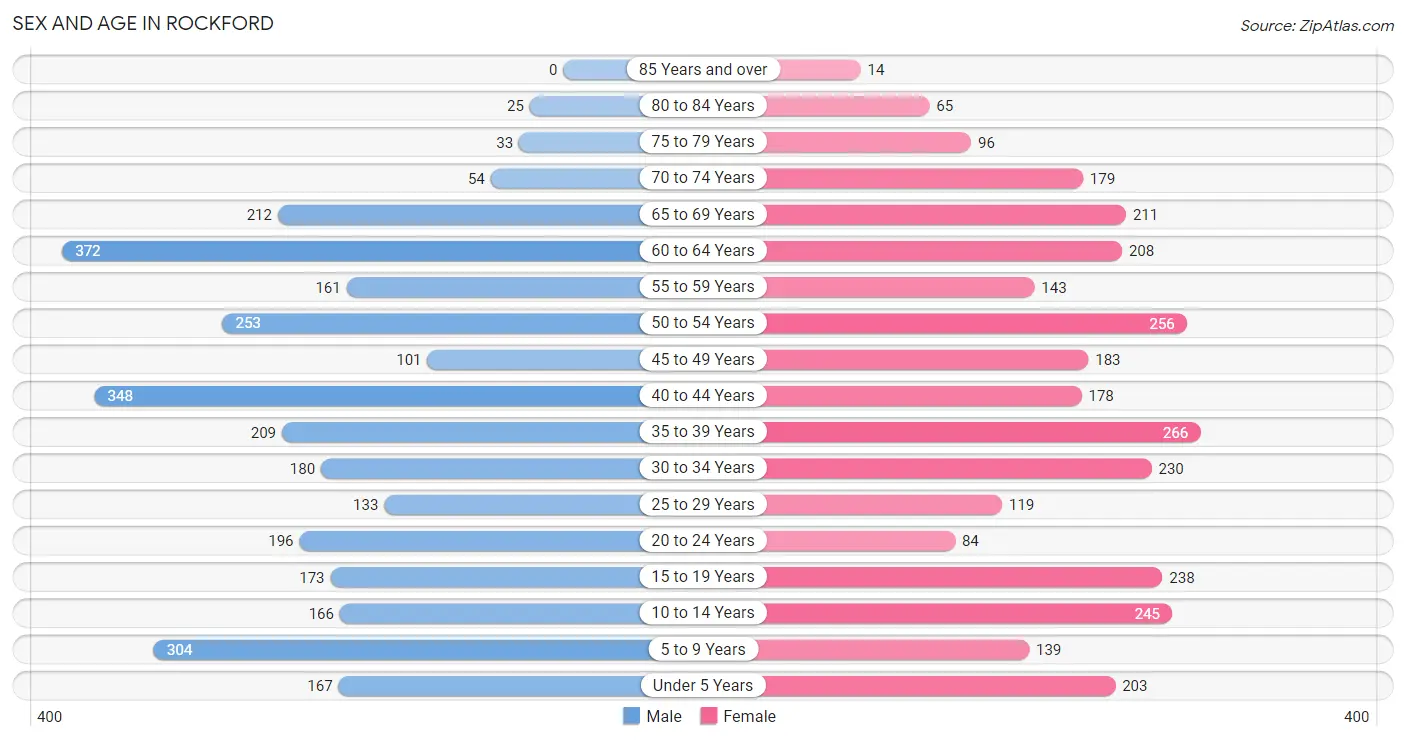
Sex and Age in Rockford
Sex and Age in Rockford
The most populous age groups in Rockford are 60 to 64 Years (372 | 12.0%) for men and 35 to 39 Years (266 | 8.7%) for women.
| Age Bracket | Male | Female |
| Under 5 Years | 167 (5.4%) | 203 (6.6%) |
| 5 to 9 Years | 304 (9.9%) | 139 (4.5%) |
| 10 to 14 Years | 166 (5.4%) | 245 (8.0%) |
| 15 to 19 Years | 173 (5.6%) | 238 (7.8%) |
| 20 to 24 Years | 196 (6.4%) | 84 (2.8%) |
| 25 to 29 Years | 133 (4.3%) | 119 (3.9%) |
| 30 to 34 Years | 180 (5.8%) | 230 (7.5%) |
| 35 to 39 Years | 209 (6.8%) | 266 (8.7%) |
| 40 to 44 Years | 348 (11.3%) | 178 (5.8%) |
| 45 to 49 Years | 101 (3.3%) | 183 (6.0%) |
| 50 to 54 Years | 253 (8.2%) | 256 (8.4%) |
| 55 to 59 Years | 161 (5.2%) | 143 (4.7%) |
| 60 to 64 Years | 372 (12.0%) | 208 (6.8%) |
| 65 to 69 Years | 212 (6.9%) | 211 (6.9%) |
| 70 to 74 Years | 54 (1.8%) | 179 (5.9%) |
| 75 to 79 Years | 33 (1.1%) | 96 (3.1%) |
| 80 to 84 Years | 25 (0.8%) | 65 (2.1%) |
| 85 Years and over | 0 (0.0%) | 14 (0.5%) |
| Total | 3,087 (100.0%) | 3,057 (100.0%) |
Families and Households in Rockford
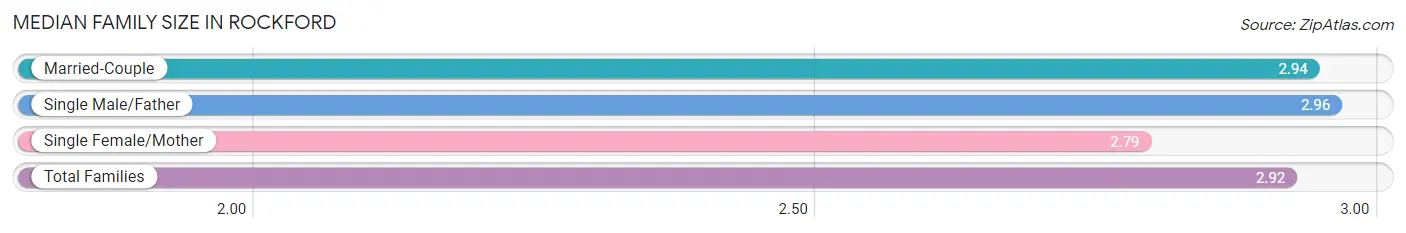
Median Family Size in Rockford
The median family size in Rockford is 2.92 persons per family, with single male/father families (76 | 4.4%) accounting for the largest median family size of 2.96 persons per family. On the other hand, single female/mother families (257 | 15.0%) represent the smallest median family size with 2.79 persons per family.
| Family Type | # Families | Family Size |
| Married-Couple | 1,376 (80.5%) | 2.94 |
| Single Male/Father | 76 (4.4%) | 2.96 |
| Single Female/Mother | 257 (15.0%) | 2.79 |
| Total Families | 1,709 (100.0%) | 2.92 |
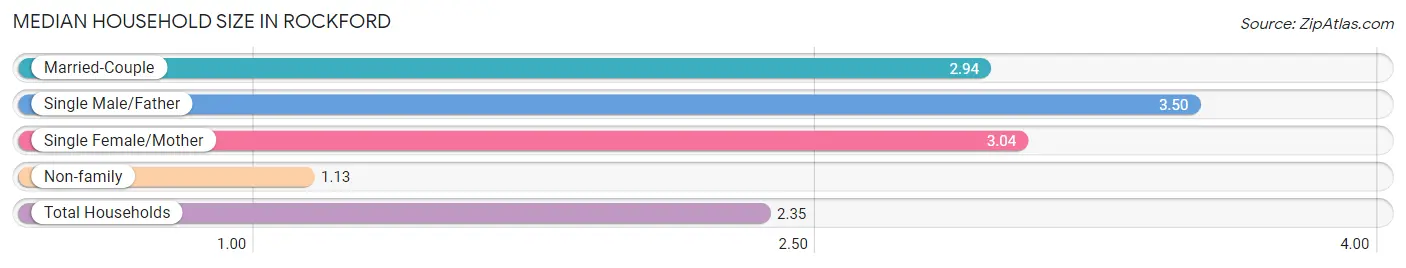
Median Household Size in Rockford
The median household size in Rockford is 2.35 persons per household, with single male/father households (76 | 2.9%) accounting for the largest median household size of 3.5 persons per household. non-family households (892 | 34.3%) represent the smallest median household size with 1.13 persons per household.
| Household Type | # Households | Household Size |
| Married-Couple | 1,376 (52.9%) | 2.94 |
| Single Male/Father | 76 (2.9%) | 3.50 |
| Single Female/Mother | 257 (9.9%) | 3.04 |
| Non-family | 892 (34.3%) | 1.13 |
| Total Households | 2,601 (100.0%) | 2.35 |
Household Size by Marriage Status in Rockford
Out of a total of 2,601 households in Rockford, 1,709 (65.7%) are family households, while 892 (34.3%) are nonfamily households. The most numerous type of family households are 2-person households, comprising 818, and the most common type of nonfamily households are 1-person households, comprising 812.
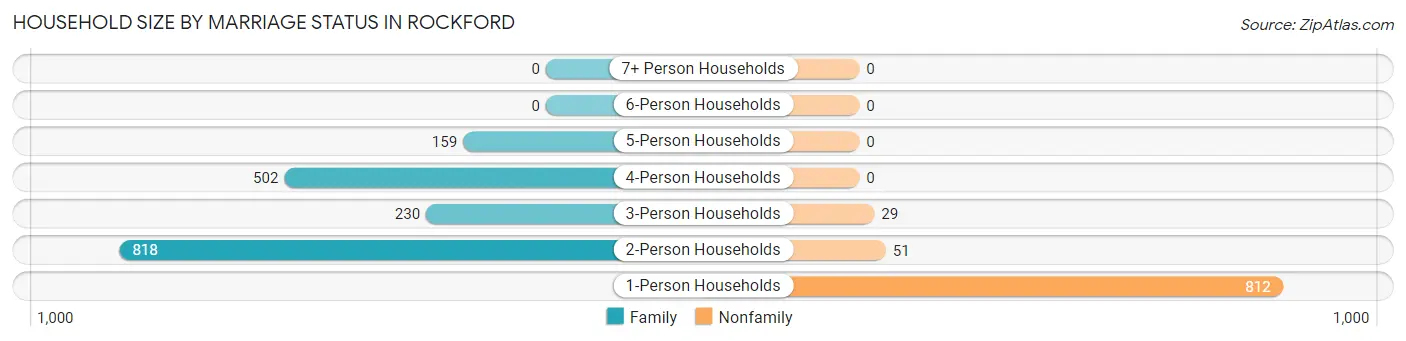
| Household Size | Family Households | Nonfamily Households |
| 1-Person Households | - | 812 (31.2%) |
| 2-Person Households | 818 (31.5%) | 51 (2.0%) |
| 3-Person Households | 230 (8.8%) | 29 (1.1%) |
| 4-Person Households | 502 (19.3%) | 0 (0.0%) |
| 5-Person Households | 159 (6.1%) | 0 (0.0%) |
| 6-Person Households | 0 (0.0%) | 0 (0.0%) |
| 7+ Person Households | 0 (0.0%) | 0 (0.0%) |
| Total | 1,709 (65.7%) | 892 (34.3%) |
Female Fertility in Rockford
Fertility by Age in Rockford
Average fertility rate in Rockford is 15.0 births per 1,000 women. Women in the age bracket of 20 to 34 years have the highest fertility rate with 46.0 births per 1,000 women. Women in the age bracket of 20 to 34 years acount for 100.0% of all women with births.
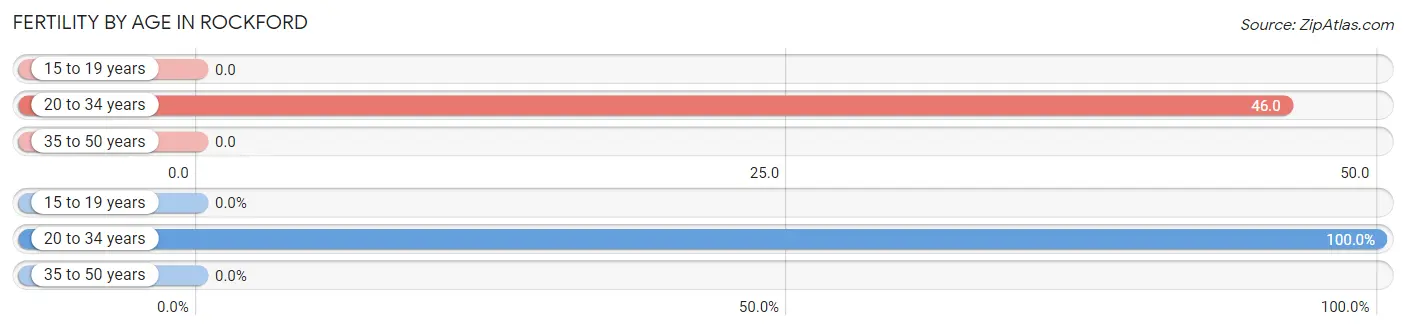
| Age Bracket | Women with Births | Births / 1,000 Women |
| 15 to 19 years | 0 (0.0%) | 0.0 |
| 20 to 34 years | 20 (100.0%) | 46.0 |
| 35 to 50 years | 0 (0.0%) | 0.0 |
| Total | 20 (100.0%) | 15.0 |
Fertility by Age by Marriage Status in Rockford
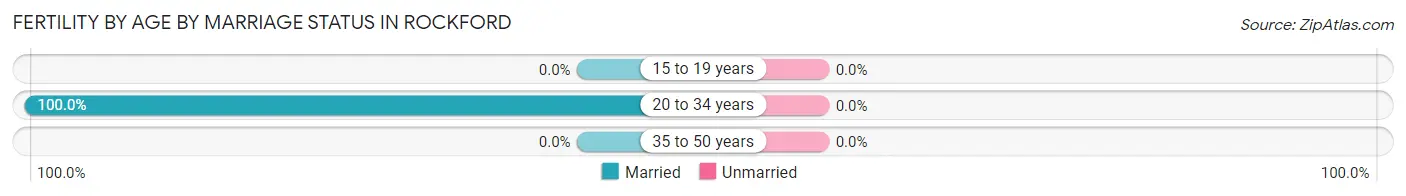
| Age Bracket | Married | Unmarried |
| 15 to 19 years | 0 (0.0%) | 0 (0.0%) |
| 20 to 34 years | 20 (100.0%) | 0 (0.0%) |
| 35 to 50 years | 0 (0.0%) | 0 (0.0%) |
| Total | 20 (100.0%) | 0 (0.0%) |
Fertility by Education in Rockford
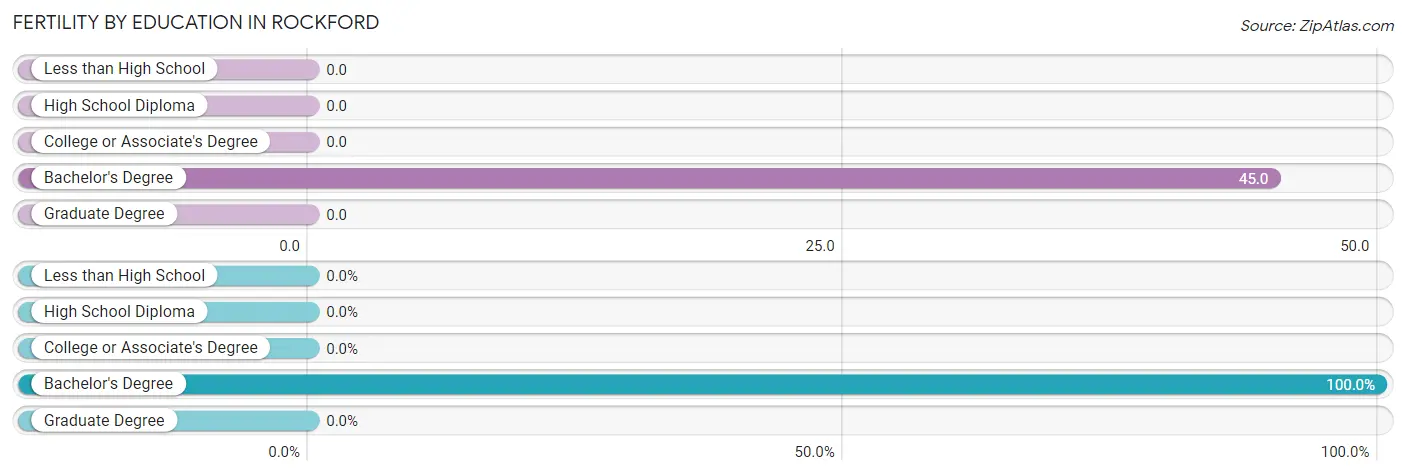
| Educational Attainment | Women with Births | Births / 1,000 Women |
| Less than High School | 0 (0.0%) | 0.0 |
| High School Diploma | 0 (0.0%) | 0.0 |
| College or Associate's Degree | 0 (0.0%) | 0.0 |
| Bachelor's Degree | 20 (100.0%) | 45.0 |
| Graduate Degree | 0 (0.0%) | 0.0 |
| Total | 20 (100.0%) | 15.0 |
Fertility by Education by Marriage Status in Rockford
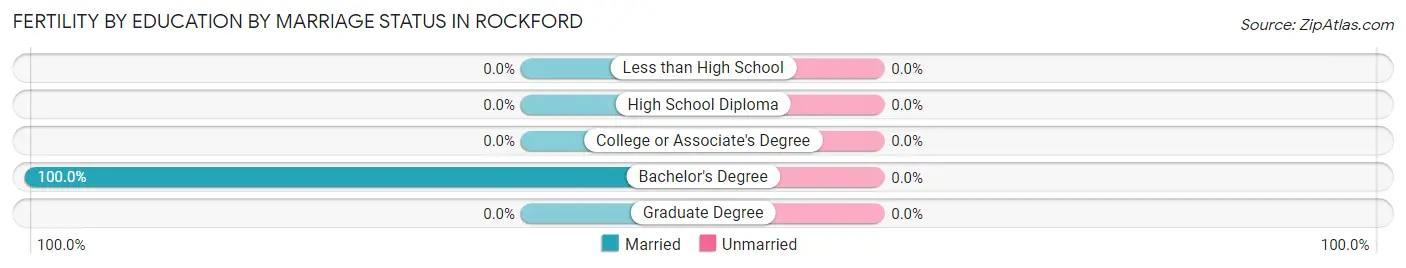
| Educational Attainment | Married | Unmarried |
| Less than High School | 0 (0.0%) | 0 (0.0%) |
| High School Diploma | 0 (0.0%) | 0 (0.0%) |
| College or Associate's Degree | 0 (0.0%) | 0 (0.0%) |
| Bachelor's Degree | 20 (100.0%) | 0 (0.0%) |
| Graduate Degree | 0 (0.0%) | 0 (0.0%) |
| Total | 20 (100.0%) | 0 (0.0%) |
Employment Characteristics in Rockford
Employment by Class of Employer in Rockford
Among the 3,330 employed individuals in Rockford, private company employees (2,405 | 72.2%), not-for-profit organizations (555 | 16.7%), and local government employees (164 | 4.9%) make up the most common classes of employment.
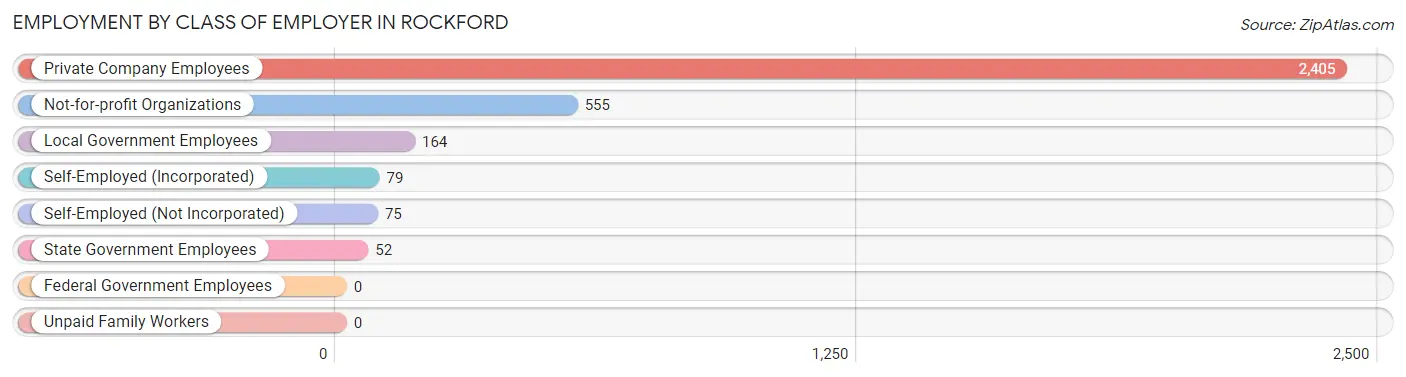
| Employer Class | # Employees | % Employees |
| Private Company Employees | 2,405 | 72.2% |
| Self-Employed (Incorporated) | 79 | 2.4% |
| Self-Employed (Not Incorporated) | 75 | 2.2% |
| Not-for-profit Organizations | 555 | 16.7% |
| Local Government Employees | 164 | 4.9% |
| State Government Employees | 52 | 1.6% |
| Federal Government Employees | 0 | 0.0% |
| Unpaid Family Workers | 0 | 0.0% |
| Total | 3,330 | 100.0% |
Employment Status by Age in Rockford
According to the labor force statistics for Rockford, out of the total population over 16 years of age (4,815), 75.5% or 3,635 individuals are in the labor force, with 8.4% or 305 of them unemployed. The age group with the highest labor force participation rate is 25 to 29 years, with 100.0% or 252 individuals in the labor force. Within the labor force, the 65 to 74 years age range has the highest percentage of unemployed individuals, with 53.2% or 149 of them being unemployed.
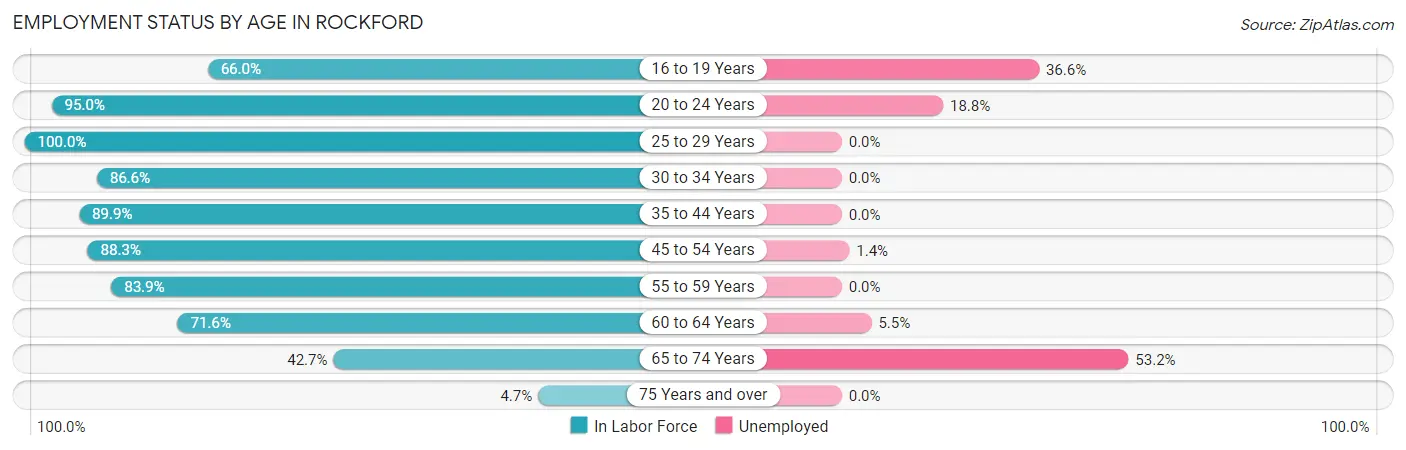
| Age Bracket | In Labor Force | Unemployed |
| 16 to 19 Years | 202 (66.0%) | 74 (36.6%) |
| 20 to 24 Years | 266 (95.0%) | 50 (18.8%) |
| 25 to 29 Years | 252 (100.0%) | 0 (0.0%) |
| 30 to 34 Years | 355 (86.6%) | 0 (0.0%) |
| 35 to 44 Years | 900 (89.9%) | 0 (0.0%) |
| 45 to 54 Years | 700 (88.3%) | 10 (1.4%) |
| 55 to 59 Years | 255 (83.9%) | 0 (0.0%) |
| 60 to 64 Years | 415 (71.6%) | 23 (5.5%) |
| 65 to 74 Years | 280 (42.7%) | 149 (53.2%) |
| 75 Years and over | 11 (4.7%) | 0 (0.0%) |
| Total | 3,635 (75.5%) | 305 (8.4%) |
Employment Status by Educational Attainment in Rockford
According to labor force statistics for Rockford, 86.1% of individuals (2,876) out of the total population between 25 and 64 years of age (3,340) are in the labor force, with 1.1% or 32 of them being unemployed. The group with the highest labor force participation rate are those with the educational attainment of bachelor's degree or higher, with 91.0% or 1,521 individuals in the labor force. Within the labor force, individuals with high school diploma education have the highest percentage of unemployment, with 2.7% or 12 of them being unemployed.
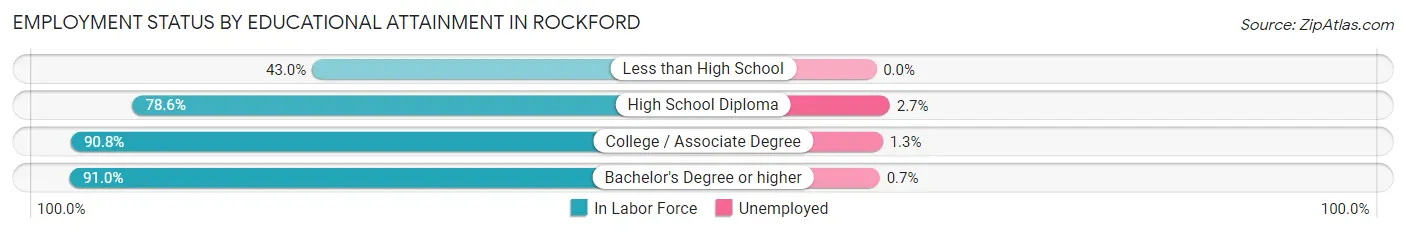
| Educational Attainment | In Labor Force | Unemployed |
| Less than High School | 80 (43.0%) | 0 (0.0%) |
| High School Diploma | 448 (78.6%) | 15 (2.7%) |
| College / Associate Degree | 829 (90.8%) | 12 (1.3%) |
| Bachelor's Degree or higher | 1,521 (91.0%) | 12 (0.7%) |
| Total | 2,876 (86.1%) | 37 (1.1%) |
Employment Occupations by Sex in Rockford
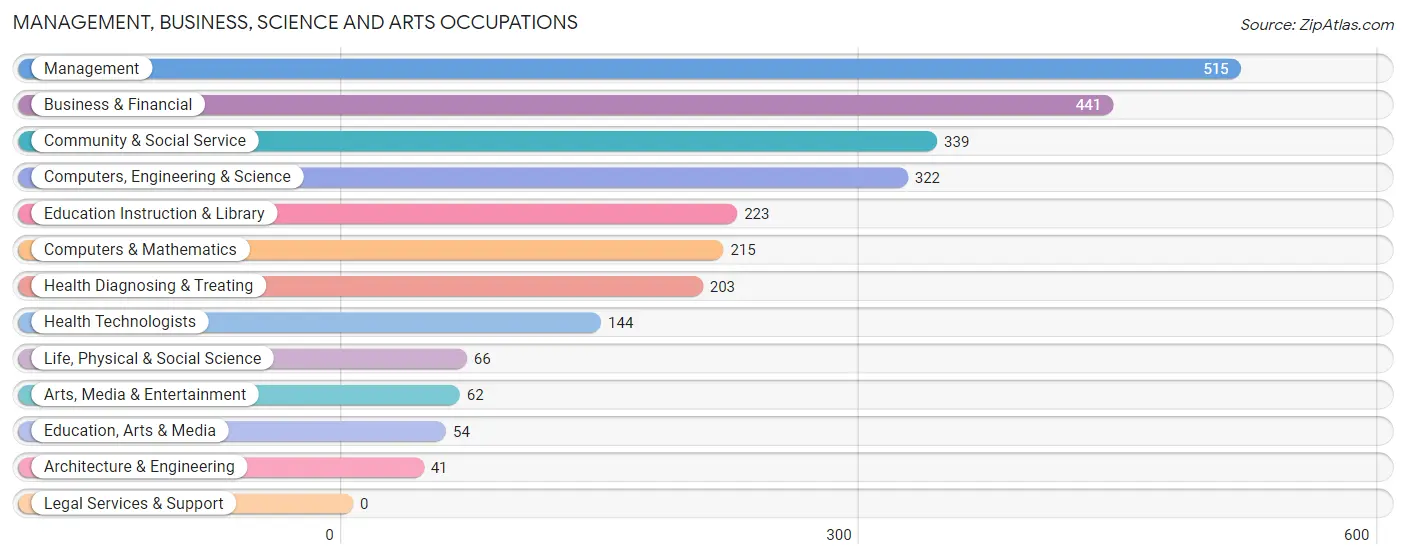
Management, Business, Science and Arts Occupations
The most common Management, Business, Science and Arts occupations in Rockford are Management (515 | 15.5%), Business & Financial (441 | 13.2%), Community & Social Service (339 | 10.2%), Computers, Engineering & Science (322 | 9.7%), and Education Instruction & Library (223 | 6.7%).
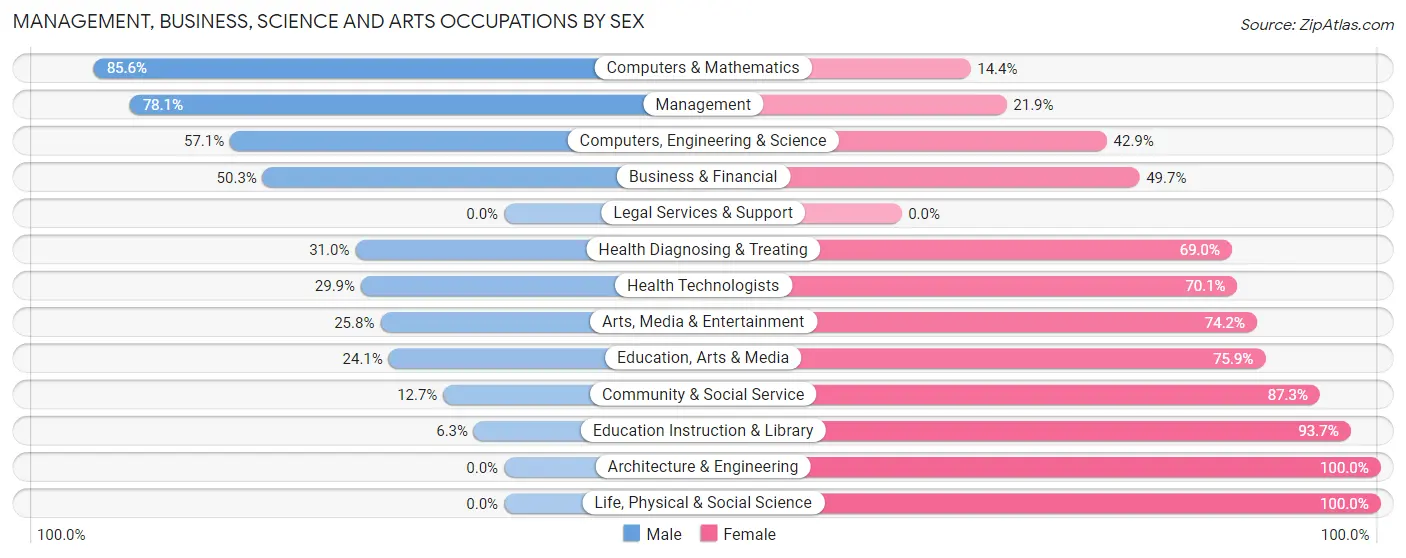
Management, Business, Science and Arts Occupations by Sex
Within the Management, Business, Science and Arts occupations in Rockford, the most male-oriented occupations are Computers & Mathematics (85.6%), Management (78.1%), and Computers, Engineering & Science (57.1%), while the most female-oriented occupations are Architecture & Engineering (100.0%), Life, Physical & Social Science (100.0%), and Education Instruction & Library (93.7%).
| Occupation | Male | Female |
| Management | 402 (78.1%) | 113 (21.9%) |
| Business & Financial | 222 (50.3%) | 219 (49.7%) |
| Computers, Engineering & Science | 184 (57.1%) | 138 (42.9%) |
| Computers & Mathematics | 184 (85.6%) | 31 (14.4%) |
| Architecture & Engineering | 0 (0.0%) | 41 (100.0%) |
| Life, Physical & Social Science | 0 (0.0%) | 66 (100.0%) |
| Community & Social Service | 43 (12.7%) | 296 (87.3%) |
| Education, Arts & Media | 13 (24.1%) | 41 (75.9%) |
| Legal Services & Support | 0 (0.0%) | 0 (0.0%) |
| Education Instruction & Library | 14 (6.3%) | 209 (93.7%) |
| Arts, Media & Entertainment | 16 (25.8%) | 46 (74.2%) |
| Health Diagnosing & Treating | 63 (31.0%) | 140 (69.0%) |
| Health Technologists | 43 (29.9%) | 101 (70.1%) |
| Total (Category) | 914 (50.2%) | 906 (49.8%) |
| Total (Overall) | 1,896 (56.9%) | 1,434 (43.1%) |
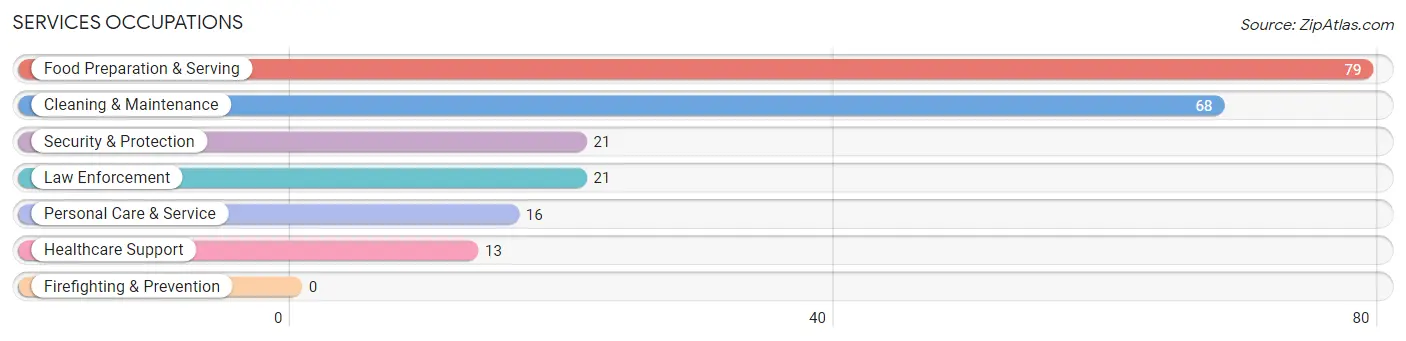
Services Occupations
The most common Services occupations in Rockford are Food Preparation & Serving (79 | 2.4%), Cleaning & Maintenance (68 | 2.0%), Security & Protection (21 | 0.6%), Law Enforcement (21 | 0.6%), and Personal Care & Service (16 | 0.5%).
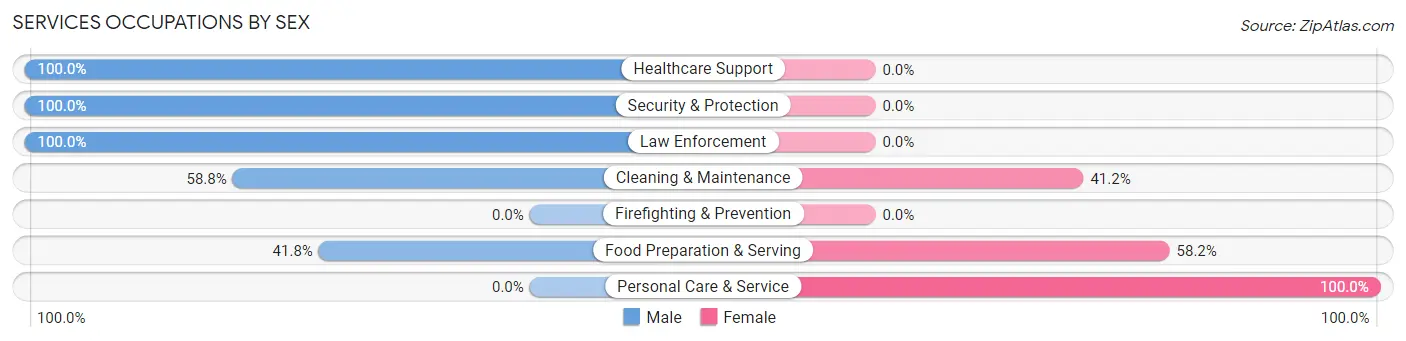
Services Occupations by Sex
Within the Services occupations in Rockford, the most male-oriented occupations are Healthcare Support (100.0%), Security & Protection (100.0%), and Law Enforcement (100.0%), while the most female-oriented occupations are Personal Care & Service (100.0%), Food Preparation & Serving (58.2%), and Cleaning & Maintenance (41.2%).
| Occupation | Male | Female |
| Healthcare Support | 13 (100.0%) | 0 (0.0%) |
| Security & Protection | 21 (100.0%) | 0 (0.0%) |
| Firefighting & Prevention | 0 (0.0%) | 0 (0.0%) |
| Law Enforcement | 21 (100.0%) | 0 (0.0%) |
| Food Preparation & Serving | 33 (41.8%) | 46 (58.2%) |
| Cleaning & Maintenance | 40 (58.8%) | 28 (41.2%) |
| Personal Care & Service | 0 (0.0%) | 16 (100.0%) |
| Total (Category) | 107 (54.3%) | 90 (45.7%) |
| Total (Overall) | 1,896 (56.9%) | 1,434 (43.1%) |
Sales and Office Occupations
The most common Sales and Office occupations in Rockford are Office & Administration (376 | 11.3%), and Sales & Related (322 | 9.7%).
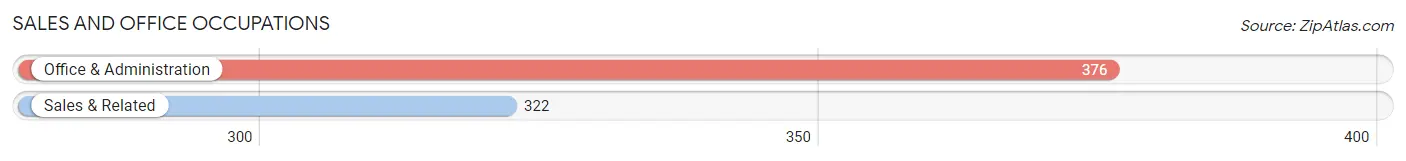
Sales and Office Occupations by Sex
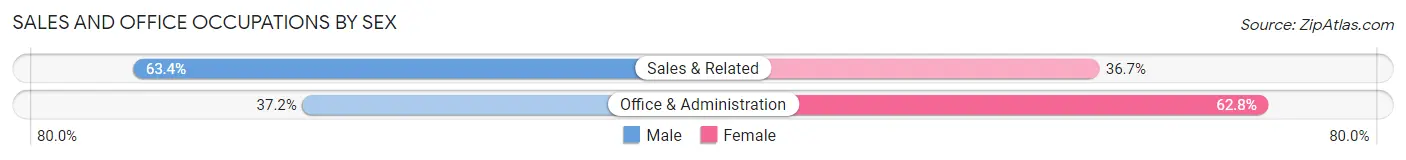
| Occupation | Male | Female |
| Sales & Related | 204 (63.3%) | 118 (36.6%) |
| Office & Administration | 140 (37.2%) | 236 (62.8%) |
| Total (Category) | 344 (49.3%) | 354 (50.7%) |
| Total (Overall) | 1,896 (56.9%) | 1,434 (43.1%) |
Natural Resources, Construction and Maintenance Occupations
The most common Natural Resources, Construction and Maintenance occupations in Rockford are Construction & Extraction (123 | 3.7%), Installation, Maintenance & Repair (41 | 1.2%), and Farming, Fishing & Forestry (18 | 0.5%).
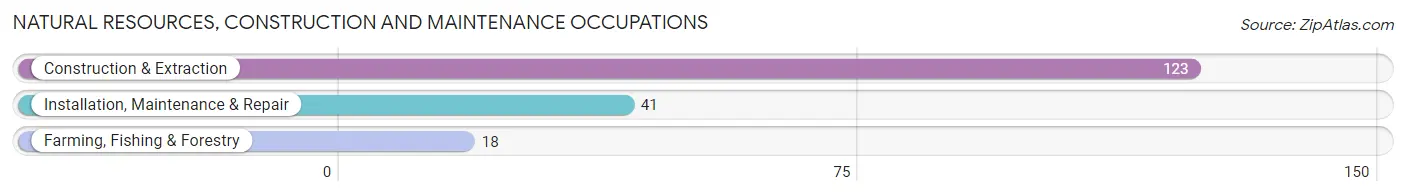
Natural Resources, Construction and Maintenance Occupations by Sex
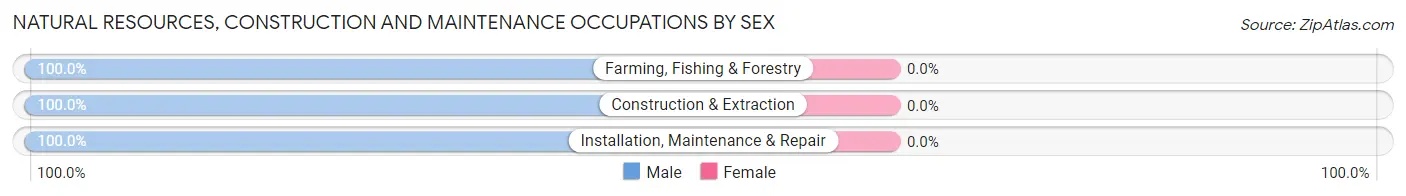
| Occupation | Male | Female |
| Farming, Fishing & Forestry | 18 (100.0%) | 0 (0.0%) |
| Construction & Extraction | 123 (100.0%) | 0 (0.0%) |
| Installation, Maintenance & Repair | 41 (100.0%) | 0 (0.0%) |
| Total (Category) | 182 (100.0%) | 0 (0.0%) |
| Total (Overall) | 1,896 (56.9%) | 1,434 (43.1%) |
Production, Transportation and Moving Occupations
The most common Production, Transportation and Moving occupations in Rockford are Production (309 | 9.3%), Material Moving (86 | 2.6%), and Transportation (38 | 1.1%).
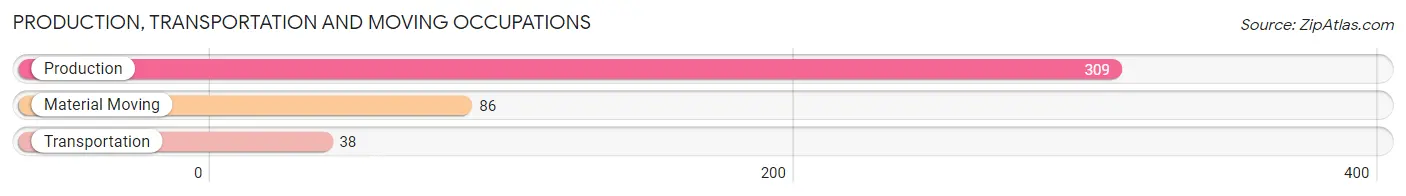
Production, Transportation and Moving Occupations by Sex
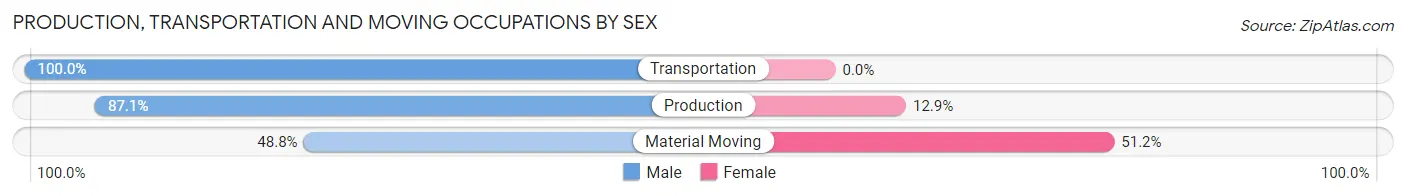
| Occupation | Male | Female |
| Production | 269 (87.1%) | 40 (12.9%) |
| Transportation | 38 (100.0%) | 0 (0.0%) |
| Material Moving | 42 (48.8%) | 44 (51.2%) |
| Total (Category) | 349 (80.6%) | 84 (19.4%) |
| Total (Overall) | 1,896 (56.9%) | 1,434 (43.1%) |
Employment Industries by Sex in Rockford
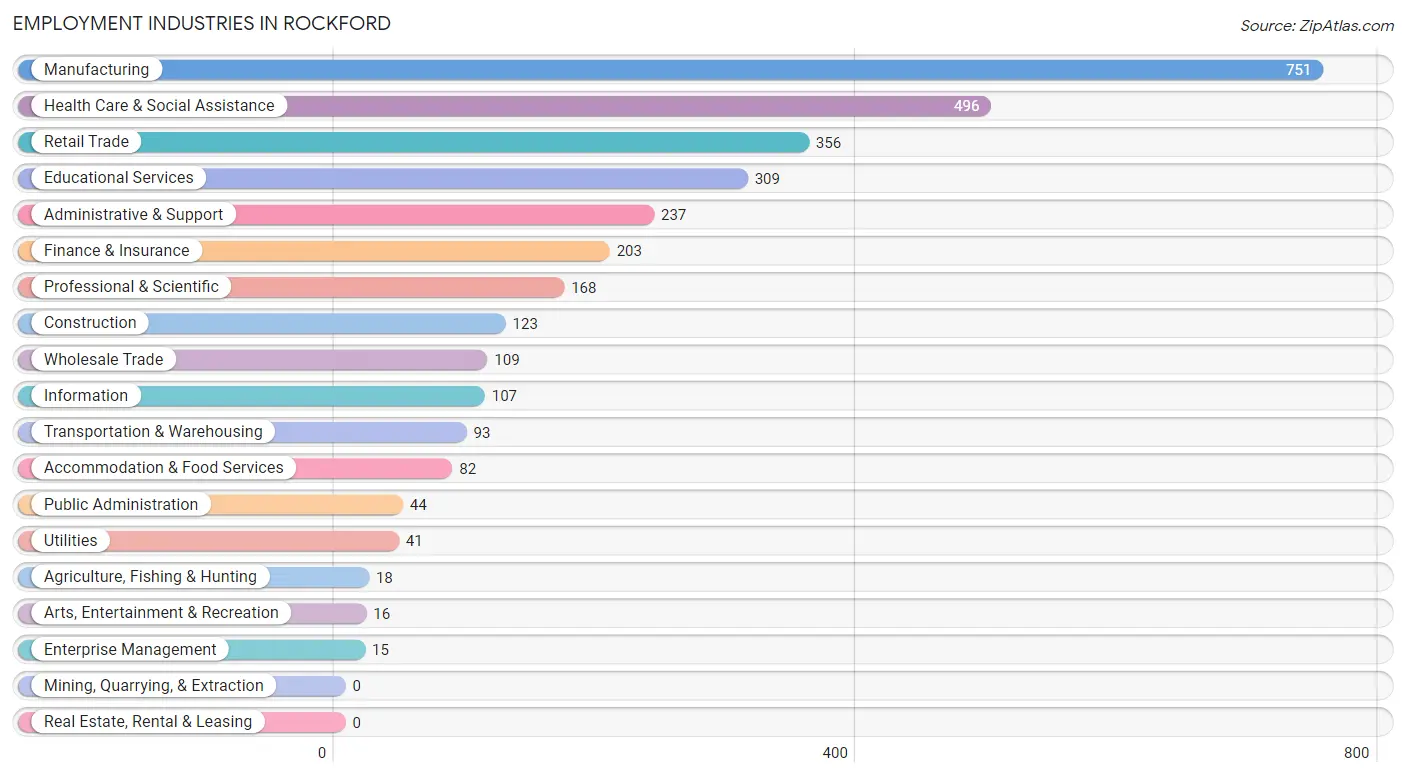
Employment Industries in Rockford
The major employment industries in Rockford include Manufacturing (751 | 22.6%), Health Care & Social Assistance (496 | 14.9%), Retail Trade (356 | 10.7%), Educational Services (309 | 9.3%), and Administrative & Support (237 | 7.1%).
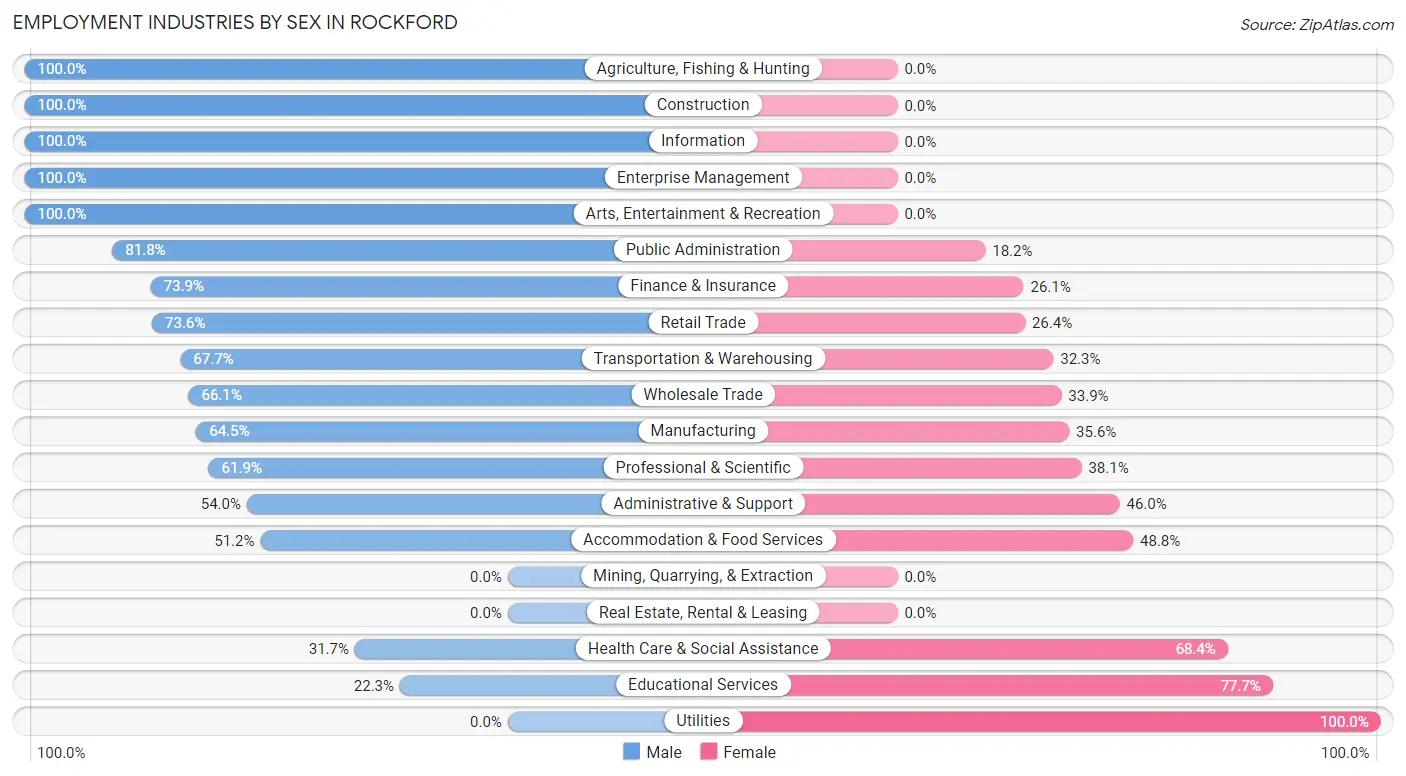
Employment Industries by Sex in Rockford
The Rockford industries that see more men than women are Agriculture, Fishing & Hunting (100.0%), Construction (100.0%), and Information (100.0%), whereas the industries that tend to have a higher number of women are Utilities (100.0%), Educational Services (77.7%), and Health Care & Social Assistance (68.3%).
| Industry | Male | Female |
| Agriculture, Fishing & Hunting | 18 (100.0%) | 0 (0.0%) |
| Mining, Quarrying, & Extraction | 0 (0.0%) | 0 (0.0%) |
| Construction | 123 (100.0%) | 0 (0.0%) |
| Manufacturing | 484 (64.4%) | 267 (35.5%) |
| Wholesale Trade | 72 (66.1%) | 37 (33.9%) |
| Retail Trade | 262 (73.6%) | 94 (26.4%) |
| Transportation & Warehousing | 63 (67.7%) | 30 (32.3%) |
| Utilities | 0 (0.0%) | 41 (100.0%) |
| Information | 107 (100.0%) | 0 (0.0%) |
| Finance & Insurance | 150 (73.9%) | 53 (26.1%) |
| Real Estate, Rental & Leasing | 0 (0.0%) | 0 (0.0%) |
| Professional & Scientific | 104 (61.9%) | 64 (38.1%) |
| Enterprise Management | 15 (100.0%) | 0 (0.0%) |
| Administrative & Support | 128 (54.0%) | 109 (46.0%) |
| Educational Services | 69 (22.3%) | 240 (77.7%) |
| Health Care & Social Assistance | 157 (31.7%) | 339 (68.3%) |
| Arts, Entertainment & Recreation | 16 (100.0%) | 0 (0.0%) |
| Accommodation & Food Services | 42 (51.2%) | 40 (48.8%) |
| Public Administration | 36 (81.8%) | 8 (18.2%) |
| Total | 1,896 (56.9%) | 1,434 (43.1%) |
Education in Rockford
School Enrollment in Rockford
The most common levels of schooling among the 1,511 students in Rockford are high school (386 | 25.6%), elementary school (353 | 23.4%), and middle school (309 | 20.4%).
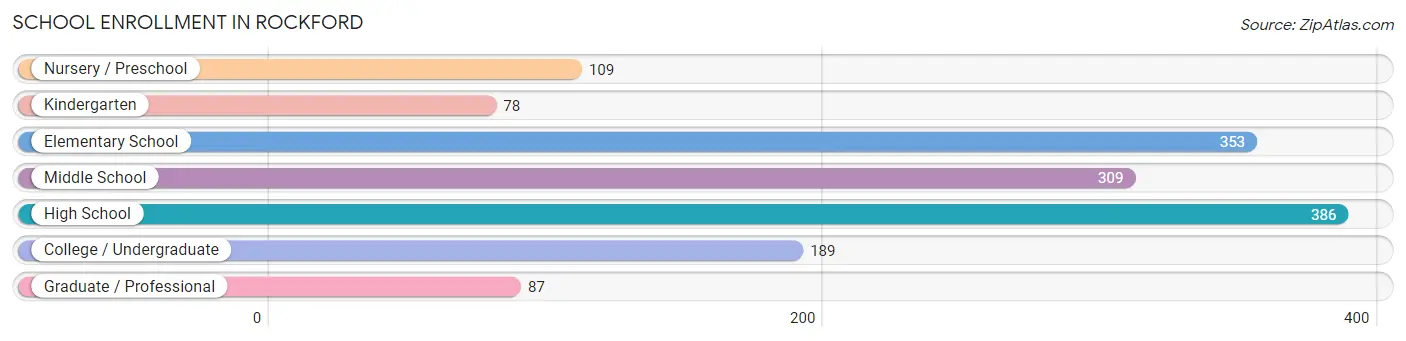
| School Level | # Students | % Students |
| Nursery / Preschool | 109 | 7.2% |
| Kindergarten | 78 | 5.2% |
| Elementary School | 353 | 23.4% |
| Middle School | 309 | 20.4% |
| High School | 386 | 25.6% |
| College / Undergraduate | 189 | 12.5% |
| Graduate / Professional | 87 | 5.8% |
| Total | 1,511 | 100.0% |
School Enrollment by Age by Funding Source in Rockford
Out of a total of 1,511 students who are enrolled in schools in Rockford, 201 (13.3%) attend a private institution, while the remaining 1,310 (86.7%) are enrolled in public schools. The age group of 35 years and over has the highest likelihood of being enrolled in private schools, with 36 (100.0% in the age bracket) enrolled. Conversely, the age group of 10 to 14 year olds has the lowest likelihood of being enrolled in a private school, with 411 (100.0% in the age bracket) attending a public institution.
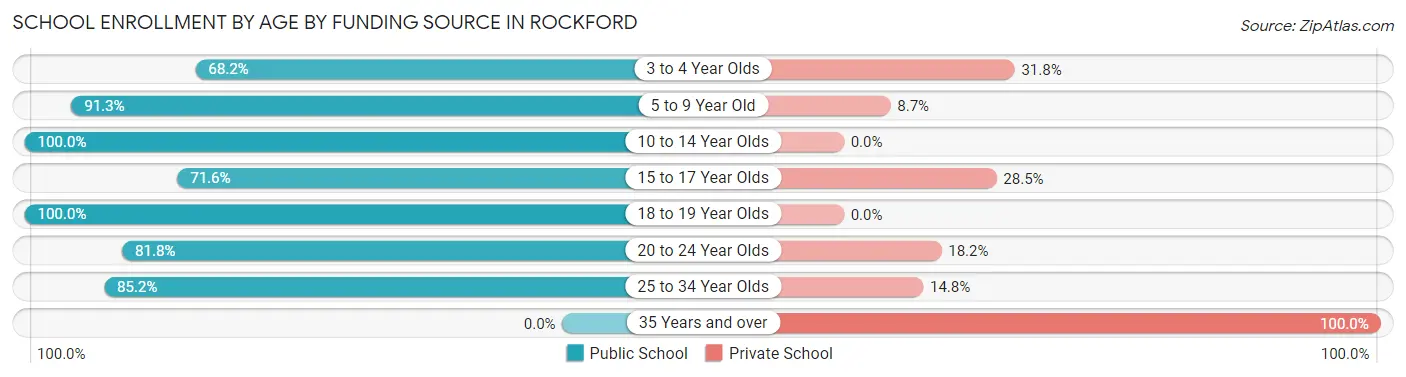
| Age Bracket | Public School | Private School |
| 3 to 4 Year Olds | 60 (68.2%) | 28 (31.8%) |
| 5 to 9 Year Old | 336 (91.3%) | 32 (8.7%) |
| 10 to 14 Year Olds | 411 (100.0%) | 0 (0.0%) |
| 15 to 17 Year Olds | 171 (71.6%) | 68 (28.4%) |
| 18 to 19 Year Olds | 134 (100.0%) | 0 (0.0%) |
| 20 to 24 Year Olds | 54 (81.8%) | 12 (18.2%) |
| 25 to 34 Year Olds | 144 (85.2%) | 25 (14.8%) |
| 35 Years and over | 0 (0.0%) | 36 (100.0%) |
| Total | 1,310 (86.7%) | 201 (13.3%) |
Educational Attainment by Field of Study in Rockford
Business (658 | 29.5%), arts & humanities (226 | 10.1%), education (160 | 7.2%), science & technology (151 | 6.8%), and social sciences (145 | 6.5%) are the most common fields of study among 2,232 individuals in Rockford who have obtained a bachelor's degree or higher.
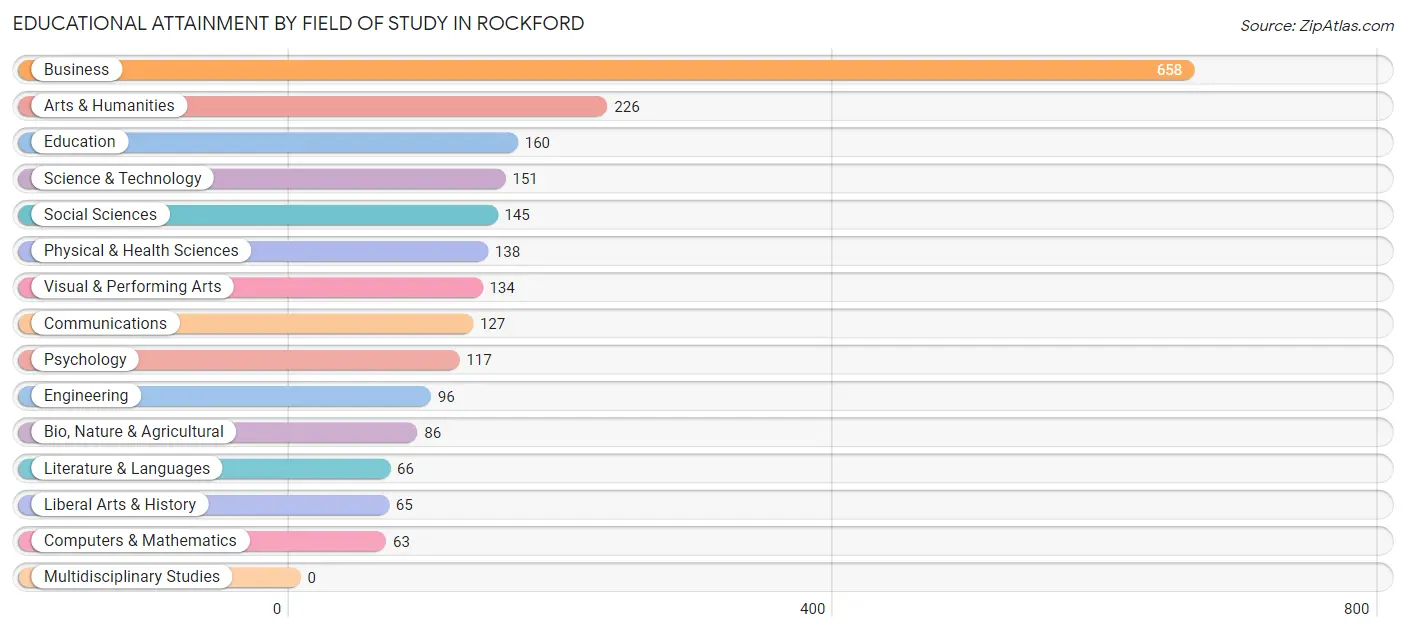
| Field of Study | # Graduates | % Graduates |
| Computers & Mathematics | 63 | 2.8% |
| Bio, Nature & Agricultural | 86 | 3.8% |
| Physical & Health Sciences | 138 | 6.2% |
| Psychology | 117 | 5.2% |
| Social Sciences | 145 | 6.5% |
| Engineering | 96 | 4.3% |
| Multidisciplinary Studies | 0 | 0.0% |
| Science & Technology | 151 | 6.8% |
| Business | 658 | 29.5% |
| Education | 160 | 7.2% |
| Literature & Languages | 66 | 3.0% |
| Liberal Arts & History | 65 | 2.9% |
| Visual & Performing Arts | 134 | 6.0% |
| Communications | 127 | 5.7% |
| Arts & Humanities | 226 | 10.1% |
| Total | 2,232 | 100.0% |
Transportation & Commute in Rockford
Vehicle Availability by Sex in Rockford
The most prevalent vehicle ownership categories in Rockford are males with 2 vehicles (950, accounting for 50.1%) and females with 2 vehicles (752, making up 66.2%).
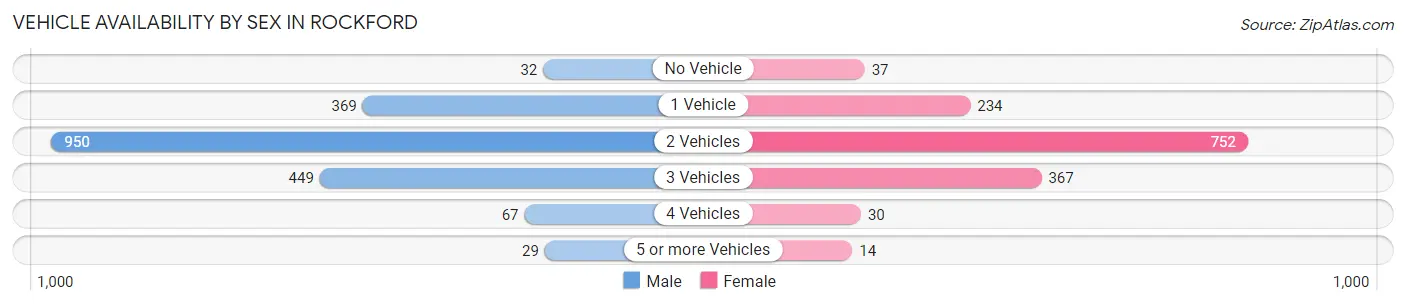
| Vehicles Available | Male | Female |
| No Vehicle | 32 (1.7%) | 37 (2.6%) |
| 1 Vehicle | 369 (19.5%) | 234 (16.3%) |
| 2 Vehicles | 950 (50.1%) | 752 (52.4%) |
| 3 Vehicles | 449 (23.7%) | 367 (25.6%) |
| 4 Vehicles | 67 (3.5%) | 30 (2.1%) |
| 5 or more Vehicles | 29 (1.5%) | 14 (1.0%) |
| Total | 1,896 (100.0%) | 1,434 (100.0%) |
Commute Time in Rockford
The most frequently occuring commute durations in Rockford are 30 to 34 minutes (926 commuters, 34.2%), 15 to 19 minutes (435 commuters, 16.1%), and 20 to 24 minutes (397 commuters, 14.7%).
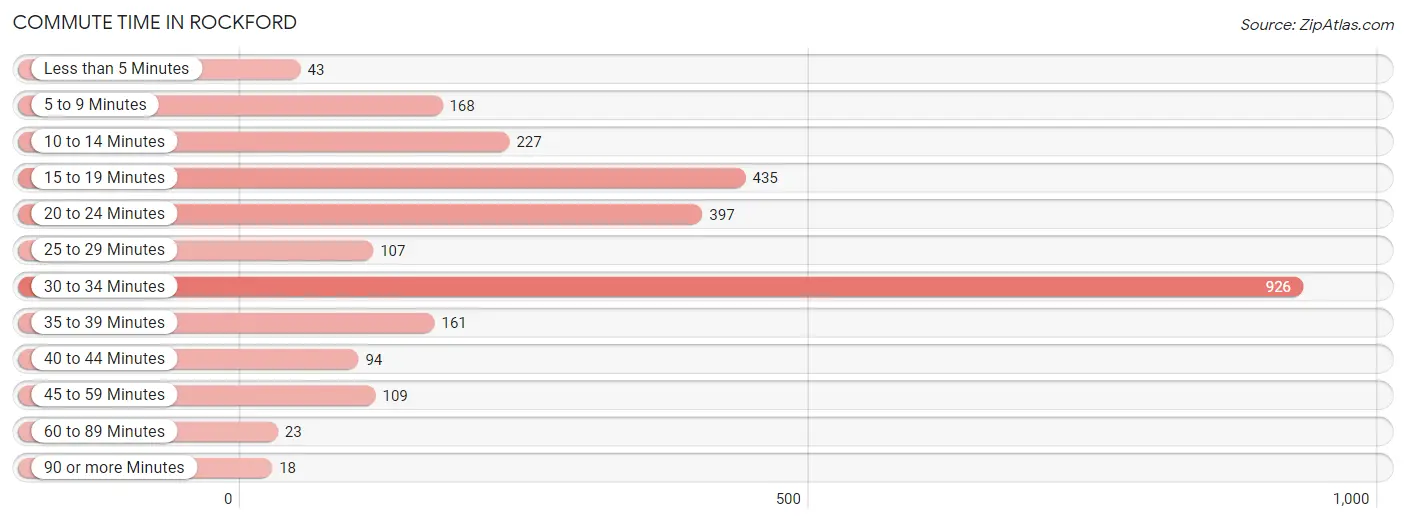
| Commute Time | # Commuters | % Commuters |
| Less than 5 Minutes | 43 | 1.6% |
| 5 to 9 Minutes | 168 | 6.2% |
| 10 to 14 Minutes | 227 | 8.4% |
| 15 to 19 Minutes | 435 | 16.1% |
| 20 to 24 Minutes | 397 | 14.7% |
| 25 to 29 Minutes | 107 | 4.0% |
| 30 to 34 Minutes | 926 | 34.2% |
| 35 to 39 Minutes | 161 | 5.9% |
| 40 to 44 Minutes | 94 | 3.5% |
| 45 to 59 Minutes | 109 | 4.0% |
| 60 to 89 Minutes | 23 | 0.9% |
| 90 or more Minutes | 18 | 0.7% |
Commute Time by Sex in Rockford
The most common commute times in Rockford are 30 to 34 minutes (582 commuters, 38.2%) for males and 30 to 34 minutes (344 commuters, 29.0%) for females.
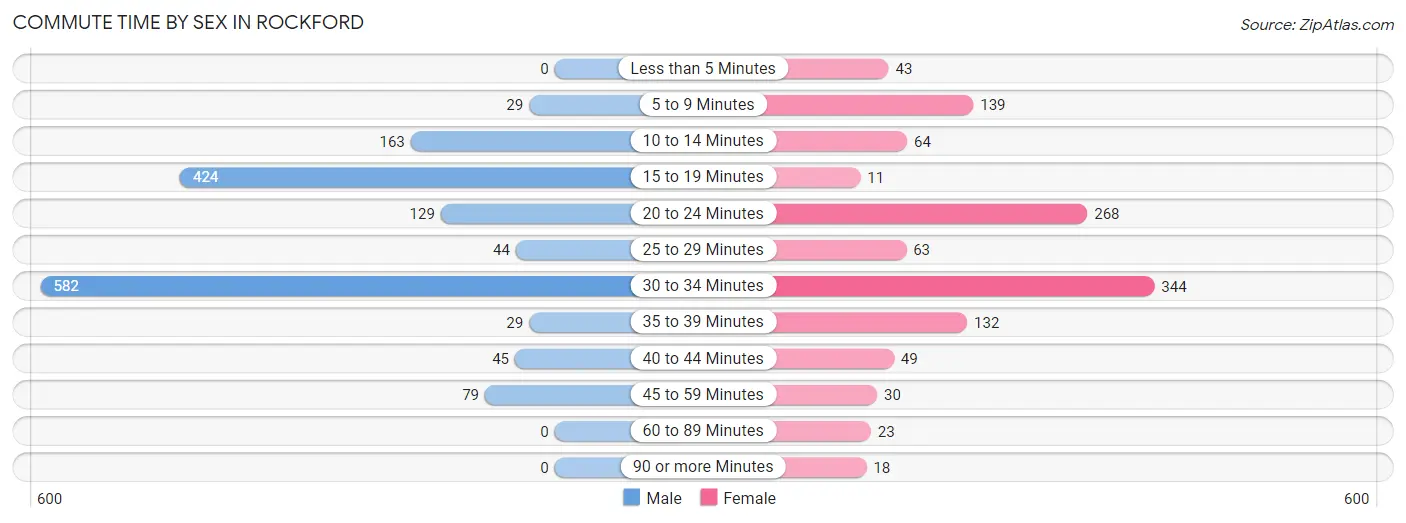
| Commute Time | Male | Female |
| Less than 5 Minutes | 0 (0.0%) | 43 (3.6%) |
| 5 to 9 Minutes | 29 (1.9%) | 139 (11.7%) |
| 10 to 14 Minutes | 163 (10.7%) | 64 (5.4%) |
| 15 to 19 Minutes | 424 (27.8%) | 11 (0.9%) |
| 20 to 24 Minutes | 129 (8.5%) | 268 (22.6%) |
| 25 to 29 Minutes | 44 (2.9%) | 63 (5.3%) |
| 30 to 34 Minutes | 582 (38.2%) | 344 (29.0%) |
| 35 to 39 Minutes | 29 (1.9%) | 132 (11.2%) |
| 40 to 44 Minutes | 45 (2.9%) | 49 (4.1%) |
| 45 to 59 Minutes | 79 (5.2%) | 30 (2.5%) |
| 60 to 89 Minutes | 0 (0.0%) | 23 (1.9%) |
| 90 or more Minutes | 0 (0.0%) | 18 (1.5%) |
Time of Departure to Work by Sex in Rockford
The most frequent times of departure to work in Rockford are 6:30 AM to 6:59 AM (345, 22.6%) for males and 7:00 AM to 7:29 AM (343, 29.0%) for females.
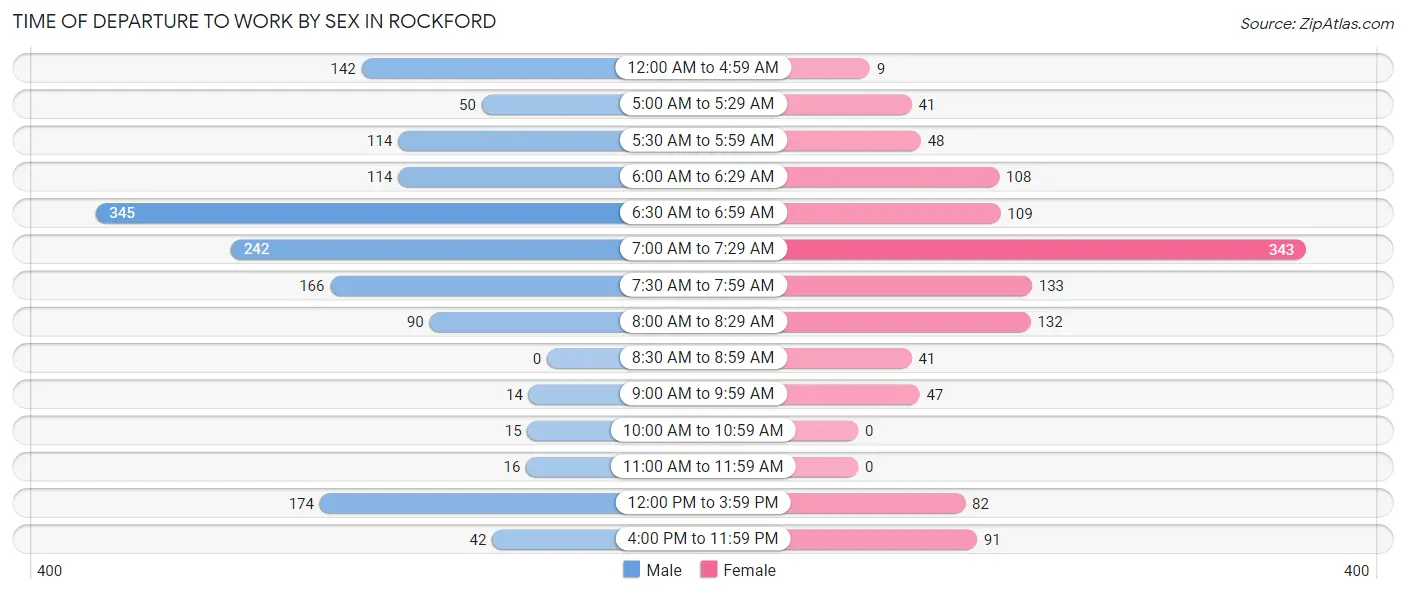
| Time of Departure | Male | Female |
| 12:00 AM to 4:59 AM | 142 (9.3%) | 9 (0.8%) |
| 5:00 AM to 5:29 AM | 50 (3.3%) | 41 (3.5%) |
| 5:30 AM to 5:59 AM | 114 (7.5%) | 48 (4.1%) |
| 6:00 AM to 6:29 AM | 114 (7.5%) | 108 (9.1%) |
| 6:30 AM to 6:59 AM | 345 (22.6%) | 109 (9.2%) |
| 7:00 AM to 7:29 AM | 242 (15.9%) | 343 (29.0%) |
| 7:30 AM to 7:59 AM | 166 (10.9%) | 133 (11.2%) |
| 8:00 AM to 8:29 AM | 90 (5.9%) | 132 (11.2%) |
| 8:30 AM to 8:59 AM | 0 (0.0%) | 41 (3.5%) |
| 9:00 AM to 9:59 AM | 14 (0.9%) | 47 (4.0%) |
| 10:00 AM to 10:59 AM | 15 (1.0%) | 0 (0.0%) |
| 11:00 AM to 11:59 AM | 16 (1.1%) | 0 (0.0%) |
| 12:00 PM to 3:59 PM | 174 (11.4%) | 82 (6.9%) |
| 4:00 PM to 11:59 PM | 42 (2.8%) | 91 (7.7%) |
| Total | 1,524 (100.0%) | 1,184 (100.0%) |
Housing Occupancy in Rockford
Occupancy by Ownership in Rockford
Of the total 2,601 dwellings in Rockford, owner-occupied units account for 1,976 (76.0%), while renter-occupied units make up 625 (24.0%).
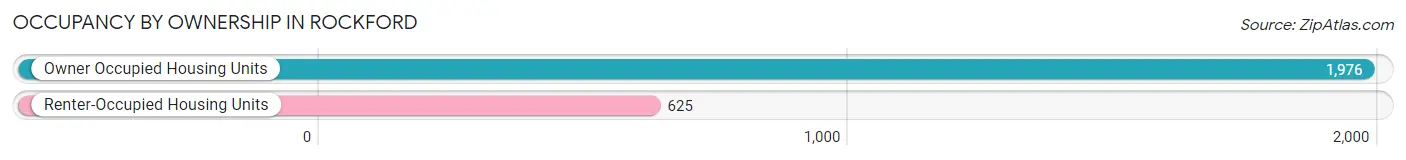
| Occupancy | # Housing Units | % Housing Units |
| Owner Occupied Housing Units | 1,976 | 76.0% |
| Renter-Occupied Housing Units | 625 | 24.0% |
| Total Occupied Housing Units | 2,601 | 100.0% |
Occupancy by Household Size in Rockford
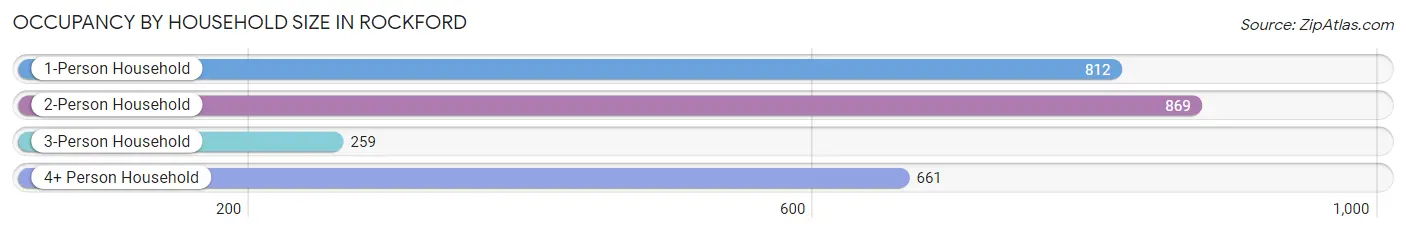
| Household Size | # Housing Units | % Housing Units |
| 1-Person Household | 812 | 31.2% |
| 2-Person Household | 869 | 33.4% |
| 3-Person Household | 259 | 10.0% |
| 4+ Person Household | 661 | 25.4% |
| Total Housing Units | 2,601 | 100.0% |
Occupancy by Ownership by Household Size in Rockford
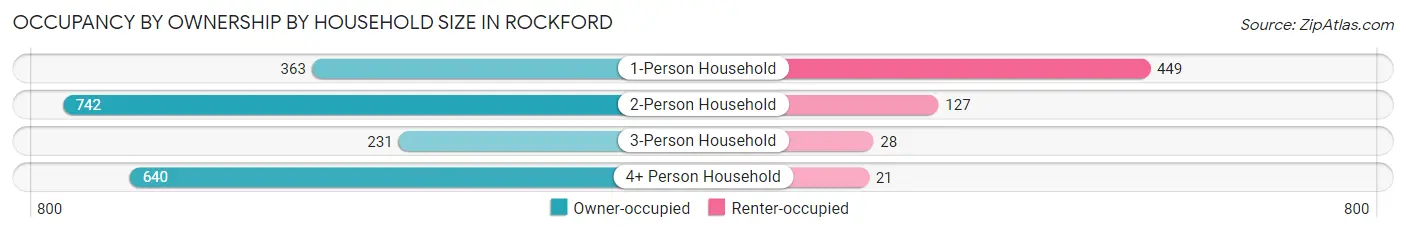
| Household Size | Owner-occupied | Renter-occupied |
| 1-Person Household | 363 (44.7%) | 449 (55.3%) |
| 2-Person Household | 742 (85.4%) | 127 (14.6%) |
| 3-Person Household | 231 (89.2%) | 28 (10.8%) |
| 4+ Person Household | 640 (96.8%) | 21 (3.2%) |
| Total Housing Units | 1,976 (76.0%) | 625 (24.0%) |
Occupancy by Educational Attainment in Rockford
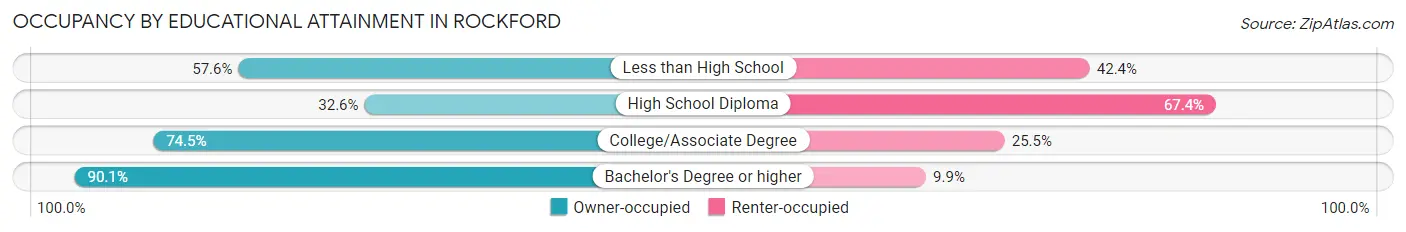
| Household Size | Owner-occupied | Renter-occupied |
| Less than High School | 102 (57.6%) | 75 (42.4%) |
| High School Diploma | 94 (32.6%) | 194 (67.4%) |
| College/Associate Degree | 689 (74.5%) | 236 (25.5%) |
| Bachelor's Degree or higher | 1,091 (90.1%) | 120 (9.9%) |
Occupancy by Age of Householder in Rockford
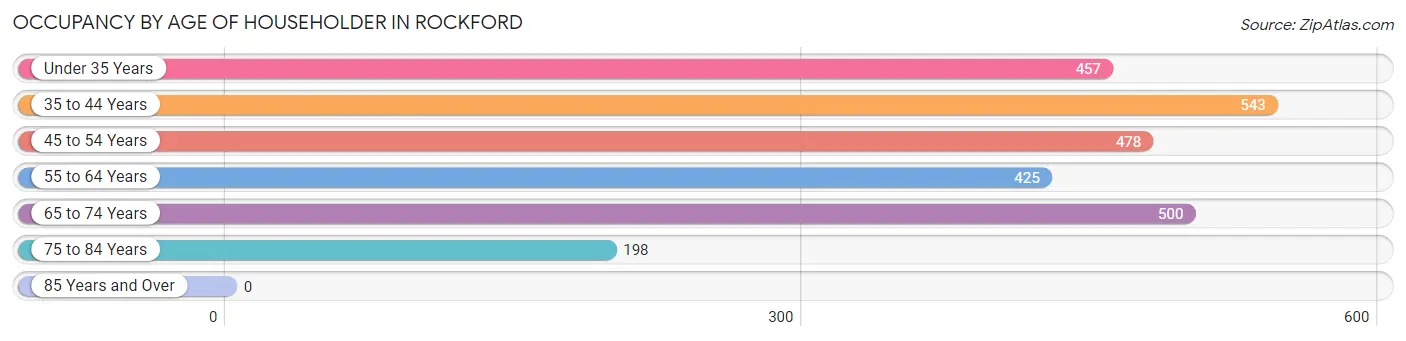
| Age Bracket | # Households | % Households |
| Under 35 Years | 457 | 17.6% |
| 35 to 44 Years | 543 | 20.9% |
| 45 to 54 Years | 478 | 18.4% |
| 55 to 64 Years | 425 | 16.3% |
| 65 to 74 Years | 500 | 19.2% |
| 75 to 84 Years | 198 | 7.6% |
| 85 Years and Over | 0 | 0.0% |
| Total | 2,601 | 100.0% |
Housing Finances in Rockford
Median Income by Occupancy in Rockford
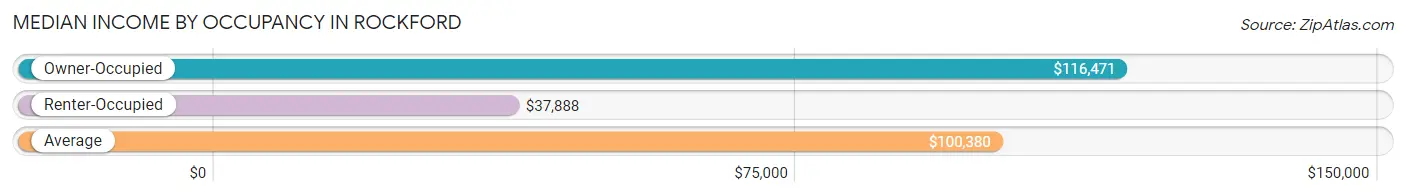
| Occupancy Type | # Households | Median Income |
| Owner-Occupied | 1,976 (76.0%) | $116,471 |
| Renter-Occupied | 625 (24.0%) | $37,888 |
| Average | 2,601 (100.0%) | $100,380 |
Occupancy by Householder Income Bracket in Rockford
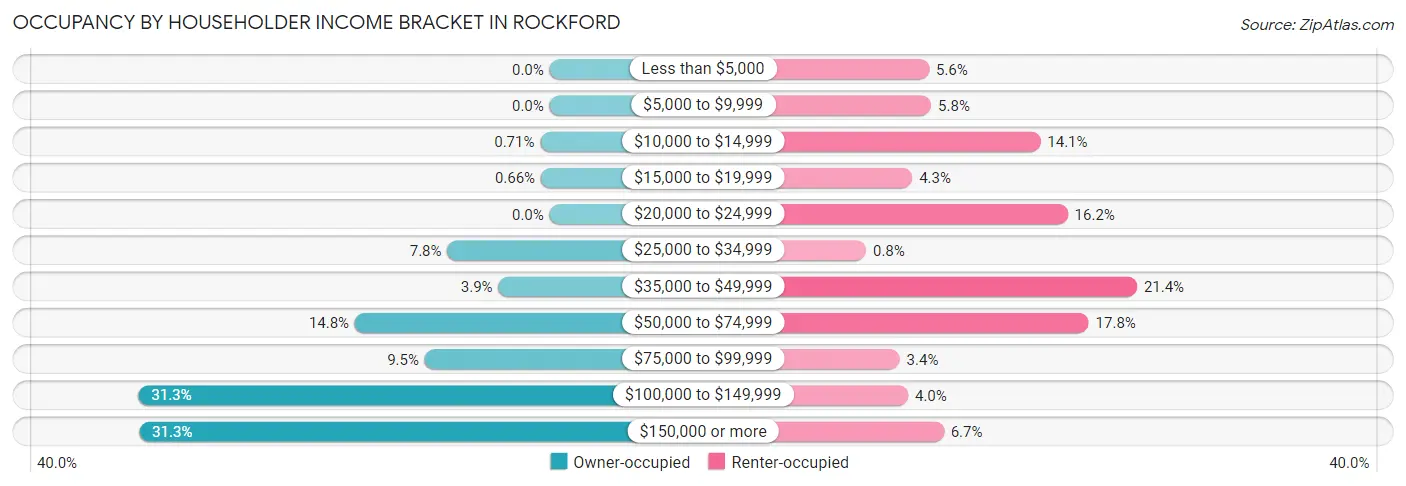
| Income Bracket | Owner-occupied | Renter-occupied |
| Less than $5,000 | 0 (0.0%) | 35 (5.6%) |
| $5,000 to $9,999 | 0 (0.0%) | 36 (5.8%) |
| $10,000 to $14,999 | 14 (0.7%) | 88 (14.1%) |
| $15,000 to $19,999 | 13 (0.7%) | 27 (4.3%) |
| $20,000 to $24,999 | 0 (0.0%) | 101 (16.2%) |
| $25,000 to $34,999 | 154 (7.8%) | 5 (0.8%) |
| $35,000 to $49,999 | 77 (3.9%) | 134 (21.4%) |
| $50,000 to $74,999 | 293 (14.8%) | 111 (17.8%) |
| $75,000 to $99,999 | 188 (9.5%) | 21 (3.4%) |
| $100,000 to $149,999 | 619 (31.3%) | 25 (4.0%) |
| $150,000 or more | 618 (31.3%) | 42 (6.7%) |
| Total | 1,976 (100.0%) | 625 (100.0%) |
Monthly Housing Cost Tiers in Rockford
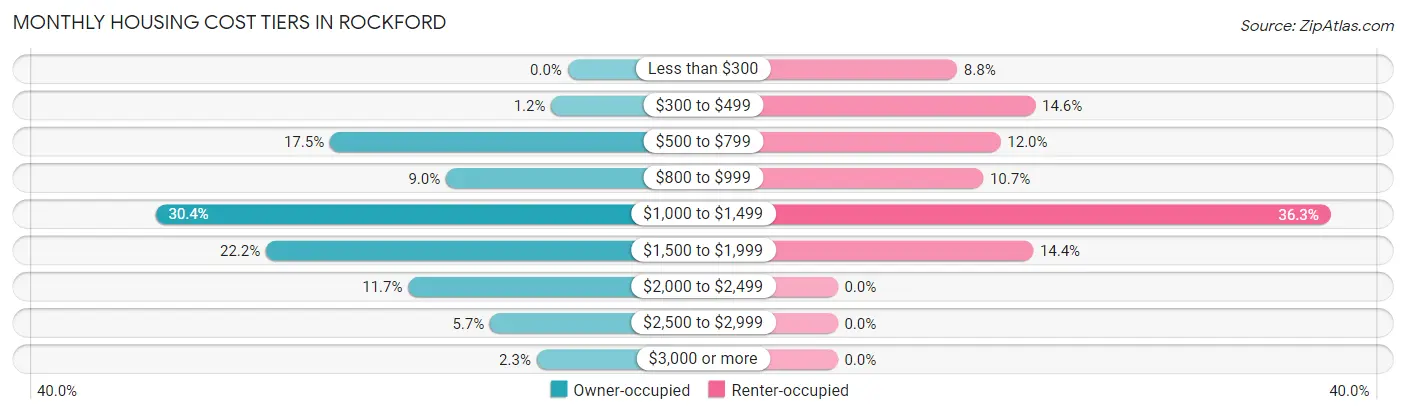
| Monthly Cost | Owner-occupied | Renter-occupied |
| Less than $300 | 0 (0.0%) | 55 (8.8%) |
| $300 to $499 | 24 (1.2%) | 91 (14.6%) |
| $500 to $799 | 346 (17.5%) | 75 (12.0%) |
| $800 to $999 | 177 (9.0%) | 67 (10.7%) |
| $1,000 to $1,499 | 600 (30.4%) | 227 (36.3%) |
| $1,500 to $1,999 | 439 (22.2%) | 90 (14.4%) |
| $2,000 to $2,499 | 232 (11.7%) | 0 (0.0%) |
| $2,500 to $2,999 | 113 (5.7%) | 0 (0.0%) |
| $3,000 or more | 45 (2.3%) | 0 (0.0%) |
| Total | 1,976 (100.0%) | 625 (100.0%) |
Physical Housing Characteristics in Rockford
Housing Structures in Rockford
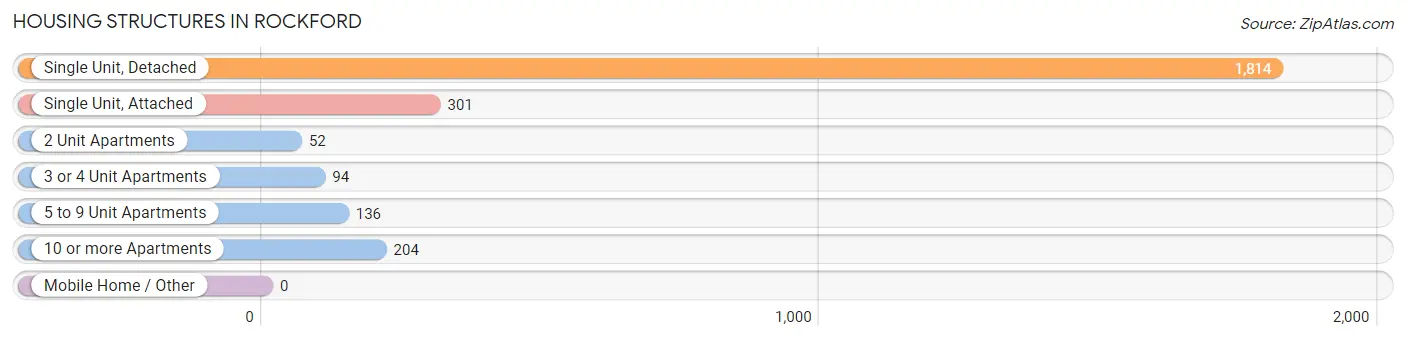
| Structure Type | # Housing Units | % Housing Units |
| Single Unit, Detached | 1,814 | 69.7% |
| Single Unit, Attached | 301 | 11.6% |
| 2 Unit Apartments | 52 | 2.0% |
| 3 or 4 Unit Apartments | 94 | 3.6% |
| 5 to 9 Unit Apartments | 136 | 5.2% |
| 10 or more Apartments | 204 | 7.8% |
| Mobile Home / Other | 0 | 0.0% |
| Total | 2,601 | 100.0% |
Housing Structures by Occupancy in Rockford
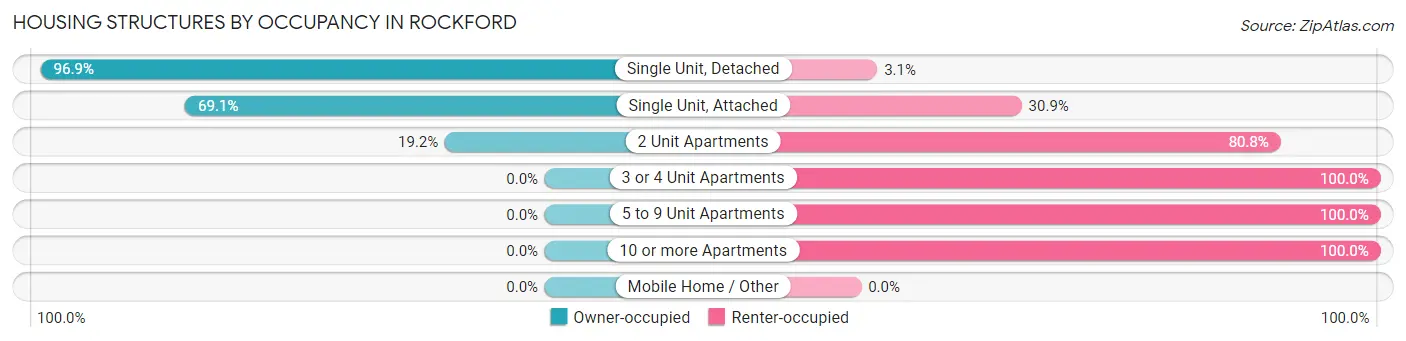
| Structure Type | Owner-occupied | Renter-occupied |
| Single Unit, Detached | 1,758 (96.9%) | 56 (3.1%) |
| Single Unit, Attached | 208 (69.1%) | 93 (30.9%) |
| 2 Unit Apartments | 10 (19.2%) | 42 (80.8%) |
| 3 or 4 Unit Apartments | 0 (0.0%) | 94 (100.0%) |
| 5 to 9 Unit Apartments | 0 (0.0%) | 136 (100.0%) |
| 10 or more Apartments | 0 (0.0%) | 204 (100.0%) |
| Mobile Home / Other | 0 (0.0%) | 0 (0.0%) |
| Total | 1,976 (76.0%) | 625 (24.0%) |
Housing Structures by Number of Rooms in Rockford
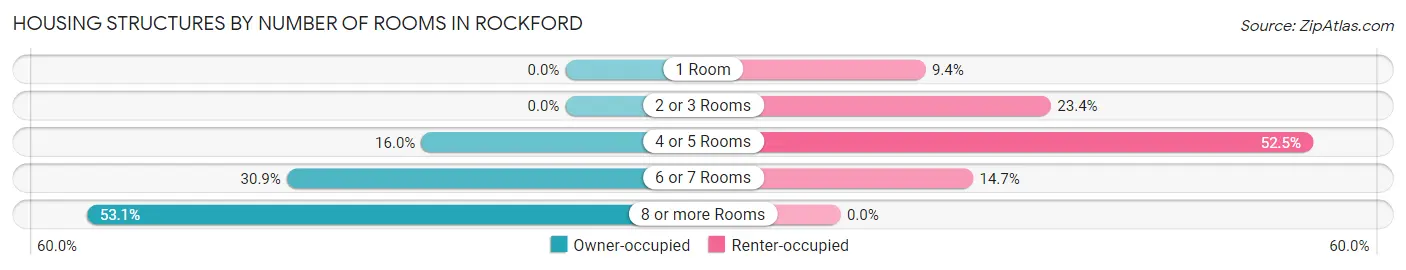
| Number of Rooms | Owner-occupied | Renter-occupied |
| 1 Room | 0 (0.0%) | 59 (9.4%) |
| 2 or 3 Rooms | 0 (0.0%) | 146 (23.4%) |
| 4 or 5 Rooms | 316 (16.0%) | 328 (52.5%) |
| 6 or 7 Rooms | 611 (30.9%) | 92 (14.7%) |
| 8 or more Rooms | 1,049 (53.1%) | 0 (0.0%) |
| Total | 1,976 (100.0%) | 625 (100.0%) |
Housing Structure by Heating Type in Rockford
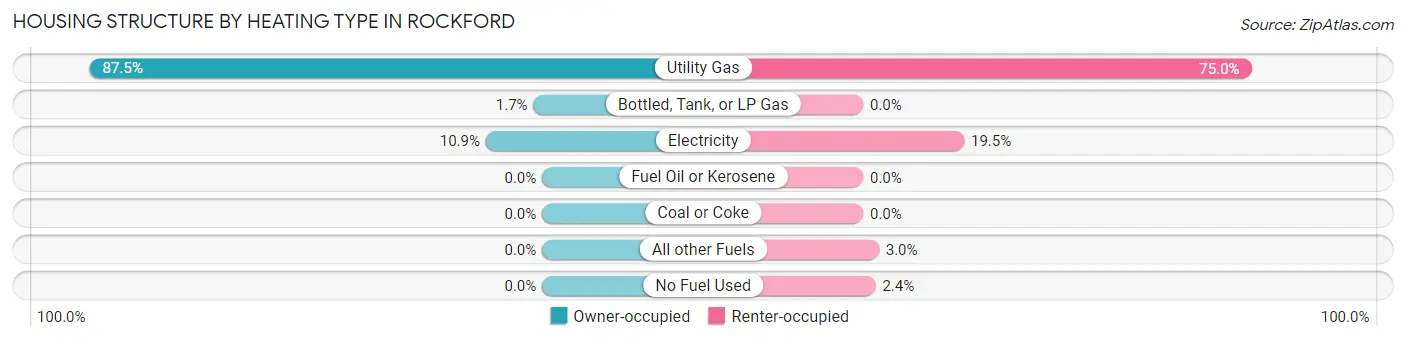
| Heating Type | Owner-occupied | Renter-occupied |
| Utility Gas | 1,728 (87.5%) | 469 (75.0%) |
| Bottled, Tank, or LP Gas | 33 (1.7%) | 0 (0.0%) |
| Electricity | 215 (10.9%) | 122 (19.5%) |
| Fuel Oil or Kerosene | 0 (0.0%) | 0 (0.0%) |
| Coal or Coke | 0 (0.0%) | 0 (0.0%) |
| All other Fuels | 0 (0.0%) | 19 (3.0%) |
| No Fuel Used | 0 (0.0%) | 15 (2.4%) |
| Total | 1,976 (100.0%) | 625 (100.0%) |
Household Vehicle Usage in Rockford
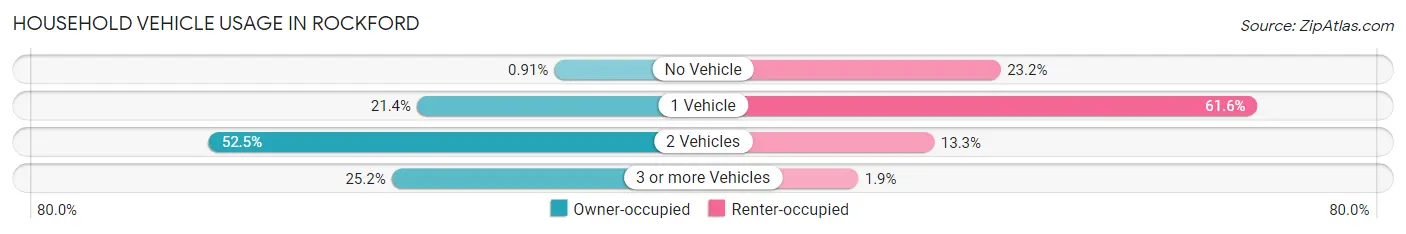
| Vehicles per Household | Owner-occupied | Renter-occupied |
| No Vehicle | 18 (0.9%) | 145 (23.2%) |
| 1 Vehicle | 423 (21.4%) | 385 (61.6%) |
| 2 Vehicles | 1,037 (52.5%) | 83 (13.3%) |
| 3 or more Vehicles | 498 (25.2%) | 12 (1.9%) |
| Total | 1,976 (100.0%) | 625 (100.0%) |
Real Estate & Mortgages in Rockford
Real Estate and Mortgage Overview in Rockford
| Characteristic | Without Mortgage | With Mortgage |
| Housing Units | 479 | 1,497 |
| Median Property Value | $283,900 | $245,300 |
| Median Household Income | $107,734 | $466 |
| Monthly Housing Costs | $726 | $45 |
| Real Estate Taxes | $4,335 | $112 |
Property Value by Mortgage Status in Rockford
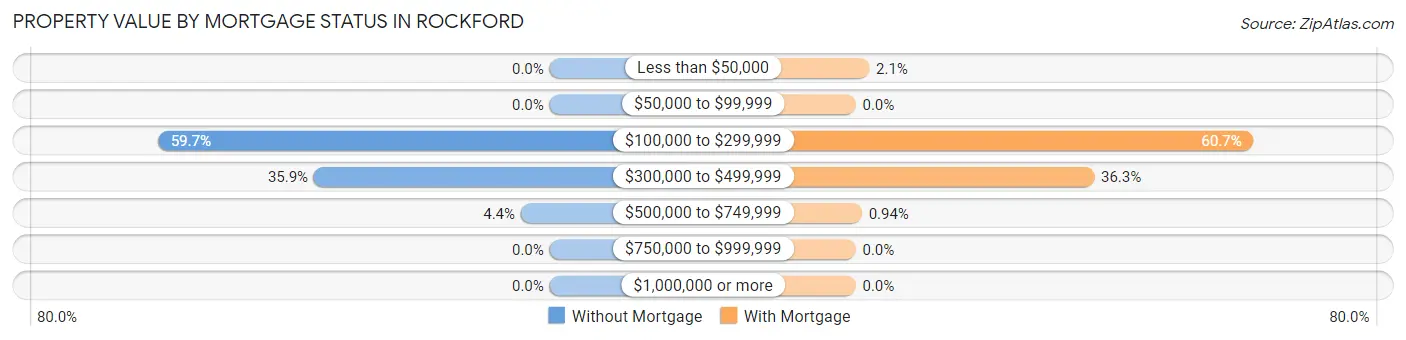
| Property Value | Without Mortgage | With Mortgage |
| Less than $50,000 | 0 (0.0%) | 31 (2.1%) |
| $50,000 to $99,999 | 0 (0.0%) | 0 (0.0%) |
| $100,000 to $299,999 | 286 (59.7%) | 908 (60.7%) |
| $300,000 to $499,999 | 172 (35.9%) | 544 (36.3%) |
| $500,000 to $749,999 | 21 (4.4%) | 14 (0.9%) |
| $750,000 to $999,999 | 0 (0.0%) | 0 (0.0%) |
| $1,000,000 or more | 0 (0.0%) | 0 (0.0%) |
| Total | 479 (100.0%) | 1,497 (100.0%) |
Household Income by Mortgage Status in Rockford
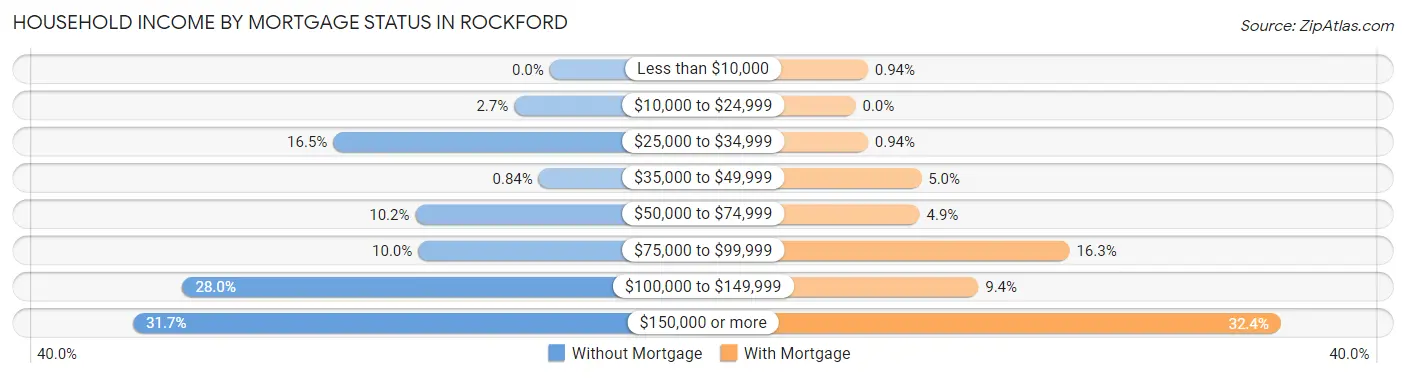
| Household Income | Without Mortgage | With Mortgage |
| Less than $10,000 | 0 (0.0%) | 14 (0.9%) |
| $10,000 to $24,999 | 13 (2.7%) | 0 (0.0%) |
| $25,000 to $34,999 | 79 (16.5%) | 14 (0.9%) |
| $35,000 to $49,999 | 4 (0.8%) | 75 (5.0%) |
| $50,000 to $74,999 | 49 (10.2%) | 73 (4.9%) |
| $75,000 to $99,999 | 48 (10.0%) | 244 (16.3%) |
| $100,000 to $149,999 | 134 (28.0%) | 140 (9.3%) |
| $150,000 or more | 152 (31.7%) | 485 (32.4%) |
| Total | 479 (100.0%) | 1,497 (100.0%) |
Property Value to Household Income Ratio in Rockford
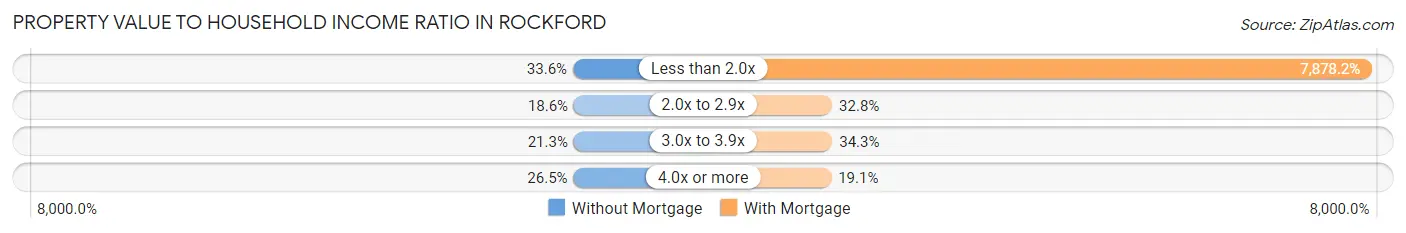
| Value-to-Income Ratio | Without Mortgage | With Mortgage |
| Less than 2.0x | 161 (33.6%) | 117,936 (7,878.2%) |
| 2.0x to 2.9x | 89 (18.6%) | 491 (32.8%) |
| 3.0x to 3.9x | 102 (21.3%) | 513 (34.3%) |
| 4.0x or more | 127 (26.5%) | 286 (19.1%) |
| Total | 479 (100.0%) | 1,497 (100.0%) |
Real Estate Taxes by Mortgage Status in Rockford
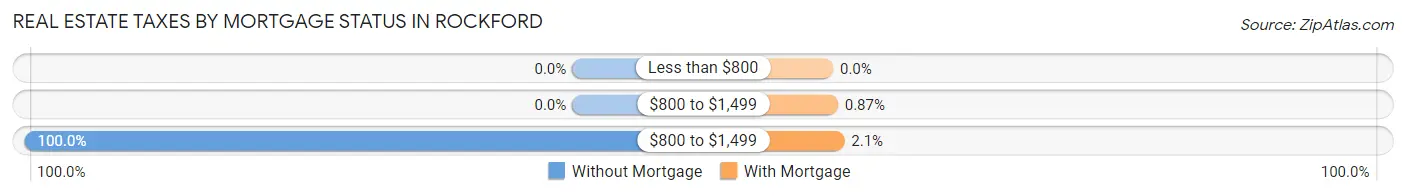
| Property Taxes | Without Mortgage | With Mortgage |
| Less than $800 | 0 (0.0%) | 0 (0.0%) |
| $800 to $1,499 | 0 (0.0%) | 13 (0.9%) |
| $800 to $1,499 | 479 (100.0%) | 31 (2.1%) |
| Total | 479 (100.0%) | 1,497 (100.0%) |
Health & Disability in Rockford
Health Insurance Coverage by Age in Rockford
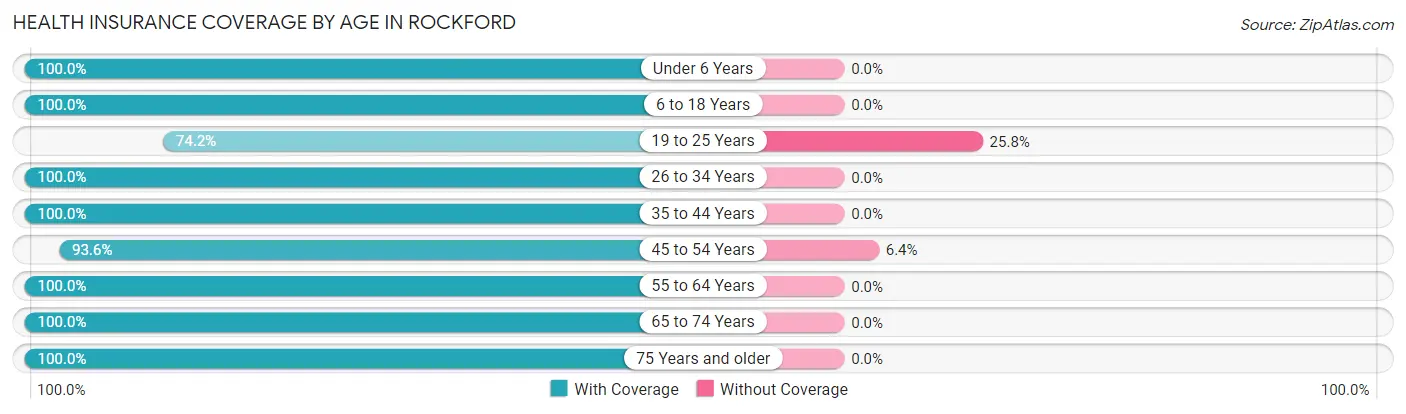
| Age Bracket | With Coverage | Without Coverage |
| Under 6 Years | 461 (100.0%) | 0 (0.0%) |
| 6 to 18 Years | 1,174 (100.0%) | 0 (0.0%) |
| 19 to 25 Years | 256 (74.2%) | 89 (25.8%) |
| 26 to 34 Years | 597 (100.0%) | 0 (0.0%) |
| 35 to 44 Years | 1,001 (100.0%) | 0 (0.0%) |
| 45 to 54 Years | 742 (93.6%) | 51 (6.4%) |
| 55 to 64 Years | 884 (100.0%) | 0 (0.0%) |
| 65 to 74 Years | 656 (100.0%) | 0 (0.0%) |
| 75 Years and older | 219 (100.0%) | 0 (0.0%) |
| Total | 5,990 (97.7%) | 140 (2.3%) |
Health Insurance Coverage by Citizenship Status in Rockford
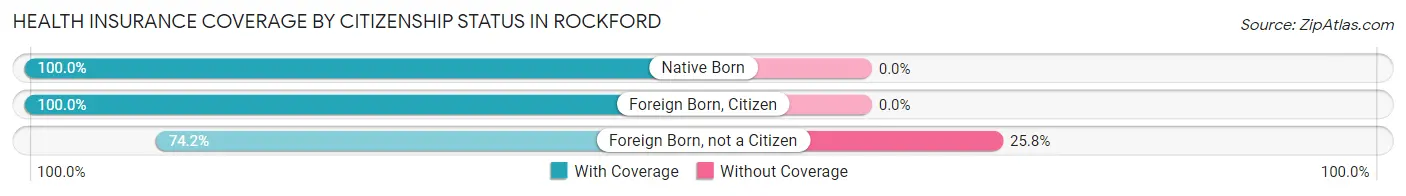
| Citizenship Status | With Coverage | Without Coverage |
| Native Born | 461 (100.0%) | 0 (0.0%) |
| Foreign Born, Citizen | 1,174 (100.0%) | 0 (0.0%) |
| Foreign Born, not a Citizen | 256 (74.2%) | 89 (25.8%) |
Health Insurance Coverage by Household Income in Rockford
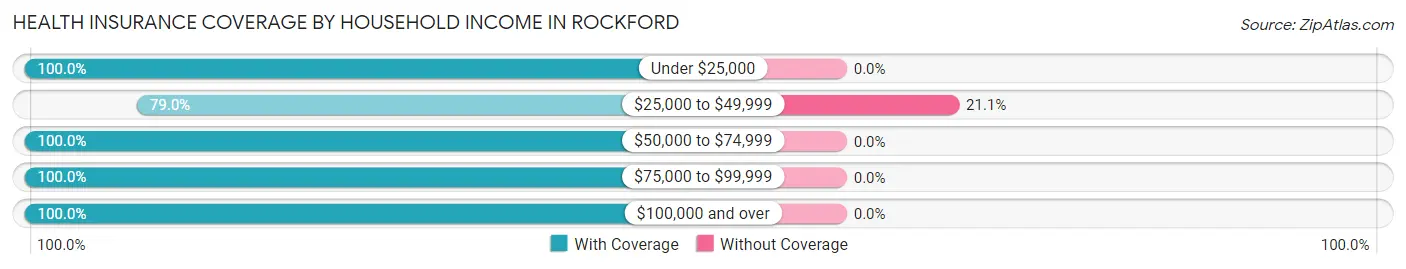
| Household Income | With Coverage | Without Coverage |
| Under $25,000 | 504 (100.0%) | 0 (0.0%) |
| $25,000 to $49,999 | 525 (78.9%) | 140 (21.0%) |
| $50,000 to $74,999 | 699 (100.0%) | 0 (0.0%) |
| $75,000 to $99,999 | 503 (100.0%) | 0 (0.0%) |
| $100,000 and over | 3,733 (100.0%) | 0 (0.0%) |
Public vs Private Health Insurance Coverage by Age in Rockford
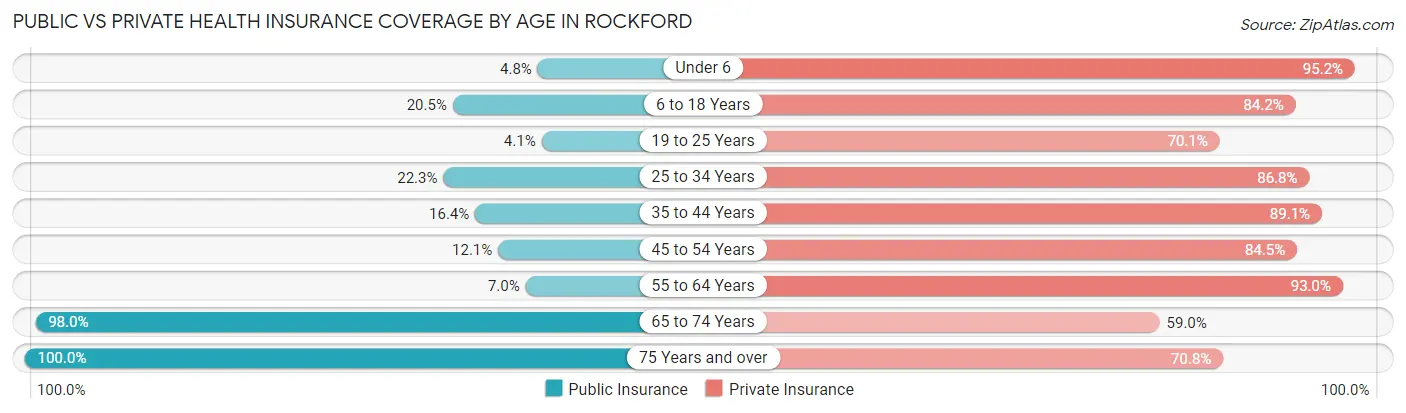
| Age Bracket | Public Insurance | Private Insurance |
| Under 6 | 22 (4.8%) | 439 (95.2%) |
| 6 to 18 Years | 241 (20.5%) | 989 (84.2%) |
| 19 to 25 Years | 14 (4.1%) | 242 (70.1%) |
| 25 to 34 Years | 133 (22.3%) | 518 (86.8%) |
| 35 to 44 Years | 164 (16.4%) | 892 (89.1%) |
| 45 to 54 Years | 96 (12.1%) | 670 (84.5%) |
| 55 to 64 Years | 62 (7.0%) | 822 (93.0%) |
| 65 to 74 Years | 643 (98.0%) | 387 (59.0%) |
| 75 Years and over | 219 (100.0%) | 155 (70.8%) |
| Total | 1,594 (26.0%) | 5,114 (83.4%) |
Disability Status by Sex by Age in Rockford
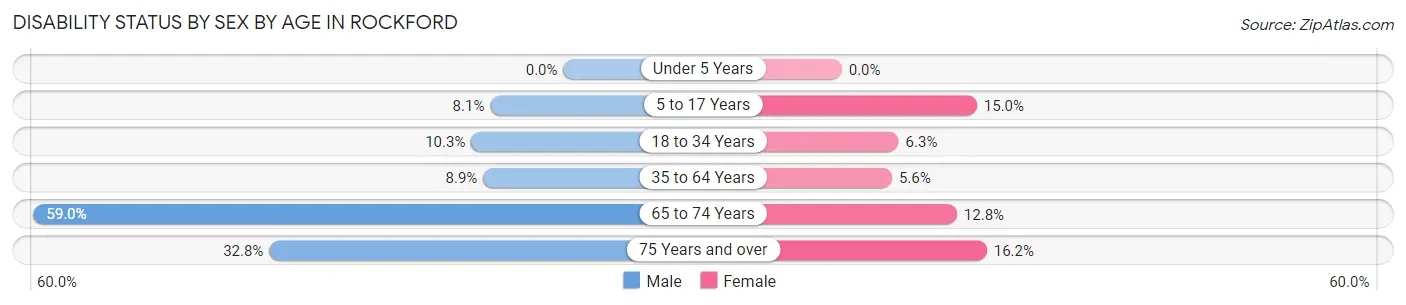
| Age Bracket | Male | Female |
| Under 5 Years | 0 (0.0%) | 0 (0.0%) |
| 5 to 17 Years | 43 (8.1%) | 85 (15.0%) |
| 18 to 34 Years | 64 (10.3%) | 31 (6.3%) |
| 35 to 64 Years | 129 (8.9%) | 69 (5.6%) |
| 65 to 74 Years | 157 (59.0%) | 50 (12.8%) |
| 75 Years and over | 19 (32.8%) | 26 (16.2%) |
Disability Class by Sex by Age in Rockford
Disability Class: Hearing Difficulty
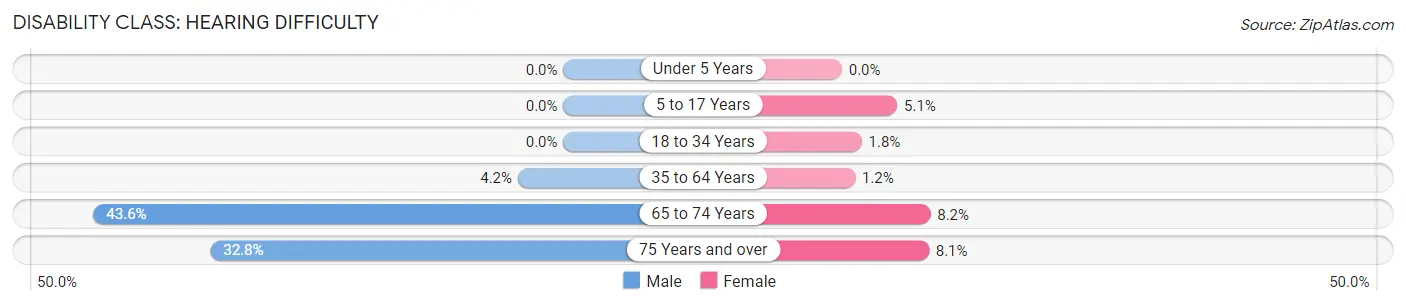
| Age Bracket | Male | Female |
| Under 5 Years | 0 (0.0%) | 0 (0.0%) |
| 5 to 17 Years | 0 (0.0%) | 29 (5.1%) |
| 18 to 34 Years | 0 (0.0%) | 9 (1.8%) |
| 35 to 64 Years | 61 (4.2%) | 15 (1.2%) |
| 65 to 74 Years | 116 (43.6%) | 32 (8.2%) |
| 75 Years and over | 19 (32.8%) | 13 (8.1%) |
Disability Class: Vision Difficulty
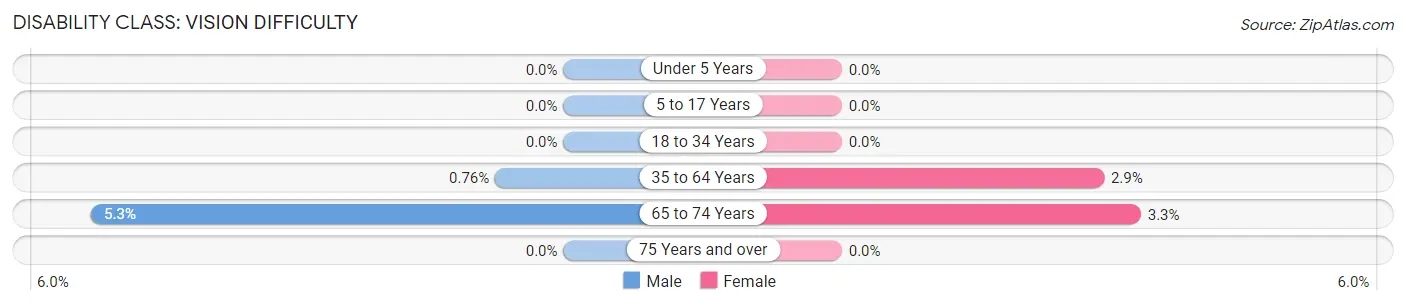
| Age Bracket | Male | Female |
| Under 5 Years | 0 (0.0%) | 0 (0.0%) |
| 5 to 17 Years | 0 (0.0%) | 0 (0.0%) |
| 18 to 34 Years | 0 (0.0%) | 0 (0.0%) |
| 35 to 64 Years | 11 (0.8%) | 36 (2.9%) |
| 65 to 74 Years | 14 (5.3%) | 13 (3.3%) |
| 75 Years and over | 0 (0.0%) | 0 (0.0%) |
Disability Class: Cognitive Difficulty
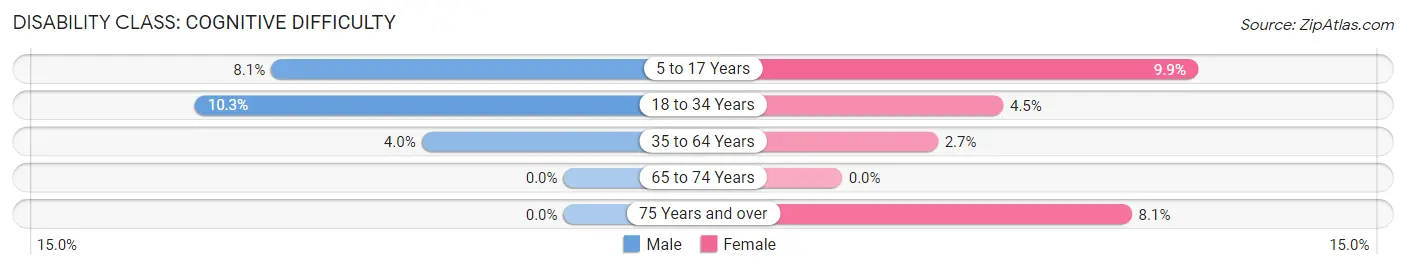
| Age Bracket | Male | Female |
| 5 to 17 Years | 43 (8.1%) | 56 (9.9%) |
| 18 to 34 Years | 64 (10.3%) | 22 (4.5%) |
| 35 to 64 Years | 57 (4.0%) | 33 (2.7%) |
| 65 to 74 Years | 0 (0.0%) | 0 (0.0%) |
| 75 Years and over | 0 (0.0%) | 13 (8.1%) |
Disability Class: Ambulatory Difficulty
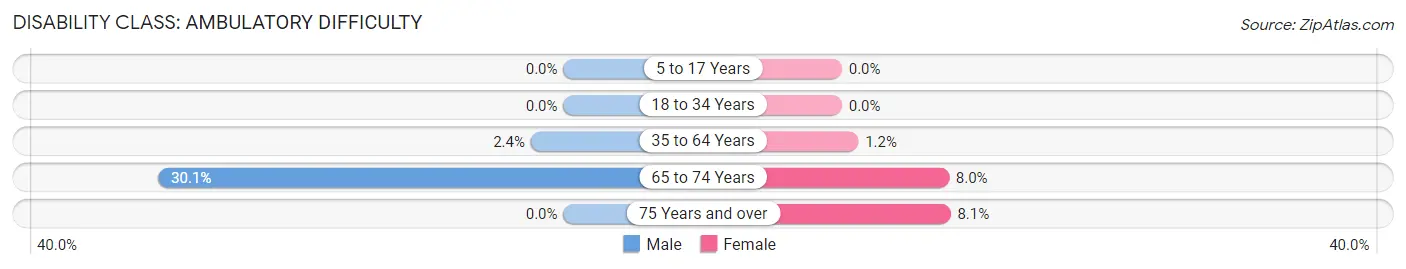
| Age Bracket | Male | Female |
| 5 to 17 Years | 0 (0.0%) | 0 (0.0%) |
| 18 to 34 Years | 0 (0.0%) | 0 (0.0%) |
| 35 to 64 Years | 35 (2.4%) | 15 (1.2%) |
| 65 to 74 Years | 80 (30.1%) | 31 (8.0%) |
| 75 Years and over | 0 (0.0%) | 13 (8.1%) |
Disability Class: Self-Care Difficulty
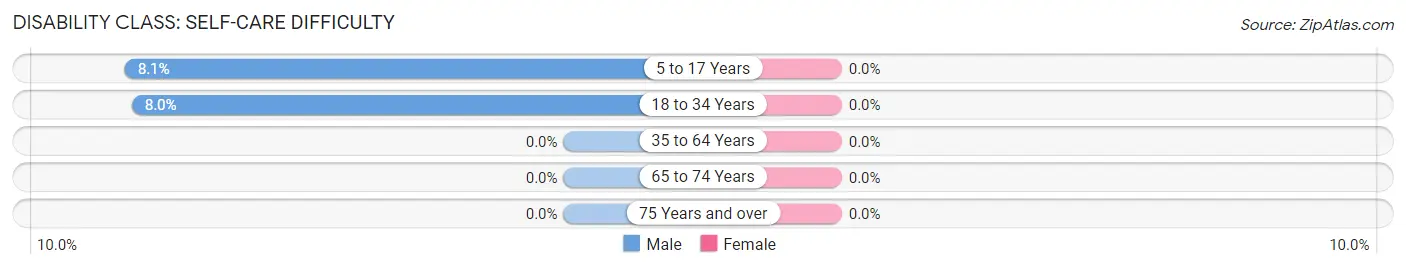
| Age Bracket | Male | Female |
| 5 to 17 Years | 43 (8.1%) | 0 (0.0%) |
| 18 to 34 Years | 50 (8.0%) | 0 (0.0%) |
| 35 to 64 Years | 0 (0.0%) | 0 (0.0%) |
| 65 to 74 Years | 0 (0.0%) | 0 (0.0%) |
| 75 Years and over | 0 (0.0%) | 0 (0.0%) |
Technology Access in Rockford
Computing Device Access in Rockford
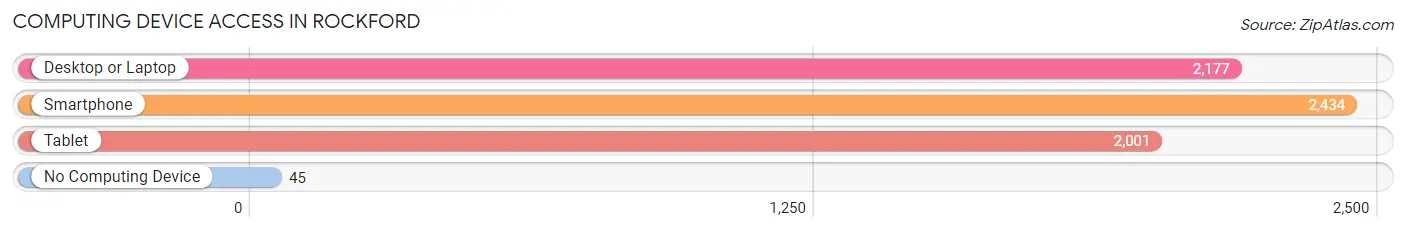
| Device Type | # Households | % Households |
| Desktop or Laptop | 2,177 | 83.7% |
| Smartphone | 2,434 | 93.6% |
| Tablet | 2,001 | 76.9% |
| No Computing Device | 45 | 1.7% |
| Total | 2,601 | 100.0% |
Internet Access in Rockford
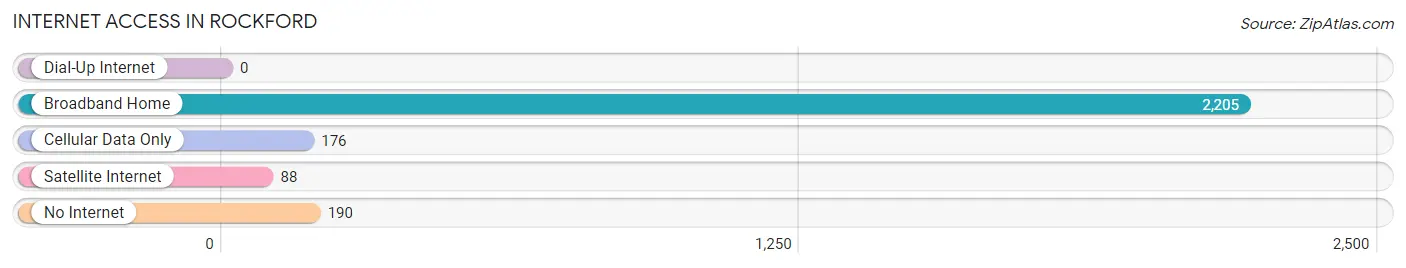
| Internet Type | # Households | % Households |
| Dial-Up Internet | 0 | 0.0% |
| Broadband Home | 2,205 | 84.8% |
| Cellular Data Only | 176 | 6.8% |
| Satellite Internet | 88 | 3.4% |
| No Internet | 190 | 7.3% |
| Total | 2,601 | 100.0% |
Rockford Summary
Rockford, Michigan is a small city located in Kent County, Michigan, United States. It is situated on the banks of the Rogue River, approximately 15 miles north of Grand Rapids. The city has a population of 5,719 as of the 2010 census, making it the second largest city in Kent County.
Rockford was first settled in 1851 by a group of settlers from New York. The city was named after Rockford, Illinois, which was the hometown of one of the settlers. The city was incorporated in 1866 and has since grown to become a thriving community.
Geography
Rockford is located at 42°59'N 85°37'W (42.983, -85.619). According to the United States Census Bureau, the city has a total area of 4.2 square miles (10.8 km2), all land.
The city is situated on the banks of the Rogue River, which is a tributary of the Grand River. The river is a popular destination for fishing, canoeing, and kayaking. The city is also home to several parks, including the Rockford Dam Park, which offers a variety of recreational activities.
Economy
Rockford is home to a variety of businesses, including manufacturing, retail, and service industries. The city is also home to several large employers, including Wolverine World Wide, a global footwear and apparel company, and Amway, a multi-level marketing company.
The city is also home to several small businesses, including restaurants, shops, and other services. The city is also home to several educational institutions, including Rockford Public Schools, Rockford University, and Cornerstone University.
Demographics
As of the 2010 census, there were 5,719 people, 2,093 households, and 1,521 families residing in the city. The population density was 1,364.2 people per square mile (526.7/km2). There were 2,309 housing units at an average density of 551.3 per square mile (212.7/km2). The racial makeup of the city was 94.2% White, 1.2% African American, 0.3% Native American, 1.2% Asian, 0.1% Pacific Islander, 1.2% from other races, and 1.9% from two or more races. Hispanic or Latino of any race were 3.3% of the population.
There were 2,093 households, out of which 37.2% had children under the age of 18 living with them, 54.2% were married couples living together, 11.7% had a female householder with no husband present, and 29.2% were non-families. 24.2% of all households were made up of individuals, and 9.2% had someone living alone who was 65 years of age or older. The average household size was 2.68 and the average family size was 3.20.
In the city, the population was spread out, with 28.2% under the age of 18, 8.2% from 18 to 24, 30.2% from 25 to 44, 21.7% from 45 to 64, and 11.7% who were 65 years of age or older. The median age was 35 years. For every 100 females, there were 95.2 males. For every 100 females age 18 and over, there were 92.2 males.
The median income for a household in the city was $50,945, and the median income for a family was $60,945. Males had a median income of $41,945 versus $30,945 for females. The per capita income for the city was $23,945. About 4.2% of families and 6.2% of the population were below the poverty line, including 8.2% of those under age 18 and 4.2% of those age 65 or over.
Common Questions
What is Per Capita Income in Rockford?
Per Capita income in Rockford is $51,801.
What is the Median Family Income in Rockford?
Median Family Income in Rockford is $109,529.
What is the Median Household income in Rockford?
Median Household Income in Rockford is $100,380.
What is Income or Wage Gap in Rockford?
Income or Wage Gap in Rockford is 25.2%.
Women in Rockford earn 74.8 cents for every dollar earned by a man.
What is Inequality or Gini Index in Rockford?
Inequality or Gini Index in Rockford is 0.45.
What is the Total Population of Rockford?
Total Population of Rockford is 6,144.
What is the Total Male Population of Rockford?
Total Male Population of Rockford is 3,087.
What is the Total Female Population of Rockford?
Total Female Population of Rockford is 3,057.
What is the Ratio of Males per 100 Females in Rockford?
There are 100.98 Males per 100 Females in Rockford.
What is the Ratio of Females per 100 Males in Rockford?
There are 99.03 Females per 100 Males in Rockford.
What is the Median Population Age in Rockford?
Median Population Age in Rockford is 40.3 Years.
What is the Average Family Size in Rockford
Average Family Size in Rockford is 2.9 People.
What is the Average Household Size in Rockford
Average Household Size in Rockford is 2.4 People.
How Large is the Labor Force in Rockford?
There are 3,635 People in the Labor Forcein in Rockford.
What is the Percentage of People in the Labor Force in Rockford?
75.5% of People are in the Labor Force in Rockford.
What is the Unemployment Rate in Rockford?
Unemployment Rate in Rockford is 8.4%.