Zip Codes with the Highest Percentage of Households with Income Above $200,000 in Dearborn, MI
RELATED REPORTS & OPTIONS
Household Income | $200k+
Dearborn
Compare Zip Codes
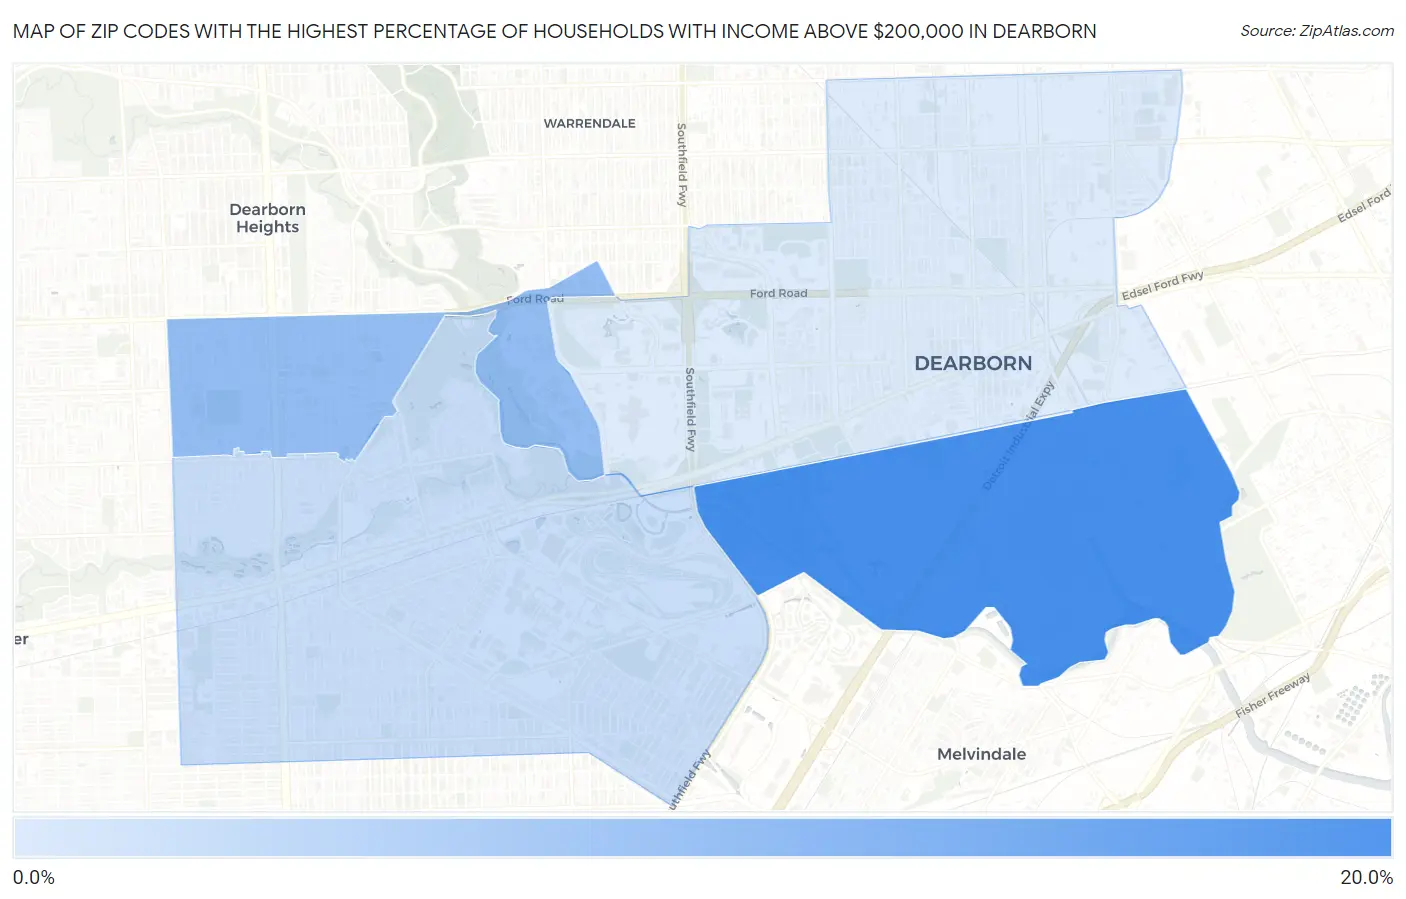
Map of Zip Codes with the Highest Percentage of Households with Income Above $200,000 in Dearborn
4.7%
17.2%
Zip Codes with the Highest Percentage of Households with Income Above $200,000 in Dearborn, MI
| Zip Code | Households with Income > $200k | vs State | vs National | |
| 1. | 48120 | 17.2% | 8.2%(+9.00)#64 | 11.4%(+5.80)#4,118 |
| 2. | 48128 | 10.7% | 8.2%(+2.50)#159 | 11.4%(-0.700)#7,639 |
| 3. | 48124 | 6.4% | 8.2%(-1.80)#305 | 11.4%(-5.00)#12,720 |
| 4. | 48126 | 4.7% | 8.2%(-3.50)#415 | 11.4%(-6.70)#16,253 |
1
Common Questions
What are the Top 3 Zip Codes with the Highest Percentage of Households with Income Above $200,000 in Dearborn, MI?
Top 3 Zip Codes with the Highest Percentage of Households with Income Above $200,000 in Dearborn, MI are:
What zip code has the Highest Percentage of Households with Income Above $200,000 in Dearborn, MI?
48120 has the Highest Percentage of Households with Income Above $200,000 in Dearborn, MI with 17.2%.
What is the Percentage of Households with Income Above $200,000 in Dearborn, MI?
Percentage of Households with Income Above $200,000 in Dearborn is 7.0%.
What is the Percentage of Households with Income Above $200,000 in Michigan?
Percentage of Households with Income Above $200,000 in Michigan is 8.2%.
What is the Percentage of Households with Income Above $200,000 in the United States?
Percentage of Households with Income Above $200,000 in the United States is 11.4%.