Fruitport, MI Map & Demographics
Fruitport Map
Fruitport Overview
$62,185
PER CAPITA INCOME
$79,375
AVG FAMILY INCOME
$79,375
AVG HOUSEHOLD INCOME
49.7%
WAGE / INCOME GAP [ % ]
50.3¢/ $1
WAGE / INCOME GAP [ $ ]
0.61
INEQUALITY / GINI INDEX
1,388
TOTAL POPULATION
691
MALE POPULATION
697
FEMALE POPULATION
99.14
MALES / 100 FEMALES
100.87
FEMALES / 100 MALES
38.1
MEDIAN AGE
3.4
AVG FAMILY SIZE
2.9
AVG HOUSEHOLD SIZE
660
LABOR FORCE [ PEOPLE ]
64.0%
PERCENT IN LABOR FORCE
5.9%
UNEMPLOYMENT RATE
Fruitport Zip Codes
Fruitport Area Codes
Income in Fruitport
Income Overview in Fruitport
Per Capita Income in Fruitport is $62,185, while median incomes of families and households are $79,375 and $79,375 respectively.
| Characteristic | Number | Measure |
| Per Capita Income | 1,388 | $62,185 |
| Median Family Income | 369 | $79,375 |
| Mean Family Income | 369 | $100,223 |
| Median Household Income | 487 | $79,375 |
| Mean Household Income | 487 | $176,000 |
| Income Deficit | 369 | $0 |
| Wage / Income Gap (%) | 1,388 | 49.71% |
| Wage / Income Gap ($) | 1,388 | 50.29¢ per $1 |
| Gini / Inequality Index | 1,388 | 0.61 |
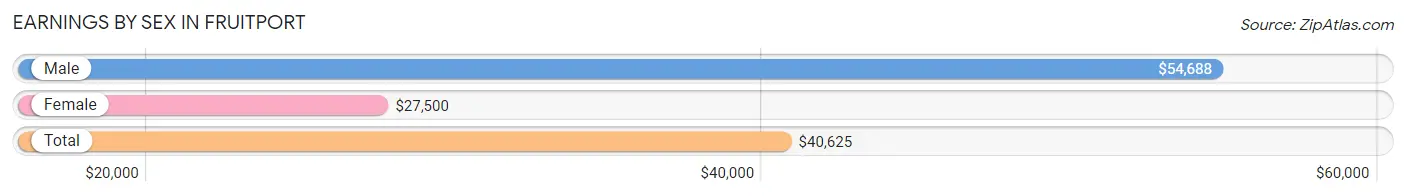
Earnings by Sex in Fruitport
Average Earnings in Fruitport are $40,625, $54,688 for men and $27,500 for women, a difference of 49.7%.
| Sex | Number | Average Earnings |
| Male | 345 (52.2%) | $54,688 |
| Female | 316 (47.8%) | $27,500 |
| Total | 661 (100.0%) | $40,625 |
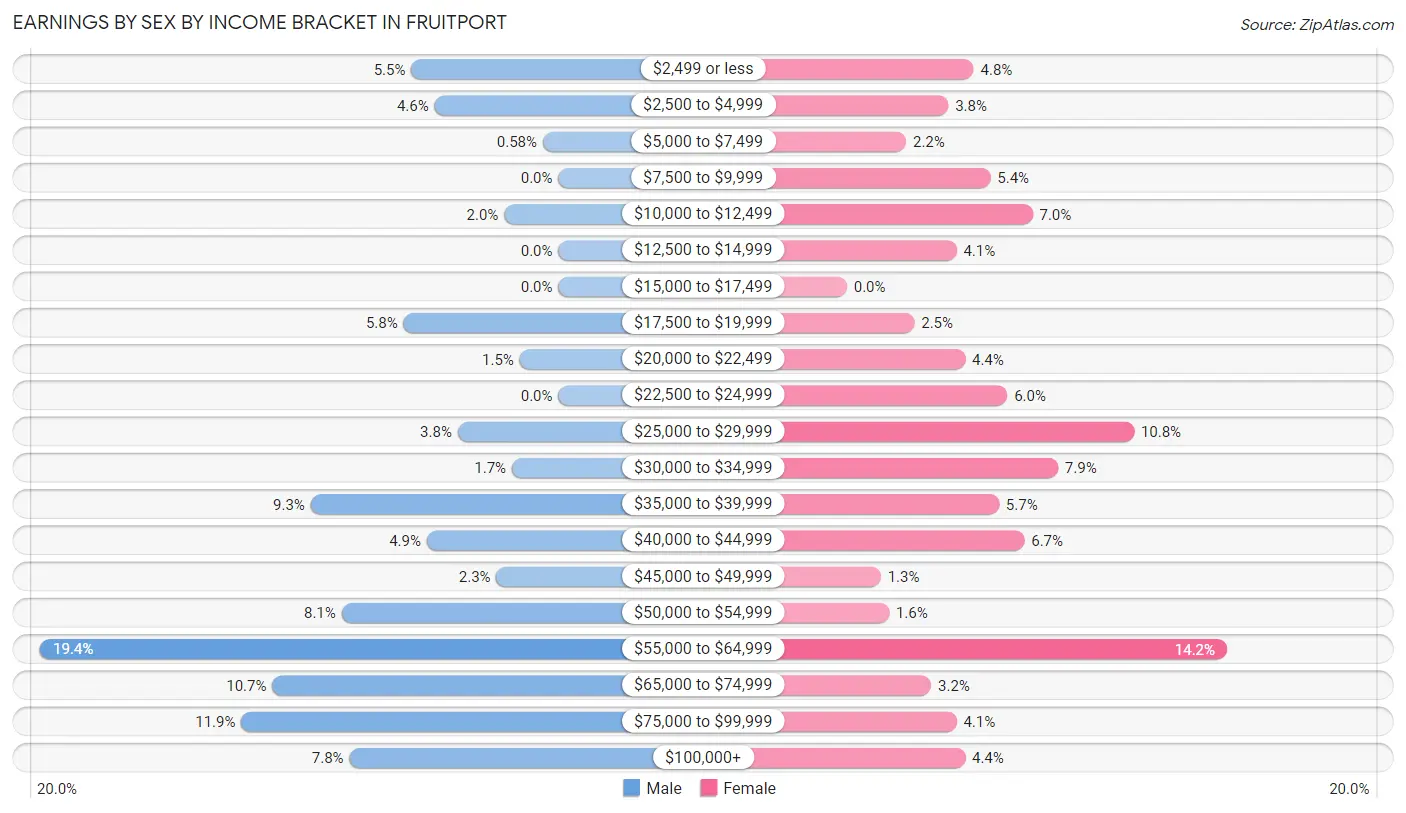
Earnings by Sex by Income Bracket in Fruitport
The most common earnings brackets in Fruitport are $55,000 to $64,999 for men (67 | 19.4%) and $55,000 to $64,999 for women (45 | 14.2%).
| Income | Male | Female |
| $2,499 or less | 19 (5.5%) | 15 (4.8%) |
| $2,500 to $4,999 | 16 (4.6%) | 12 (3.8%) |
| $5,000 to $7,499 | 2 (0.6%) | 7 (2.2%) |
| $7,500 to $9,999 | 0 (0.0%) | 17 (5.4%) |
| $10,000 to $12,499 | 7 (2.0%) | 22 (7.0%) |
| $12,500 to $14,999 | 0 (0.0%) | 13 (4.1%) |
| $15,000 to $17,499 | 0 (0.0%) | 0 (0.0%) |
| $17,500 to $19,999 | 20 (5.8%) | 8 (2.5%) |
| $20,000 to $22,499 | 5 (1.5%) | 14 (4.4%) |
| $22,500 to $24,999 | 0 (0.0%) | 19 (6.0%) |
| $25,000 to $29,999 | 13 (3.8%) | 34 (10.8%) |
| $30,000 to $34,999 | 6 (1.7%) | 25 (7.9%) |
| $35,000 to $39,999 | 32 (9.3%) | 18 (5.7%) |
| $40,000 to $44,999 | 17 (4.9%) | 21 (6.7%) |
| $45,000 to $49,999 | 8 (2.3%) | 4 (1.3%) |
| $50,000 to $54,999 | 28 (8.1%) | 5 (1.6%) |
| $55,000 to $64,999 | 67 (19.4%) | 45 (14.2%) |
| $65,000 to $74,999 | 37 (10.7%) | 10 (3.2%) |
| $75,000 to $99,999 | 41 (11.9%) | 13 (4.1%) |
| $100,000+ | 27 (7.8%) | 14 (4.4%) |
| Total | 345 (100.0%) | 316 (100.0%) |
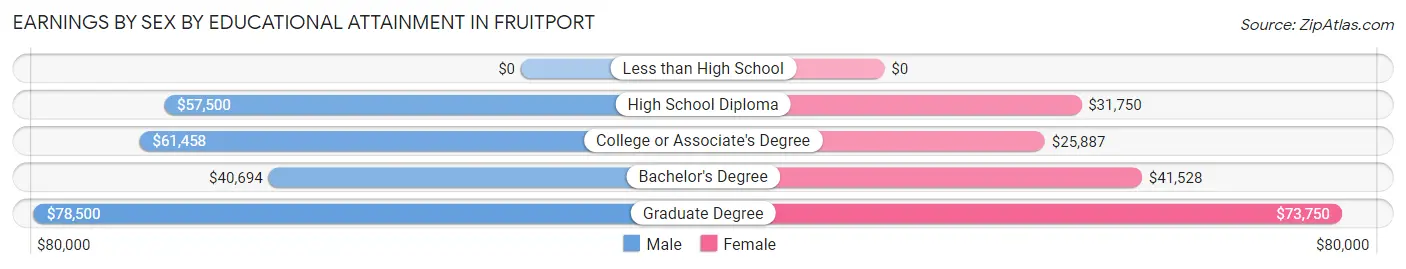
Earnings by Sex by Educational Attainment in Fruitport
Average earnings in Fruitport are $58,182 for men and $32,250 for women, a difference of 44.6%. Men with an educational attainment of graduate degree enjoy the highest average annual earnings of $78,500, while those with bachelor's degree education earn the least with $40,694. Women with an educational attainment of graduate degree earn the most with the average annual earnings of $73,750, while those with college or associate's degree education have the smallest earnings of $25,887.
| Educational Attainment | Male Income | Female Income |
| Less than High School | - | - |
| High School Diploma | $57,500 | $31,750 |
| College or Associate's Degree | $61,458 | $25,887 |
| Bachelor's Degree | $40,694 | $41,528 |
| Graduate Degree | $78,500 | $73,750 |
| Total | $58,182 | $32,250 |
Family Income in Fruitport
Family Income Brackets in Fruitport
According to the Fruitport family income data, there are 116 families falling into the $75,000 to $99,999 income range, which is the most common income bracket and makes up 31.4% of all families.
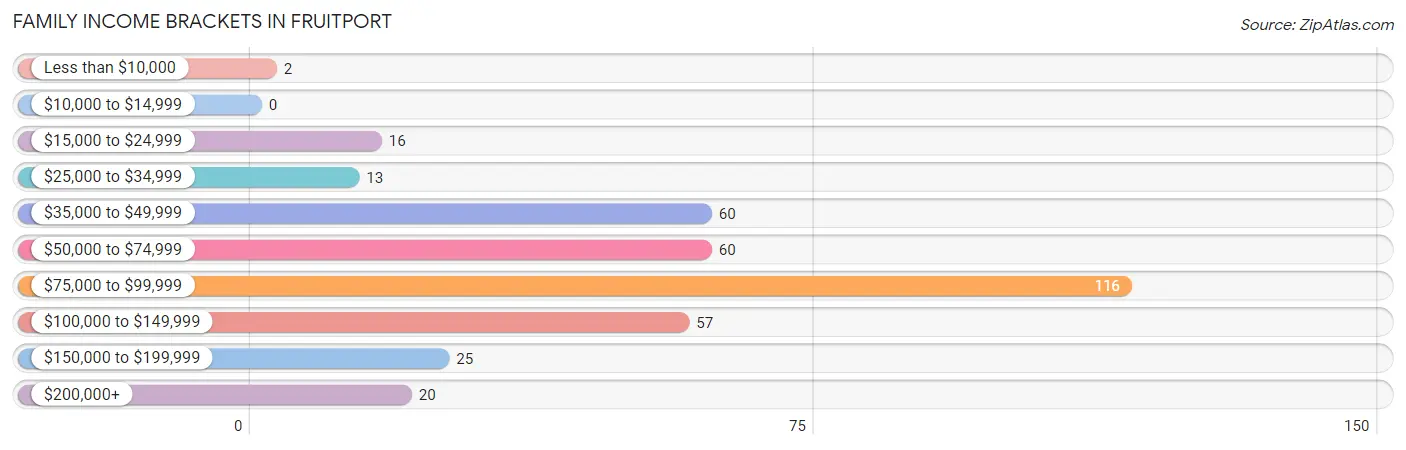
| Income Bracket | # Families | % Families |
| Less than $10,000 | 2 | 0.5% |
| $10,000 to $14,999 | 0 | 0.0% |
| $15,000 to $24,999 | 16 | 4.3% |
| $25,000 to $34,999 | 13 | 3.5% |
| $35,000 to $49,999 | 60 | 16.3% |
| $50,000 to $74,999 | 60 | 16.3% |
| $75,000 to $99,999 | 116 | 31.4% |
| $100,000 to $149,999 | 57 | 15.4% |
| $150,000 to $199,999 | 25 | 6.8% |
| $200,000+ | 20 | 5.4% |
Family Income by Famaliy Size in Fruitport
4-person families (112 | 30.3%) account for the highest median family income in Fruitport with $96,100 per family, while 2-person families (128 | 34.7%) have the highest median income of $31,875 per family member.
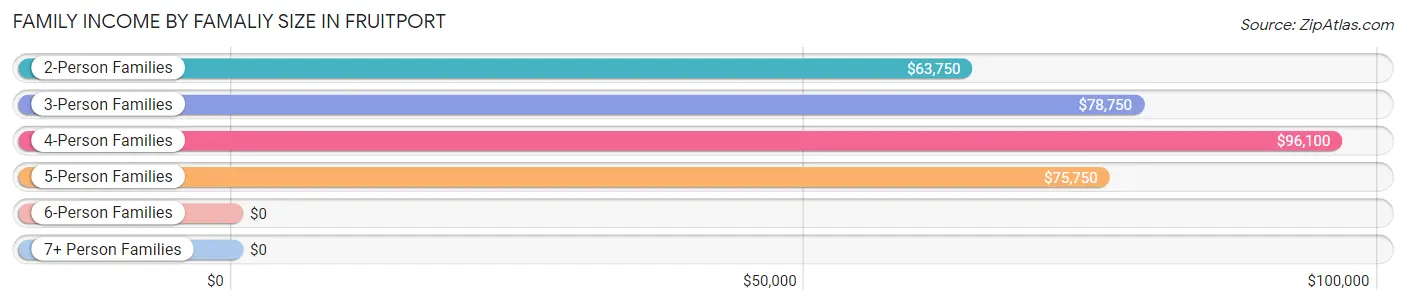
| Income Bracket | # Families | Median Income |
| 2-Person Families | 128 (34.7%) | $63,750 |
| 3-Person Families | 58 (15.7%) | $78,750 |
| 4-Person Families | 112 (30.3%) | $96,100 |
| 5-Person Families | 50 (13.6%) | $75,750 |
| 6-Person Families | 21 (5.7%) | $0 |
| 7+ Person Families | 0 (0.0%) | $0 |
| Total | 369 (100.0%) | $79,375 |
Family Income by Number of Earners in Fruitport
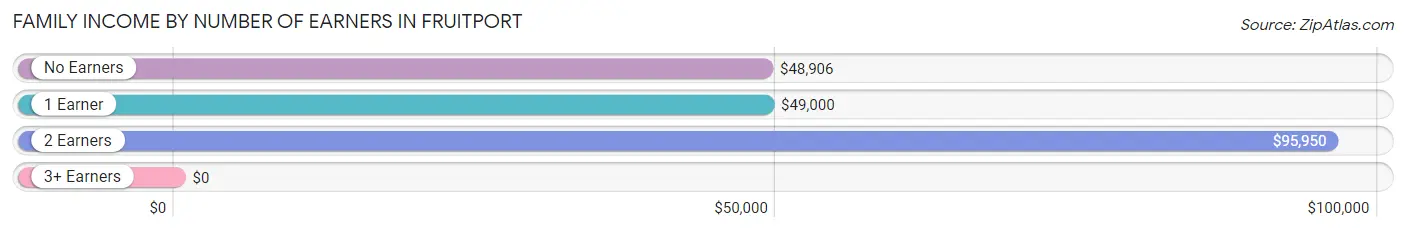
| Number of Earners | # Families | Median Income |
| No Earners | 43 (11.7%) | $48,906 |
| 1 Earner | 104 (28.2%) | $49,000 |
| 2 Earners | 183 (49.6%) | $95,950 |
| 3+ Earners | 39 (10.6%) | $0 |
| Total | 369 (100.0%) | $79,375 |
Household Income in Fruitport
Household Income Brackets in Fruitport
With 124 households falling in the category, the $75,000 to $99,999 income range is the most frequent in Fruitport, accounting for 25.5% of all households.
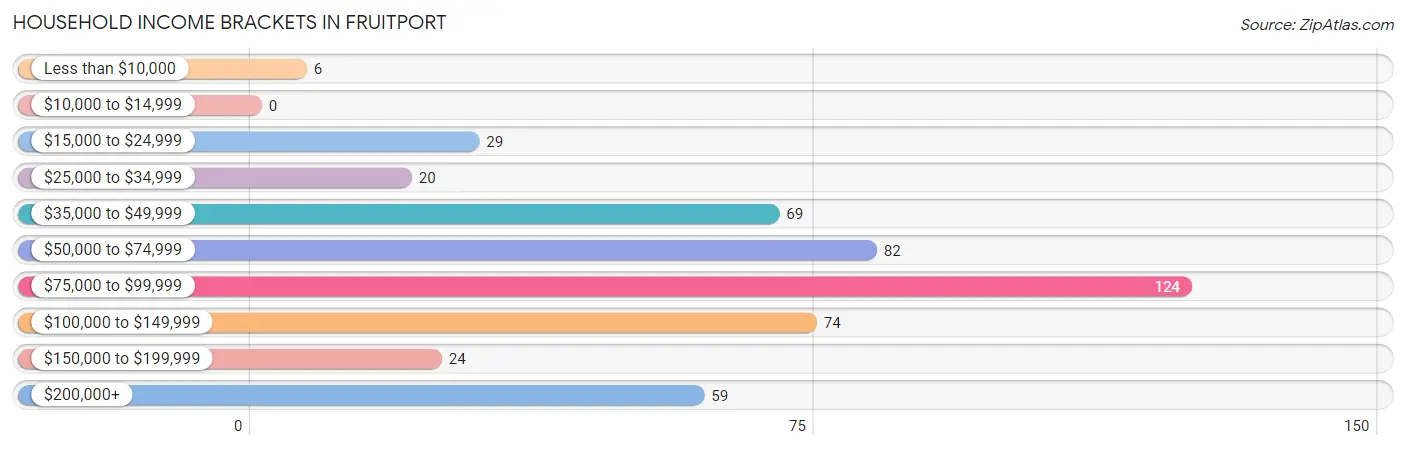
| Income Bracket | # Households | % Households |
| Less than $10,000 | 6 | 1.2% |
| $10,000 to $14,999 | 0 | 0.0% |
| $15,000 to $24,999 | 29 | 6.0% |
| $25,000 to $34,999 | 20 | 4.1% |
| $35,000 to $49,999 | 69 | 14.2% |
| $50,000 to $74,999 | 82 | 16.8% |
| $75,000 to $99,999 | 124 | 25.5% |
| $100,000 to $149,999 | 74 | 15.2% |
| $150,000 to $199,999 | 24 | 4.9% |
| $200,000+ | 59 | 12.1% |
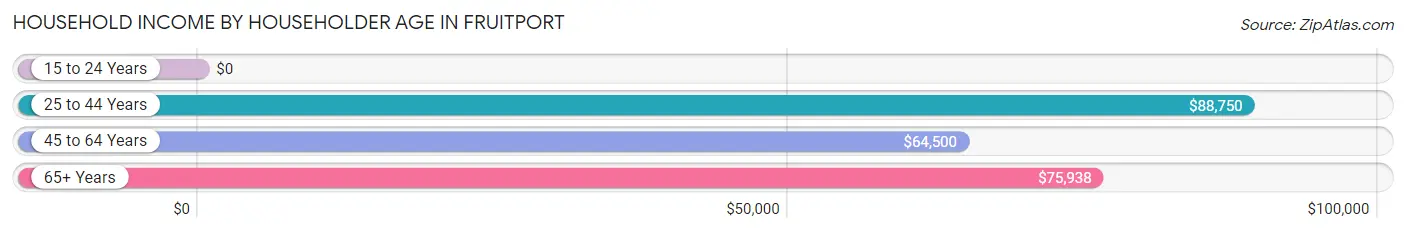
Household Income by Householder Age in Fruitport
The median household income in Fruitport is $79,375, with the highest median household income of $88,750 found in the 25 to 44 years age bracket for the primary householder. A total of 184 households (37.8%) fall into this category. Meanwhile, the 15 to 24 years age bracket for the primary householder has the lowest median household income of $0, with 6 households (1.2%) in this group.
| Income Bracket | # Households | Median Income |
| 15 to 24 Years | 6 (1.2%) | $0 |
| 25 to 44 Years | 184 (37.8%) | $88,750 |
| 45 to 64 Years | 160 (32.9%) | $64,500 |
| 65+ Years | 137 (28.1%) | $75,938 |
| Total | 487 (100.0%) | $79,375 |
Poverty in Fruitport
Income Below Poverty by Sex and Age in Fruitport
With 2.2% poverty level for males and 3.3% for females among the residents of Fruitport, 6 to 11 year old males and 15 year old females are the most vulnerable to poverty, with 9 males (13.9%) and 5 females (18.5%) in their respective age groups living below the poverty level.
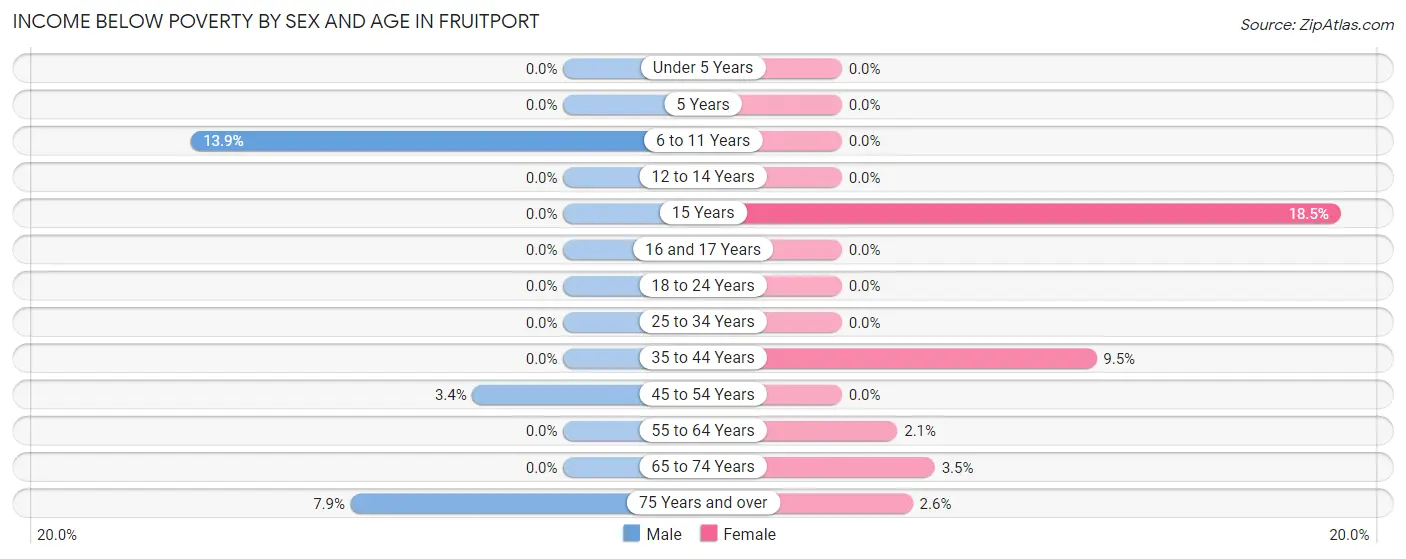
| Age Bracket | Male | Female |
| Under 5 Years | 0 (0.0%) | 0 (0.0%) |
| 5 Years | 0 (0.0%) | 0 (0.0%) |
| 6 to 11 Years | 9 (13.9%) | 0 (0.0%) |
| 12 to 14 Years | 0 (0.0%) | 0 (0.0%) |
| 15 Years | 0 (0.0%) | 5 (18.5%) |
| 16 and 17 Years | 0 (0.0%) | 0 (0.0%) |
| 18 to 24 Years | 0 (0.0%) | 0 (0.0%) |
| 25 to 34 Years | 0 (0.0%) | 0 (0.0%) |
| 35 to 44 Years | 0 (0.0%) | 12 (9.5%) |
| 45 to 54 Years | 3 (3.4%) | 0 (0.0%) |
| 55 to 64 Years | 0 (0.0%) | 2 (2.1%) |
| 65 to 74 Years | 0 (0.0%) | 2 (3.5%) |
| 75 Years and over | 3 (7.9%) | 2 (2.6%) |
| Total | 15 (2.2%) | 23 (3.3%) |
Income Above Poverty by Sex and Age in Fruitport
According to the poverty statistics in Fruitport, males aged under 5 years and females aged under 5 years are the age groups that are most secure financially, with 100.0% of males and 100.0% of females in these age groups living above the poverty line.
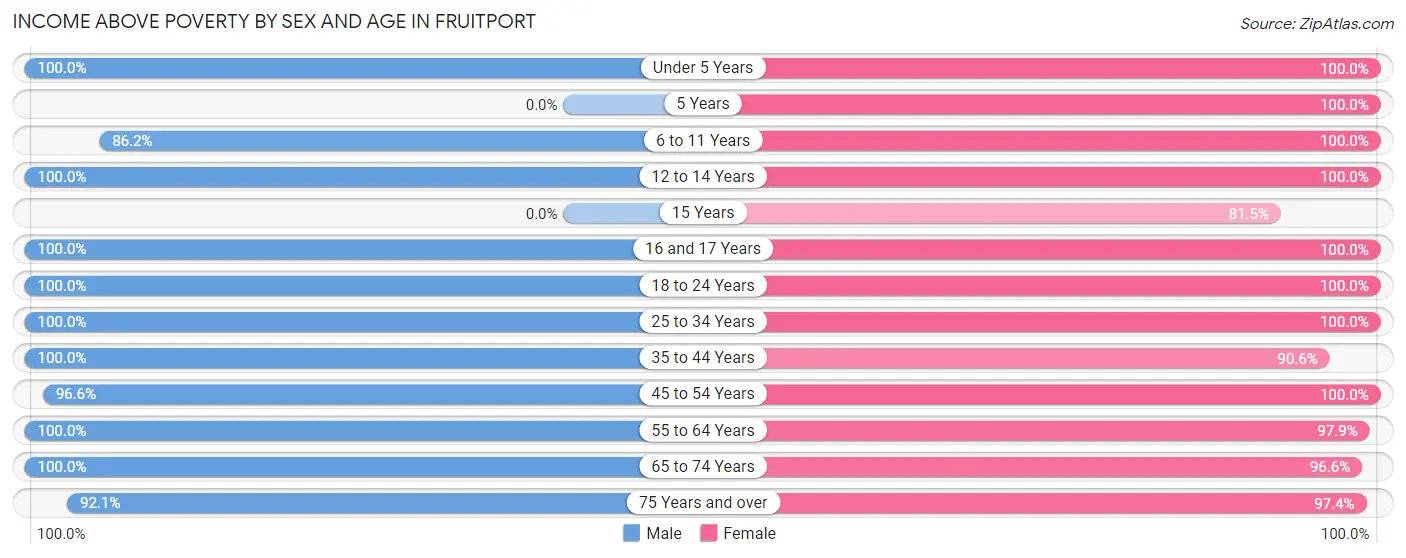
| Age Bracket | Male | Female |
| Under 5 Years | 37 (100.0%) | 58 (100.0%) |
| 5 Years | 0 (0.0%) | 13 (100.0%) |
| 6 to 11 Years | 56 (86.2%) | 63 (100.0%) |
| 12 to 14 Years | 71 (100.0%) | 20 (100.0%) |
| 15 Years | 0 (0.0%) | 22 (81.5%) |
| 16 and 17 Years | 19 (100.0%) | 26 (100.0%) |
| 18 to 24 Years | 57 (100.0%) | 25 (100.0%) |
| 25 to 34 Years | 92 (100.0%) | 71 (100.0%) |
| 35 to 44 Years | 109 (100.0%) | 115 (90.5%) |
| 45 to 54 Years | 86 (96.6%) | 33 (100.0%) |
| 55 to 64 Years | 65 (100.0%) | 95 (97.9%) |
| 65 to 74 Years | 49 (100.0%) | 56 (96.6%) |
| 75 Years and over | 35 (92.1%) | 74 (97.4%) |
| Total | 676 (97.8%) | 671 (96.7%) |
Income Below Poverty Among Married-Couple Families in Fruitport
The poverty statistics for married-couple families in Fruitport show that 0.6% or 2 of the total 322 families live below the poverty line. Families with no children have the highest poverty rate of 1.4%, comprising of 2 families. On the other hand, families with 1 or 2 children have the lowest poverty rate of 0.0%, which includes 0 families.
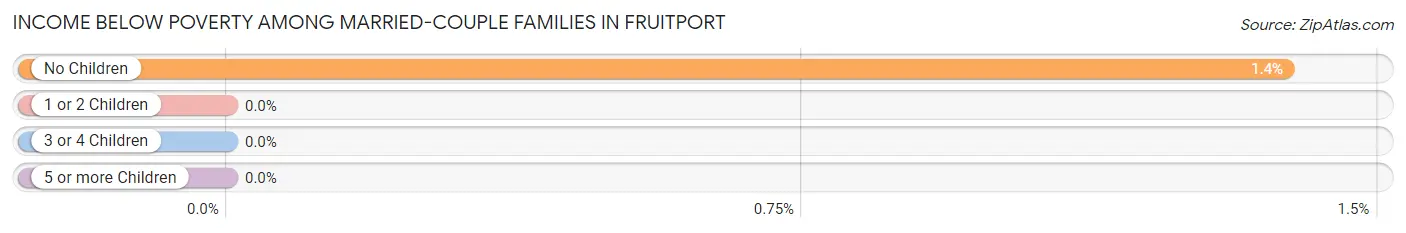
| Children | Above Poverty | Below Poverty |
| No Children | 143 (98.6%) | 2 (1.4%) |
| 1 or 2 Children | 112 (100.0%) | 0 (0.0%) |
| 3 or 4 Children | 65 (100.0%) | 0 (0.0%) |
| 5 or more Children | 0 (0.0%) | 0 (0.0%) |
| Total | 320 (99.4%) | 2 (0.6%) |
Income Below Poverty Among Single-Parent Households in Fruitport
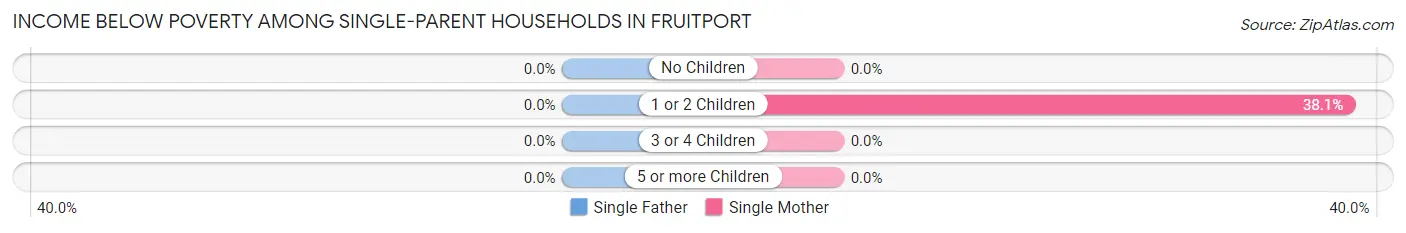
| Children | Single Father | Single Mother |
| No Children | 0 (0.0%) | 0 (0.0%) |
| 1 or 2 Children | 0 (0.0%) | 8 (38.1%) |
| 3 or 4 Children | 0 (0.0%) | 0 (0.0%) |
| 5 or more Children | 0 (0.0%) | 0 (0.0%) |
| Total | 0 (0.0%) | 8 (26.7%) |
Income Below Poverty Among Married-Couple vs Single-Parent Households in Fruitport
The poverty data for Fruitport shows that 2 of the married-couple family households (0.6%) and 8 of the single-parent households (17.0%) are living below the poverty level. Within the married-couple family households, those with no children have the highest poverty rate, with 2 households (1.4%) falling below the poverty line. Among the single-parent households, those with 1 or 2 children have the highest poverty rate, with 8 household (26.7%) living below poverty.
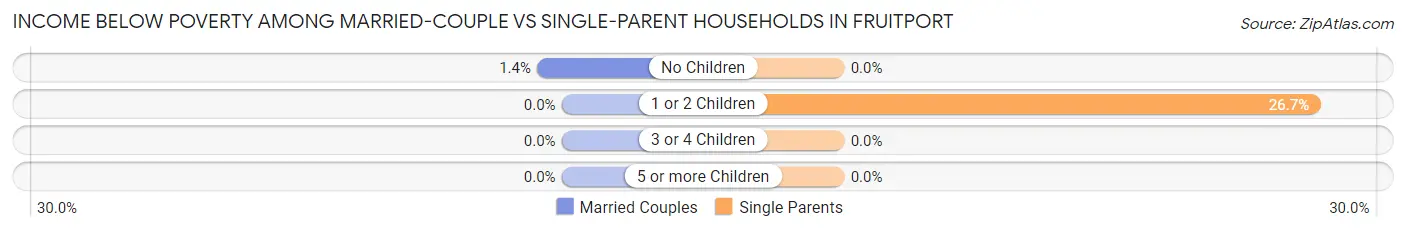
| Children | Married-Couple Families | Single-Parent Households |
| No Children | 2 (1.4%) | 0 (0.0%) |
| 1 or 2 Children | 0 (0.0%) | 8 (26.7%) |
| 3 or 4 Children | 0 (0.0%) | 0 (0.0%) |
| 5 or more Children | 0 (0.0%) | 0 (0.0%) |
| Total | 2 (0.6%) | 8 (17.0%) |
Race in Fruitport
The most populous races in Fruitport are White / Caucasian (1,316 | 94.8%), Hispanic or Latino (43 | 3.1%), and Two or more Races (43 | 3.1%).
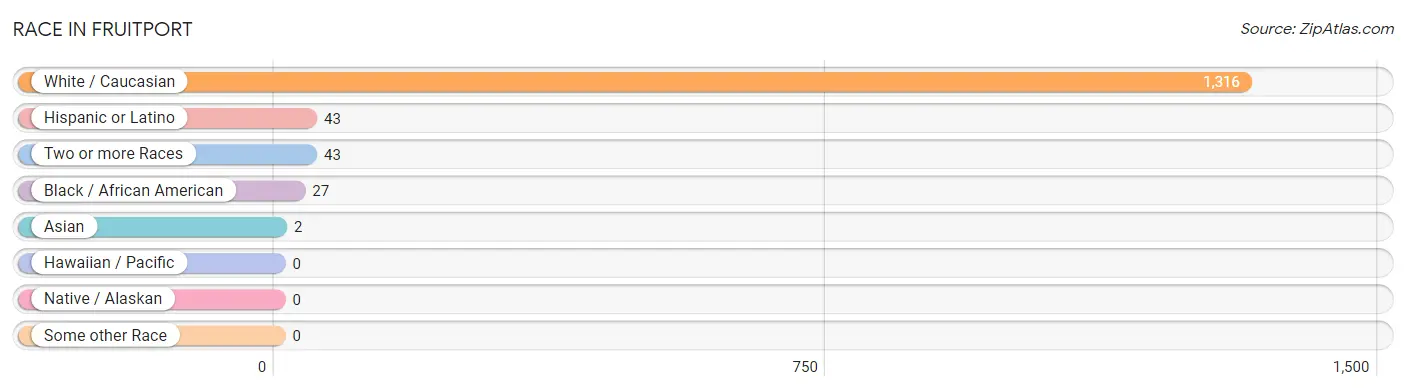
| Race | # Population | % Population |
| Asian | 2 | 0.1% |
| Black / African American | 27 | 1.9% |
| Hawaiian / Pacific | 0 | 0.0% |
| Hispanic or Latino | 43 | 3.1% |
| Native / Alaskan | 0 | 0.0% |
| White / Caucasian | 1,316 | 94.8% |
| Two or more Races | 43 | 3.1% |
| Some other Race | 0 | 0.0% |
| Total | 1,388 | 100.0% |
Ancestry in Fruitport
The most populous ancestries reported in Fruitport are German (240 | 17.3%), English (193 | 13.9%), Dutch (161 | 11.6%), Irish (89 | 6.4%), and French (67 | 4.8%), together accounting for 54.0% of all Fruitport residents.
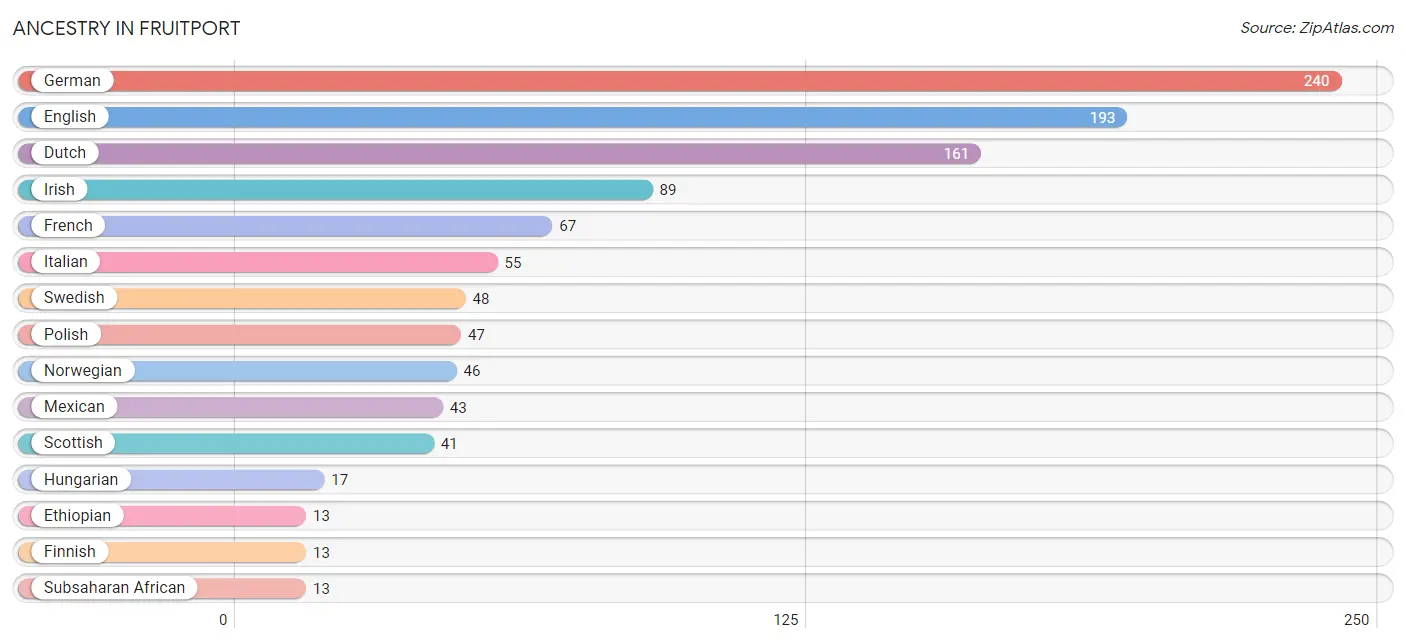
| Ancestry | # Population | % Population |
| American | 5 | 0.4% |
| British | 5 | 0.4% |
| Cherokee | 7 | 0.5% |
| Czech | 2 | 0.1% |
| Danish | 2 | 0.1% |
| Dutch | 161 | 11.6% |
| English | 193 | 13.9% |
| Ethiopian | 13 | 0.9% |
| European | 4 | 0.3% |
| Finnish | 13 | 0.9% |
| French | 67 | 4.8% |
| French Canadian | 10 | 0.7% |
| German | 240 | 17.3% |
| Hungarian | 17 | 1.2% |
| Indian (Asian) | 2 | 0.1% |
| Irish | 89 | 6.4% |
| Italian | 55 | 4.0% |
| Lithuanian | 2 | 0.1% |
| Macedonian | 6 | 0.4% |
| Mexican | 43 | 3.1% |
| Northern European | 2 | 0.1% |
| Norwegian | 46 | 3.3% |
| Polish | 47 | 3.4% |
| Russian | 12 | 0.9% |
| Scotch-Irish | 2 | 0.1% |
| Scottish | 41 | 2.9% |
| Slovak | 10 | 0.7% |
| Slovene | 3 | 0.2% |
| Subsaharan African | 13 | 0.9% |
| Swedish | 48 | 3.5% |
| Swiss | 12 | 0.9% |
| Welsh | 3 | 0.2% | View All 32 Rows |
Immigrants in Fruitport
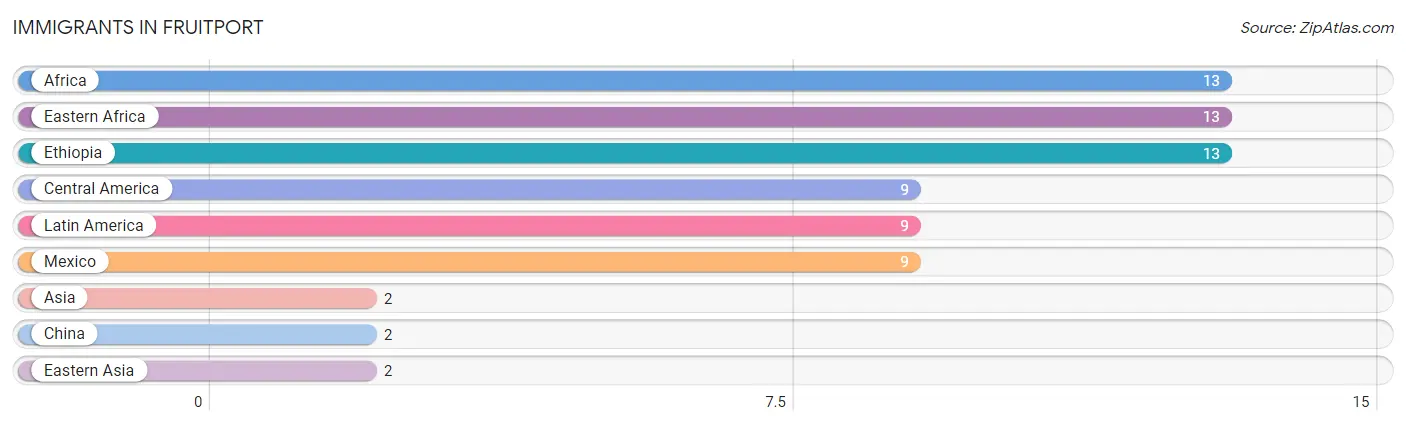
The most numerous immigrant groups reported in Fruitport came from Africa (13 | 0.9%), Eastern Africa (13 | 0.9%), Ethiopia (13 | 0.9%), Central America (9 | 0.6%), and Latin America (9 | 0.6%), together accounting for 4.1% of all Fruitport residents.
| Immigration Origin | # Population | % Population |
| Africa | 13 | 0.9% |
| Asia | 2 | 0.1% |
| Central America | 9 | 0.6% |
| China | 2 | 0.1% |
| Eastern Africa | 13 | 0.9% |
| Eastern Asia | 2 | 0.1% |
| Ethiopia | 13 | 0.9% |
| Latin America | 9 | 0.6% |
| Mexico | 9 | 0.6% | View All 9 Rows |
Sex and Age in Fruitport
Sex and Age in Fruitport
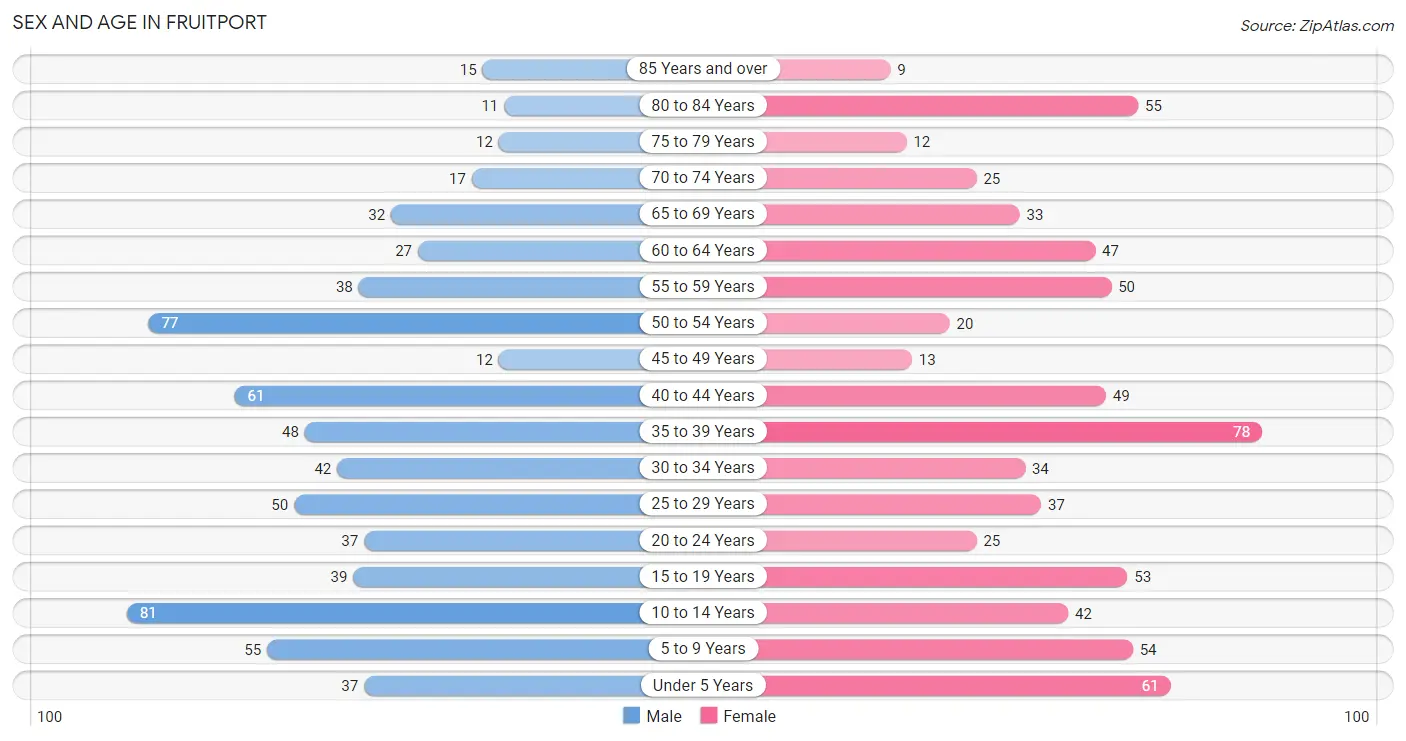
The most populous age groups in Fruitport are 10 to 14 Years (81 | 11.7%) for men and 35 to 39 Years (78 | 11.2%) for women.
| Age Bracket | Male | Female |
| Under 5 Years | 37 (5.3%) | 61 (8.7%) |
| 5 to 9 Years | 55 (8.0%) | 54 (7.7%) |
| 10 to 14 Years | 81 (11.7%) | 42 (6.0%) |
| 15 to 19 Years | 39 (5.6%) | 53 (7.6%) |
| 20 to 24 Years | 37 (5.3%) | 25 (3.6%) |
| 25 to 29 Years | 50 (7.2%) | 37 (5.3%) |
| 30 to 34 Years | 42 (6.1%) | 34 (4.9%) |
| 35 to 39 Years | 48 (7.0%) | 78 (11.2%) |
| 40 to 44 Years | 61 (8.8%) | 49 (7.0%) |
| 45 to 49 Years | 12 (1.7%) | 13 (1.9%) |
| 50 to 54 Years | 77 (11.1%) | 20 (2.9%) |
| 55 to 59 Years | 38 (5.5%) | 50 (7.2%) |
| 60 to 64 Years | 27 (3.9%) | 47 (6.7%) |
| 65 to 69 Years | 32 (4.6%) | 33 (4.7%) |
| 70 to 74 Years | 17 (2.5%) | 25 (3.6%) |
| 75 to 79 Years | 12 (1.7%) | 12 (1.7%) |
| 80 to 84 Years | 11 (1.6%) | 55 (7.9%) |
| 85 Years and over | 15 (2.2%) | 9 (1.3%) |
| Total | 691 (100.0%) | 697 (100.0%) |
Families and Households in Fruitport
Median Family Size in Fruitport
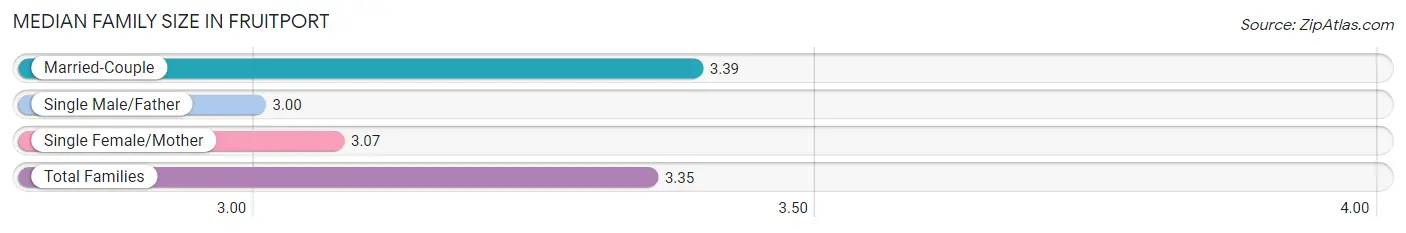
The median family size in Fruitport is 3.35 persons per family, with married-couple families (322 | 87.3%) accounting for the largest median family size of 3.39 persons per family. On the other hand, single male/father families (17 | 4.6%) represent the smallest median family size with 3.00 persons per family.
| Family Type | # Families | Family Size |
| Married-Couple | 322 (87.3%) | 3.39 |
| Single Male/Father | 17 (4.6%) | 3.00 |
| Single Female/Mother | 30 (8.1%) | 3.07 |
| Total Families | 369 (100.0%) | 3.35 |
Median Household Size in Fruitport
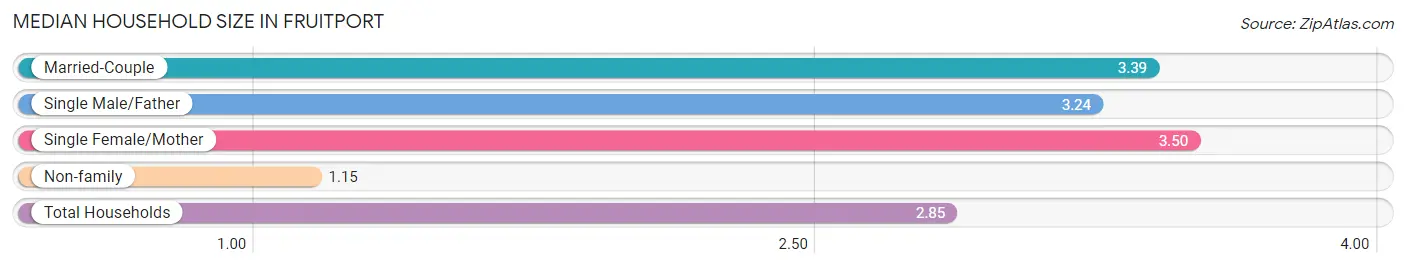
The median household size in Fruitport is 2.85 persons per household, with single female/mother households (30 | 6.2%) accounting for the largest median household size of 3.5 persons per household. non-family households (118 | 24.2%) represent the smallest median household size with 1.15 persons per household.
| Household Type | # Households | Household Size |
| Married-Couple | 322 (66.1%) | 3.39 |
| Single Male/Father | 17 (3.5%) | 3.24 |
| Single Female/Mother | 30 (6.2%) | 3.50 |
| Non-family | 118 (24.2%) | 1.15 |
| Total Households | 487 (100.0%) | 2.85 |
Household Size by Marriage Status in Fruitport
Out of a total of 487 households in Fruitport, 369 (75.8%) are family households, while 118 (24.2%) are nonfamily households. The most numerous type of family households are 2-person households, comprising 125, and the most common type of nonfamily households are 1-person households, comprising 100.
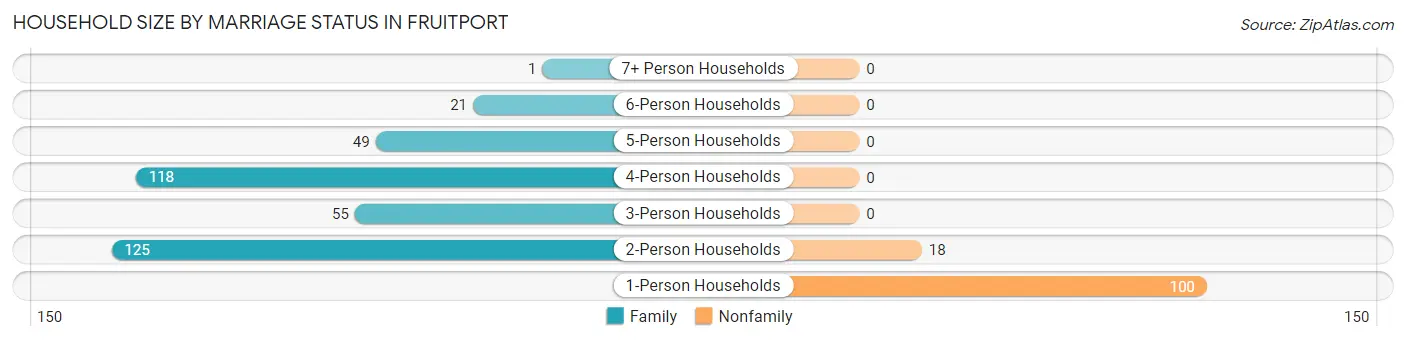
| Household Size | Family Households | Nonfamily Households |
| 1-Person Households | - | 100 (20.5%) |
| 2-Person Households | 125 (25.7%) | 18 (3.7%) |
| 3-Person Households | 55 (11.3%) | 0 (0.0%) |
| 4-Person Households | 118 (24.2%) | 0 (0.0%) |
| 5-Person Households | 49 (10.1%) | 0 (0.0%) |
| 6-Person Households | 21 (4.3%) | 0 (0.0%) |
| 7+ Person Households | 1 (0.2%) | 0 (0.0%) |
| Total | 369 (75.8%) | 118 (24.2%) |
Female Fertility in Fruitport
Fertility by Age in Fruitport
Average fertility rate in Fruitport is 93.0 births per 1,000 women. Women in the age bracket of 20 to 34 years have the highest fertility rate with 281.0 births per 1,000 women. Women in the age bracket of 20 to 34 years acount for 100.0% of all women with births.
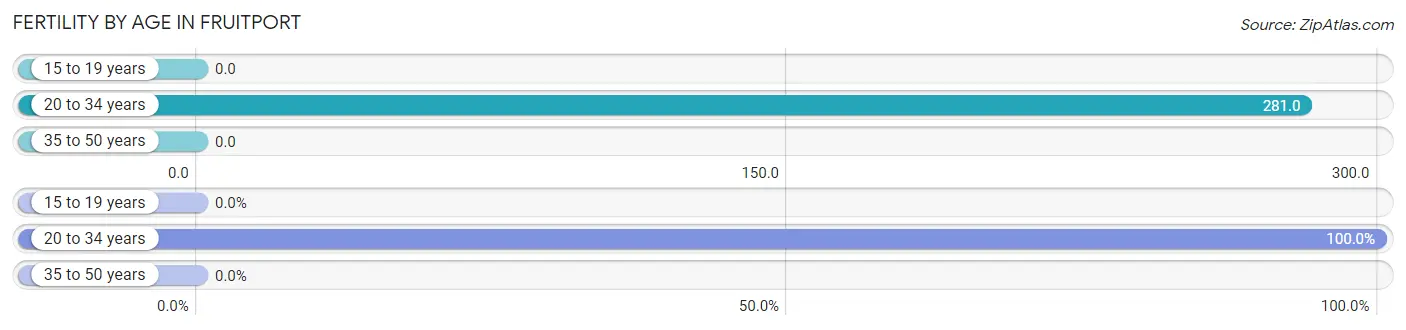
| Age Bracket | Women with Births | Births / 1,000 Women |
| 15 to 19 years | 0 (0.0%) | 0.0 |
| 20 to 34 years | 27 (100.0%) | 281.0 |
| 35 to 50 years | 0 (0.0%) | 0.0 |
| Total | 27 (100.0%) | 93.0 |
Fertility by Age by Marriage Status in Fruitport
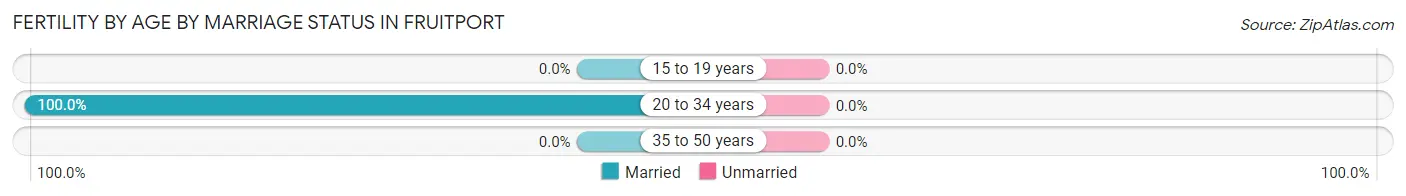
| Age Bracket | Married | Unmarried |
| 15 to 19 years | 0 (0.0%) | 0 (0.0%) |
| 20 to 34 years | 27 (100.0%) | 0 (0.0%) |
| 35 to 50 years | 0 (0.0%) | 0 (0.0%) |
| Total | 27 (100.0%) | 0 (0.0%) |
Fertility by Education in Fruitport
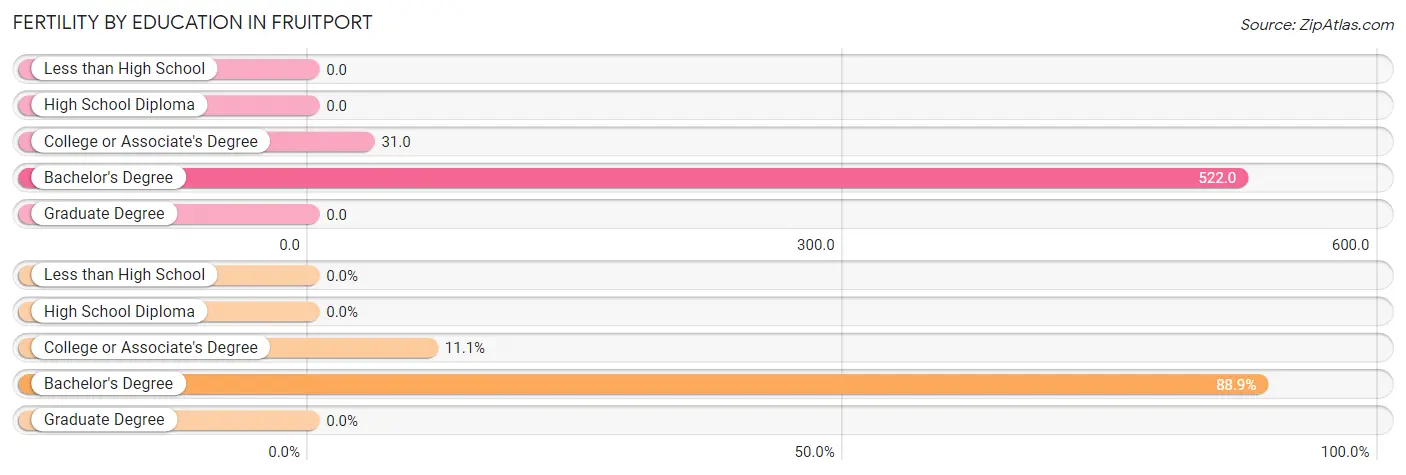
| Educational Attainment | Women with Births | Births / 1,000 Women |
| Less than High School | 0 (0.0%) | 0.0 |
| High School Diploma | 0 (0.0%) | 0.0 |
| College or Associate's Degree | 3 (11.1%) | 31.0 |
| Bachelor's Degree | 24 (88.9%) | 522.0 |
| Graduate Degree | 0 (0.0%) | 0.0 |
| Total | 27 (100.0%) | 93.0 |
Fertility by Education by Marriage Status in Fruitport
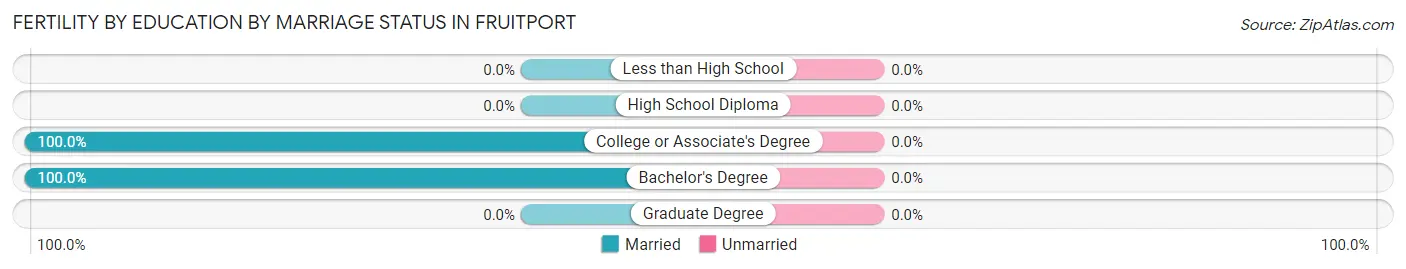
| Educational Attainment | Married | Unmarried |
| Less than High School | 0 (0.0%) | 0 (0.0%) |
| High School Diploma | 0 (0.0%) | 0 (0.0%) |
| College or Associate's Degree | 3 (100.0%) | 0 (0.0%) |
| Bachelor's Degree | 24 (100.0%) | 0 (0.0%) |
| Graduate Degree | 0 (0.0%) | 0 (0.0%) |
| Total | 27 (100.0%) | 0 (0.0%) |
Employment Characteristics in Fruitport
Employment by Class of Employer in Fruitport
Among the 607 employed individuals in Fruitport, private company employees (441 | 72.7%), local government employees (62 | 10.2%), and not-for-profit organizations (53 | 8.7%) make up the most common classes of employment.
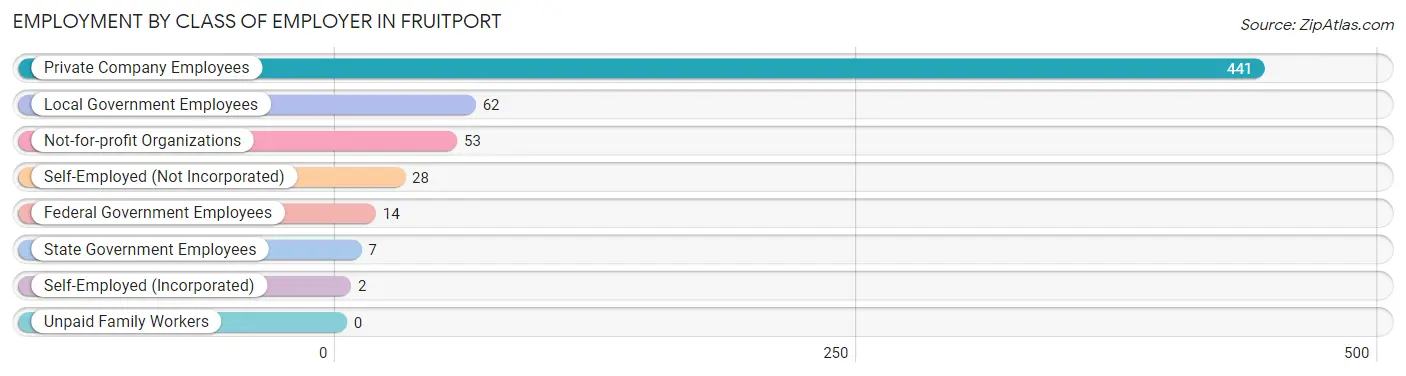
| Employer Class | # Employees | % Employees |
| Private Company Employees | 441 | 72.7% |
| Self-Employed (Incorporated) | 2 | 0.3% |
| Self-Employed (Not Incorporated) | 28 | 4.6% |
| Not-for-profit Organizations | 53 | 8.7% |
| Local Government Employees | 62 | 10.2% |
| State Government Employees | 7 | 1.1% |
| Federal Government Employees | 14 | 2.3% |
| Unpaid Family Workers | 0 | 0.0% |
| Total | 607 | 100.0% |
Employment Status by Age in Fruitport
According to the labor force statistics for Fruitport, out of the total population over 16 years of age (1,031), 64.0% or 660 individuals are in the labor force, with 5.9% or 39 of them unemployed. The age group with the highest labor force participation rate is 35 to 44 years, with 94.9% or 224 individuals in the labor force. Within the labor force, the 16 to 19 years age range has the highest percentage of unemployed individuals, with 41.0% or 16 of them being unemployed.
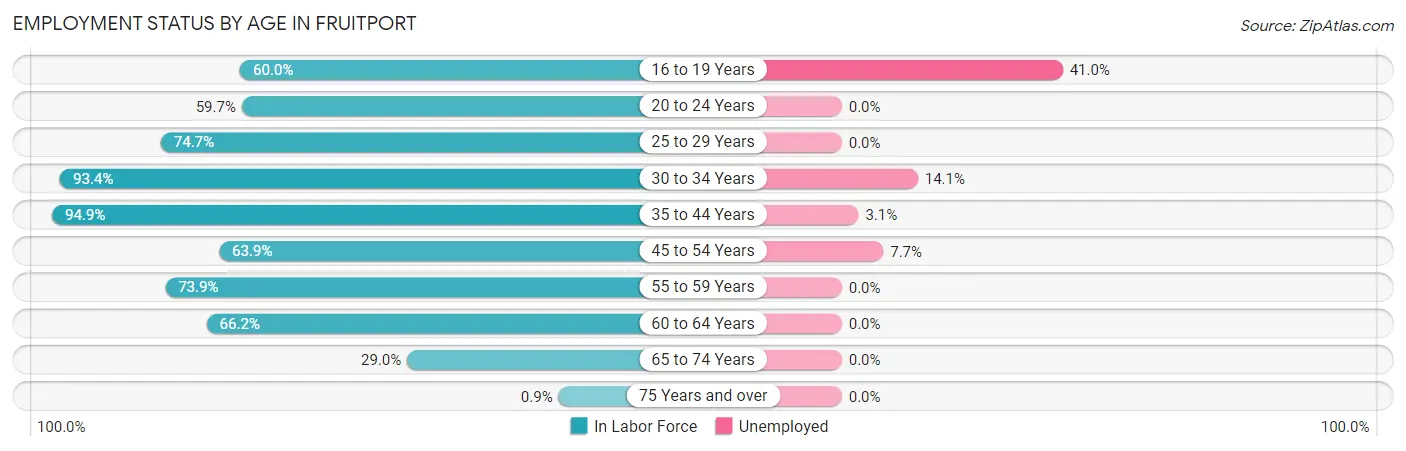
| Age Bracket | In Labor Force | Unemployed |
| 16 to 19 Years | 39 (60.0%) | 16 (41.0%) |
| 20 to 24 Years | 37 (59.7%) | 0 (0.0%) |
| 25 to 29 Years | 65 (74.7%) | 0 (0.0%) |
| 30 to 34 Years | 71 (93.4%) | 10 (14.1%) |
| 35 to 44 Years | 224 (94.9%) | 7 (3.1%) |
| 45 to 54 Years | 78 (63.9%) | 6 (7.7%) |
| 55 to 59 Years | 65 (73.9%) | 0 (0.0%) |
| 60 to 64 Years | 49 (66.2%) | 0 (0.0%) |
| 65 to 74 Years | 31 (29.0%) | 0 (0.0%) |
| 75 Years and over | 1 (0.9%) | 0 (0.0%) |
| Total | 660 (64.0%) | 39 (5.9%) |
Employment Status by Educational Attainment in Fruitport
According to labor force statistics for Fruitport, 80.8% of individuals (552) out of the total population between 25 and 64 years of age (683) are in the labor force, with 4.2% or 23 of them being unemployed. The group with the highest labor force participation rate are those with the educational attainment of high school diploma, with 86.6% or 161 individuals in the labor force. Within the labor force, individuals with high school diploma education have the highest percentage of unemployment, with 10.6% or 17 of them being unemployed.
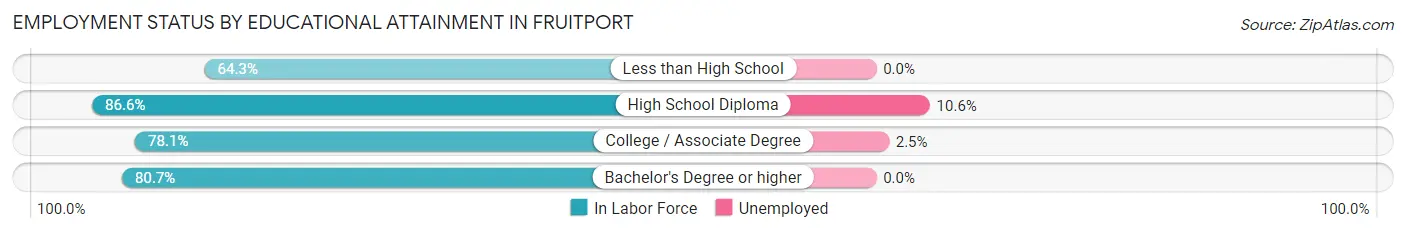
| Educational Attainment | In Labor Force | Unemployed |
| Less than High School | 9 (64.3%) | 0 (0.0%) |
| High School Diploma | 161 (86.6%) | 20 (10.6%) |
| College / Associate Degree | 236 (78.1%) | 8 (2.5%) |
| Bachelor's Degree or higher | 146 (80.7%) | 0 (0.0%) |
| Total | 552 (80.8%) | 29 (4.2%) |
Employment Occupations by Sex in Fruitport
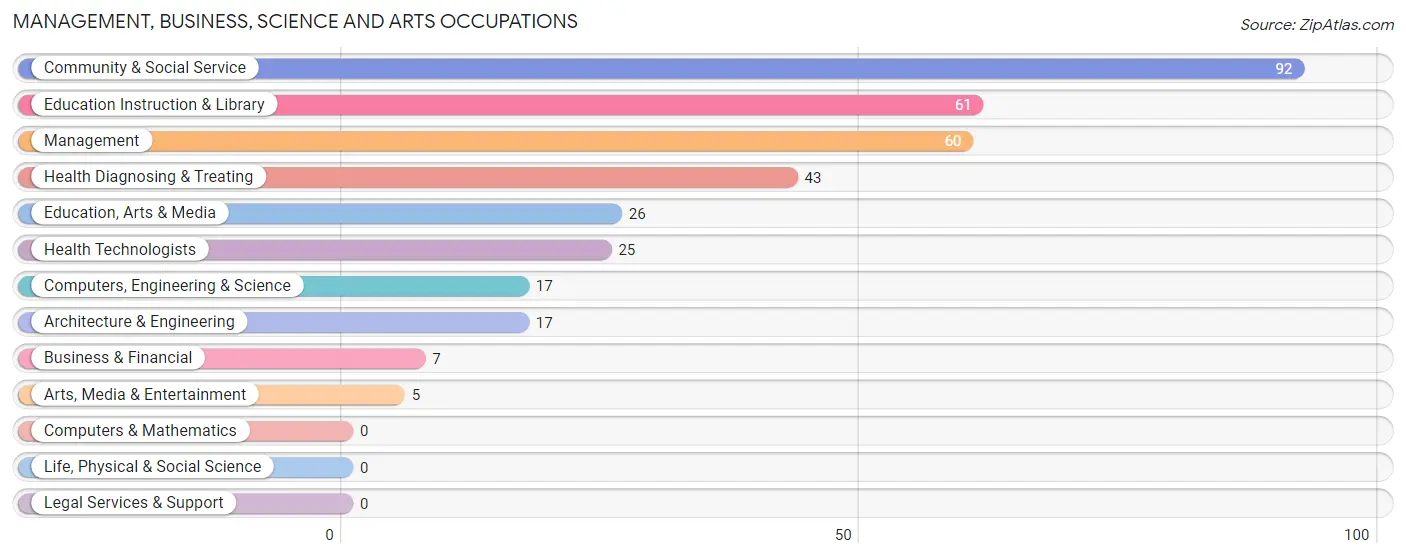
Management, Business, Science and Arts Occupations
The most common Management, Business, Science and Arts occupations in Fruitport are Community & Social Service (92 | 14.8%), Education Instruction & Library (61 | 9.8%), Management (60 | 9.7%), Health Diagnosing & Treating (43 | 6.9%), and Education, Arts & Media (26 | 4.2%).
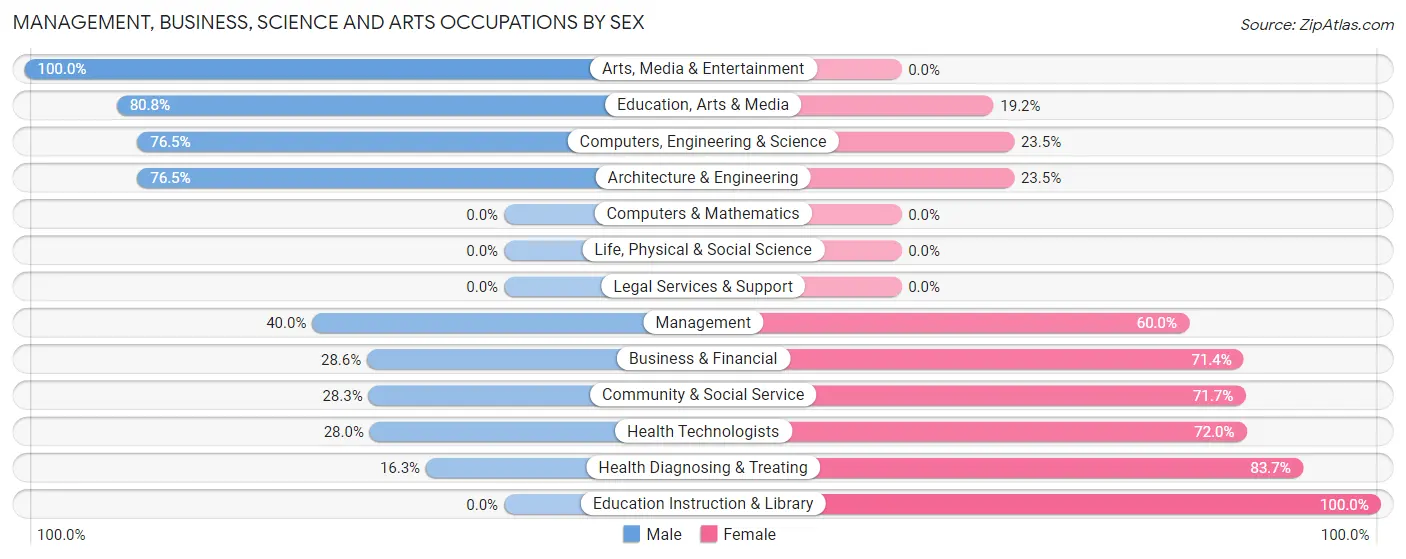
Management, Business, Science and Arts Occupations by Sex
Within the Management, Business, Science and Arts occupations in Fruitport, the most male-oriented occupations are Arts, Media & Entertainment (100.0%), Education, Arts & Media (80.8%), and Computers, Engineering & Science (76.5%), while the most female-oriented occupations are Education Instruction & Library (100.0%), Health Diagnosing & Treating (83.7%), and Health Technologists (72.0%).
| Occupation | Male | Female |
| Management | 24 (40.0%) | 36 (60.0%) |
| Business & Financial | 2 (28.6%) | 5 (71.4%) |
| Computers, Engineering & Science | 13 (76.5%) | 4 (23.5%) |
| Computers & Mathematics | 0 (0.0%) | 0 (0.0%) |
| Architecture & Engineering | 13 (76.5%) | 4 (23.5%) |
| Life, Physical & Social Science | 0 (0.0%) | 0 (0.0%) |
| Community & Social Service | 26 (28.3%) | 66 (71.7%) |
| Education, Arts & Media | 21 (80.8%) | 5 (19.2%) |
| Legal Services & Support | 0 (0.0%) | 0 (0.0%) |
| Education Instruction & Library | 0 (0.0%) | 61 (100.0%) |
| Arts, Media & Entertainment | 5 (100.0%) | 0 (0.0%) |
| Health Diagnosing & Treating | 7 (16.3%) | 36 (83.7%) |
| Health Technologists | 7 (28.0%) | 18 (72.0%) |
| Total (Category) | 72 (32.9%) | 147 (67.1%) |
| Total (Overall) | 339 (54.6%) | 282 (45.4%) |
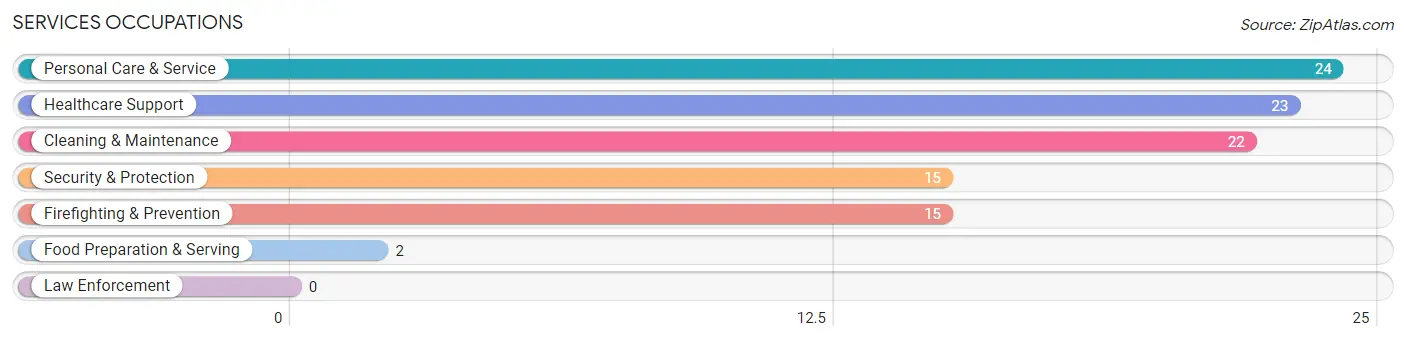
Services Occupations
The most common Services occupations in Fruitport are Personal Care & Service (24 | 3.9%), Healthcare Support (23 | 3.7%), Cleaning & Maintenance (22 | 3.5%), Security & Protection (15 | 2.4%), and Firefighting & Prevention (15 | 2.4%).
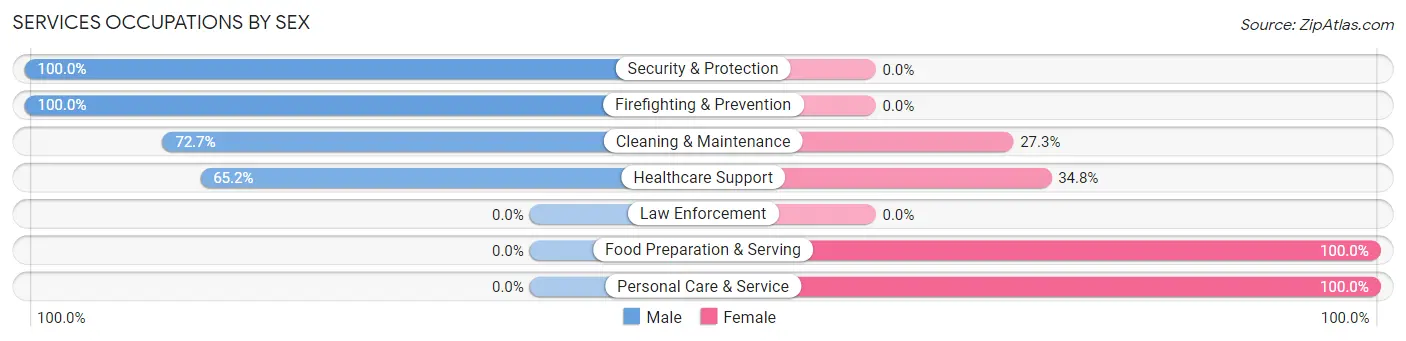
Services Occupations by Sex
Within the Services occupations in Fruitport, the most male-oriented occupations are Security & Protection (100.0%), Firefighting & Prevention (100.0%), and Cleaning & Maintenance (72.7%), while the most female-oriented occupations are Food Preparation & Serving (100.0%), Personal Care & Service (100.0%), and Healthcare Support (34.8%).
| Occupation | Male | Female |
| Healthcare Support | 15 (65.2%) | 8 (34.8%) |
| Security & Protection | 15 (100.0%) | 0 (0.0%) |
| Firefighting & Prevention | 15 (100.0%) | 0 (0.0%) |
| Law Enforcement | 0 (0.0%) | 0 (0.0%) |
| Food Preparation & Serving | 0 (0.0%) | 2 (100.0%) |
| Cleaning & Maintenance | 16 (72.7%) | 6 (27.3%) |
| Personal Care & Service | 0 (0.0%) | 24 (100.0%) |
| Total (Category) | 46 (53.5%) | 40 (46.5%) |
| Total (Overall) | 339 (54.6%) | 282 (45.4%) |
Sales and Office Occupations
The most common Sales and Office occupations in Fruitport are Office & Administration (82 | 13.2%), and Sales & Related (31 | 5.0%).

Sales and Office Occupations by Sex
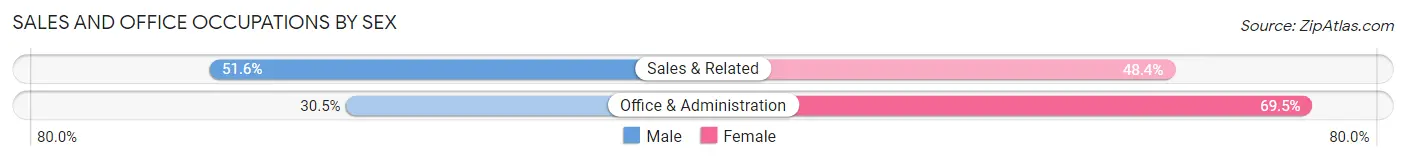
| Occupation | Male | Female |
| Sales & Related | 16 (51.6%) | 15 (48.4%) |
| Office & Administration | 25 (30.5%) | 57 (69.5%) |
| Total (Category) | 41 (36.3%) | 72 (63.7%) |
| Total (Overall) | 339 (54.6%) | 282 (45.4%) |
Natural Resources, Construction and Maintenance Occupations
The most common Natural Resources, Construction and Maintenance occupations in Fruitport are Installation, Maintenance & Repair (36 | 5.8%), and Construction & Extraction (5 | 0.8%).
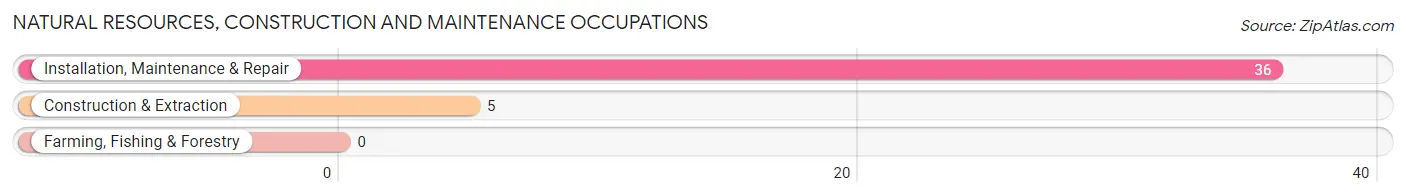
Natural Resources, Construction and Maintenance Occupations by Sex

| Occupation | Male | Female |
| Farming, Fishing & Forestry | 0 (0.0%) | 0 (0.0%) |
| Construction & Extraction | 5 (100.0%) | 0 (0.0%) |
| Installation, Maintenance & Repair | 36 (100.0%) | 0 (0.0%) |
| Total (Category) | 41 (100.0%) | 0 (0.0%) |
| Total (Overall) | 339 (54.6%) | 282 (45.4%) |
Production, Transportation and Moving Occupations
The most common Production, Transportation and Moving occupations in Fruitport are Production (77 | 12.4%), Material Moving (68 | 11.0%), and Transportation (17 | 2.7%).
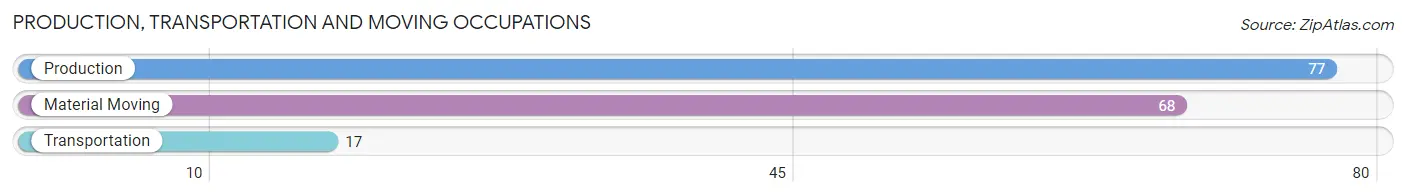
Production, Transportation and Moving Occupations by Sex
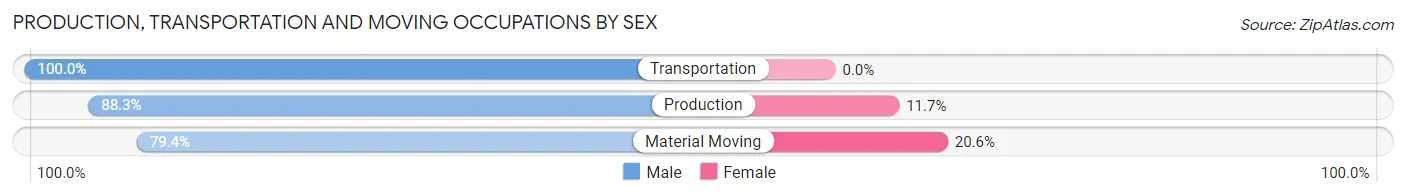
| Occupation | Male | Female |
| Production | 68 (88.3%) | 9 (11.7%) |
| Transportation | 17 (100.0%) | 0 (0.0%) |
| Material Moving | 54 (79.4%) | 14 (20.6%) |
| Total (Category) | 139 (85.8%) | 23 (14.2%) |
| Total (Overall) | 339 (54.6%) | 282 (45.4%) |
Employment Industries by Sex in Fruitport
Employment Industries in Fruitport
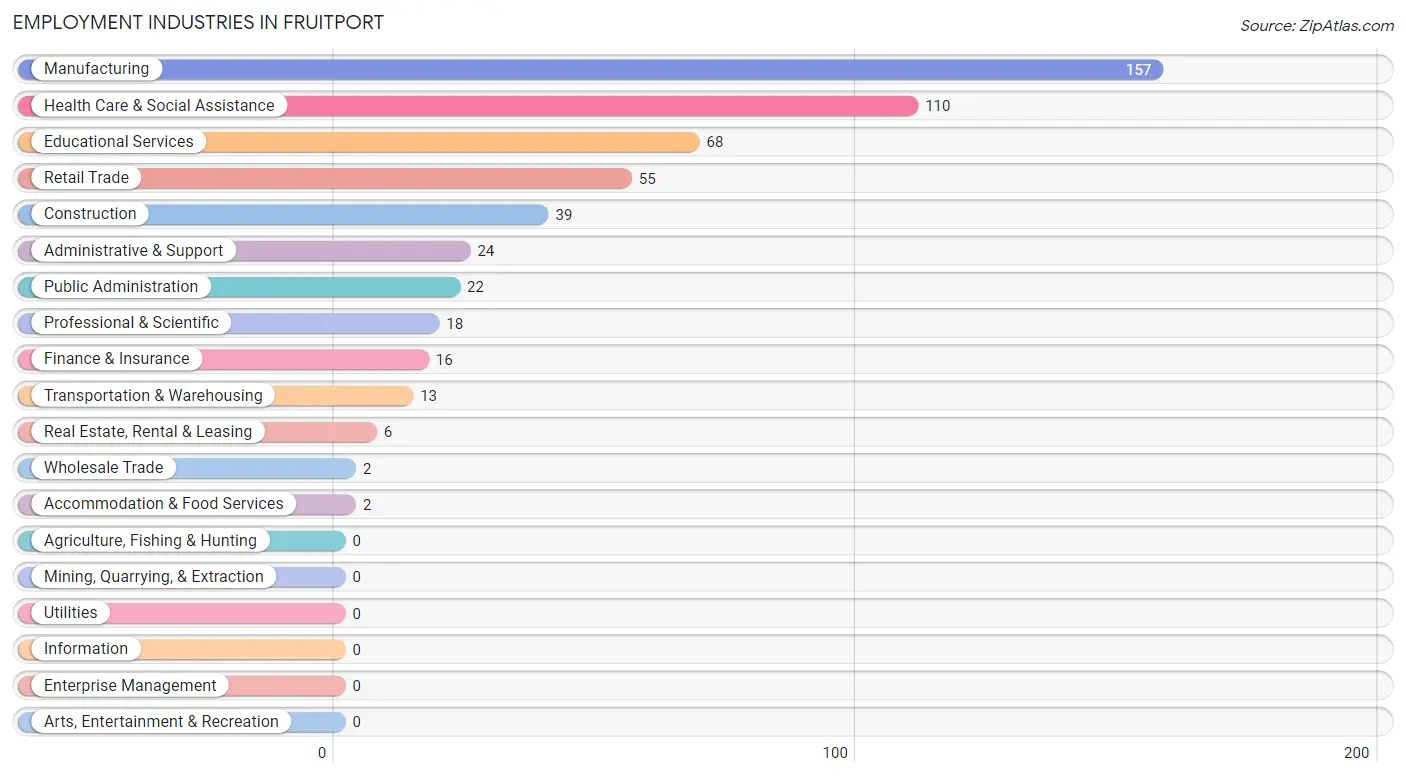
The major employment industries in Fruitport include Manufacturing (157 | 25.3%), Health Care & Social Assistance (110 | 17.7%), Educational Services (68 | 11.0%), Retail Trade (55 | 8.9%), and Construction (39 | 6.3%).
Employment Industries by Sex in Fruitport
The Fruitport industries that see more men than women are Wholesale Trade (100.0%), Transportation & Warehousing (100.0%), and Manufacturing (89.2%), whereas the industries that tend to have a higher number of women are Real Estate, Rental & Leasing (100.0%), Educational Services (100.0%), and Accommodation & Food Services (100.0%).
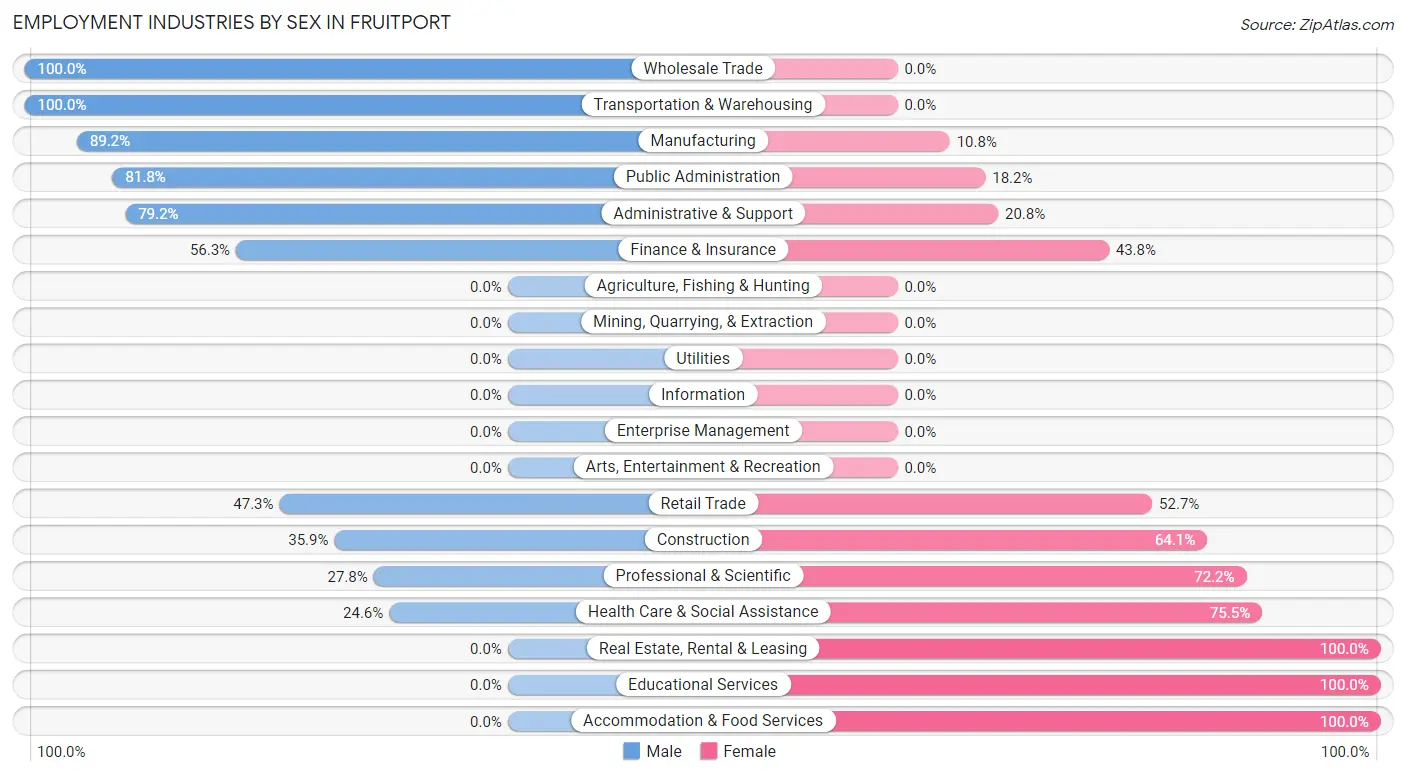
| Industry | Male | Female |
| Agriculture, Fishing & Hunting | 0 (0.0%) | 0 (0.0%) |
| Mining, Quarrying, & Extraction | 0 (0.0%) | 0 (0.0%) |
| Construction | 14 (35.9%) | 25 (64.1%) |
| Manufacturing | 140 (89.2%) | 17 (10.8%) |
| Wholesale Trade | 2 (100.0%) | 0 (0.0%) |
| Retail Trade | 26 (47.3%) | 29 (52.7%) |
| Transportation & Warehousing | 13 (100.0%) | 0 (0.0%) |
| Utilities | 0 (0.0%) | 0 (0.0%) |
| Information | 0 (0.0%) | 0 (0.0%) |
| Finance & Insurance | 9 (56.2%) | 7 (43.8%) |
| Real Estate, Rental & Leasing | 0 (0.0%) | 6 (100.0%) |
| Professional & Scientific | 5 (27.8%) | 13 (72.2%) |
| Enterprise Management | 0 (0.0%) | 0 (0.0%) |
| Administrative & Support | 19 (79.2%) | 5 (20.8%) |
| Educational Services | 0 (0.0%) | 68 (100.0%) |
| Health Care & Social Assistance | 27 (24.5%) | 83 (75.4%) |
| Arts, Entertainment & Recreation | 0 (0.0%) | 0 (0.0%) |
| Accommodation & Food Services | 0 (0.0%) | 2 (100.0%) |
| Public Administration | 18 (81.8%) | 4 (18.2%) |
| Total | 339 (54.6%) | 282 (45.4%) |
Education in Fruitport
School Enrollment in Fruitport
The most common levels of schooling among the 302 students in Fruitport are middle school (109 | 36.1%), elementary school (96 | 31.8%), and high school (66 | 21.8%).
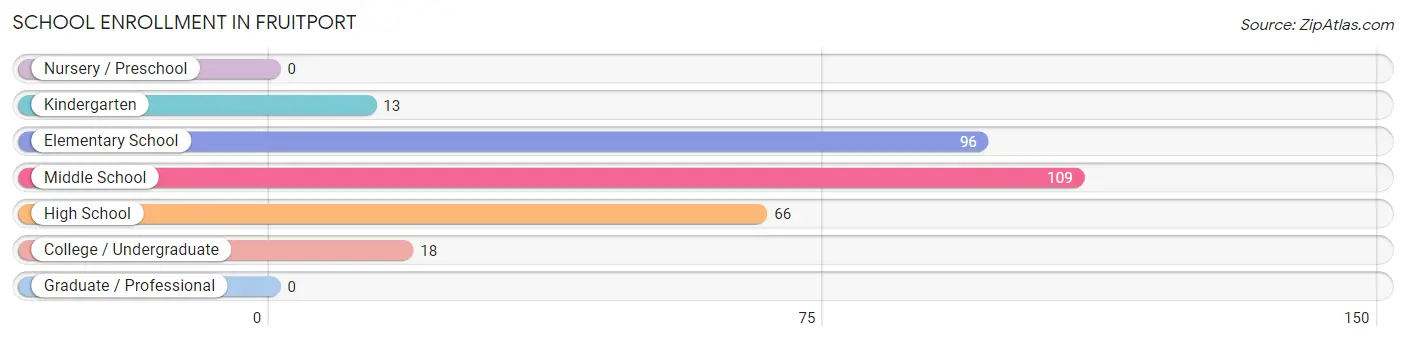
| School Level | # Students | % Students |
| Nursery / Preschool | 0 | 0.0% |
| Kindergarten | 13 | 4.3% |
| Elementary School | 96 | 31.8% |
| Middle School | 109 | 36.1% |
| High School | 66 | 21.8% |
| College / Undergraduate | 18 | 6.0% |
| Graduate / Professional | 0 | 0.0% |
| Total | 302 | 100.0% |
School Enrollment by Age by Funding Source in Fruitport
Out of a total of 302 students who are enrolled in schools in Fruitport, 40 (13.2%) attend a private institution, while the remaining 262 (86.8%) are enrolled in public schools. The age group of 5 to 9 year old has the highest likelihood of being enrolled in private schools, with 34 (31.2% in the age bracket) enrolled. Conversely, the age group of 15 to 17 year olds has the lowest likelihood of being enrolled in a private school, with 54 (100.0% in the age bracket) attending a public institution.
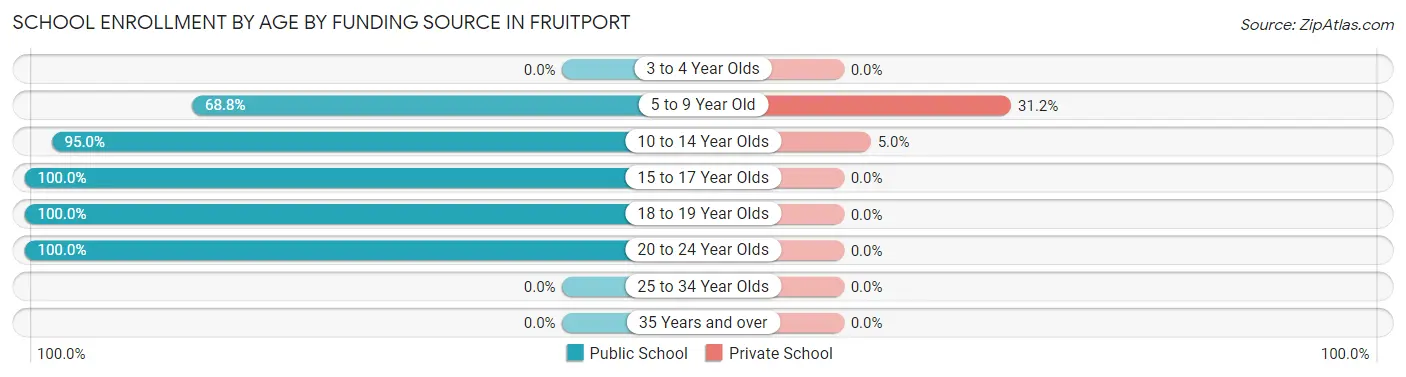
| Age Bracket | Public School | Private School |
| 3 to 4 Year Olds | 0 (0.0%) | 0 (0.0%) |
| 5 to 9 Year Old | 75 (68.8%) | 34 (31.2%) |
| 10 to 14 Year Olds | 113 (95.0%) | 6 (5.0%) |
| 15 to 17 Year Olds | 54 (100.0%) | 0 (0.0%) |
| 18 to 19 Year Olds | 4 (100.0%) | 0 (0.0%) |
| 20 to 24 Year Olds | 16 (100.0%) | 0 (0.0%) |
| 25 to 34 Year Olds | 0 (0.0%) | 0 (0.0%) |
| 35 Years and over | 0 (0.0%) | 0 (0.0%) |
| Total | 262 (86.8%) | 40 (13.2%) |
Educational Attainment by Field of Study in Fruitport
Liberal arts & history (45 | 17.4%), business (34 | 13.1%), arts & humanities (29 | 11.2%), education (28 | 10.8%), and social sciences (25 | 9.7%) are the most common fields of study among 259 individuals in Fruitport who have obtained a bachelor's degree or higher.
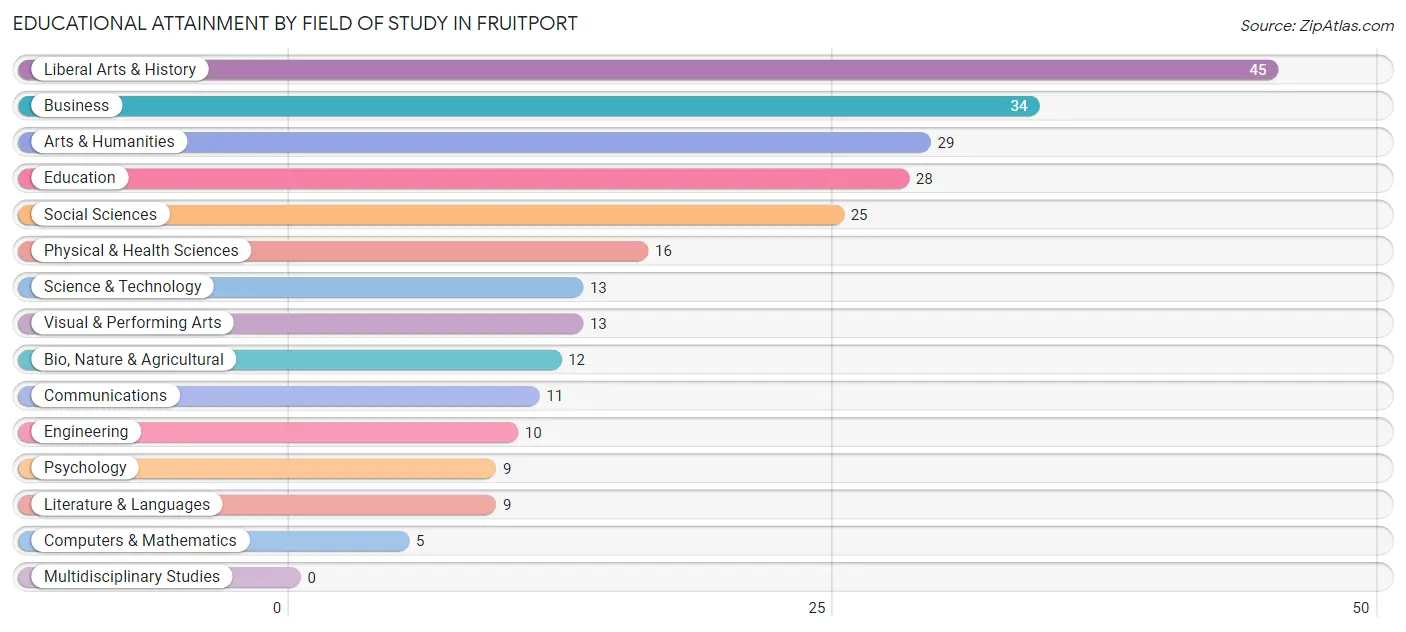
| Field of Study | # Graduates | % Graduates |
| Computers & Mathematics | 5 | 1.9% |
| Bio, Nature & Agricultural | 12 | 4.6% |
| Physical & Health Sciences | 16 | 6.2% |
| Psychology | 9 | 3.5% |
| Social Sciences | 25 | 9.7% |
| Engineering | 10 | 3.9% |
| Multidisciplinary Studies | 0 | 0.0% |
| Science & Technology | 13 | 5.0% |
| Business | 34 | 13.1% |
| Education | 28 | 10.8% |
| Literature & Languages | 9 | 3.5% |
| Liberal Arts & History | 45 | 17.4% |
| Visual & Performing Arts | 13 | 5.0% |
| Communications | 11 | 4.3% |
| Arts & Humanities | 29 | 11.2% |
| Total | 259 | 100.0% |
Transportation & Commute in Fruitport
Vehicle Availability by Sex in Fruitport
The most prevalent vehicle ownership categories in Fruitport are males with 2 vehicles (139, accounting for 41.0%) and females with 2 vehicles (122, making up 51.9%).
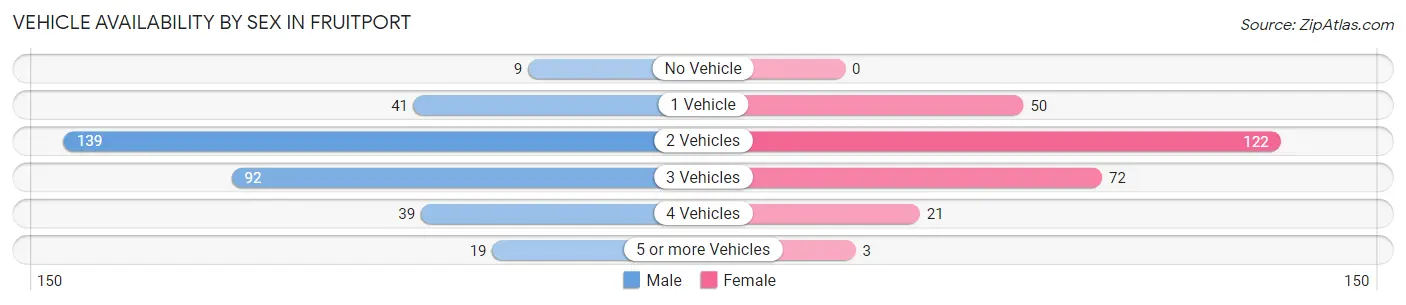
| Vehicles Available | Male | Female |
| No Vehicle | 9 (2.6%) | 0 (0.0%) |
| 1 Vehicle | 41 (12.1%) | 50 (18.7%) |
| 2 Vehicles | 139 (41.0%) | 122 (45.5%) |
| 3 Vehicles | 92 (27.1%) | 72 (26.9%) |
| 4 Vehicles | 39 (11.5%) | 21 (7.8%) |
| 5 or more Vehicles | 19 (5.6%) | 3 (1.1%) |
| Total | 339 (100.0%) | 268 (100.0%) |
Commute Time in Fruitport
The most frequently occuring commute durations in Fruitport are 10 to 14 minutes (149 commuters, 26.2%), 45 to 59 minutes (76 commuters, 13.4%), and 15 to 19 minutes (75 commuters, 13.2%).
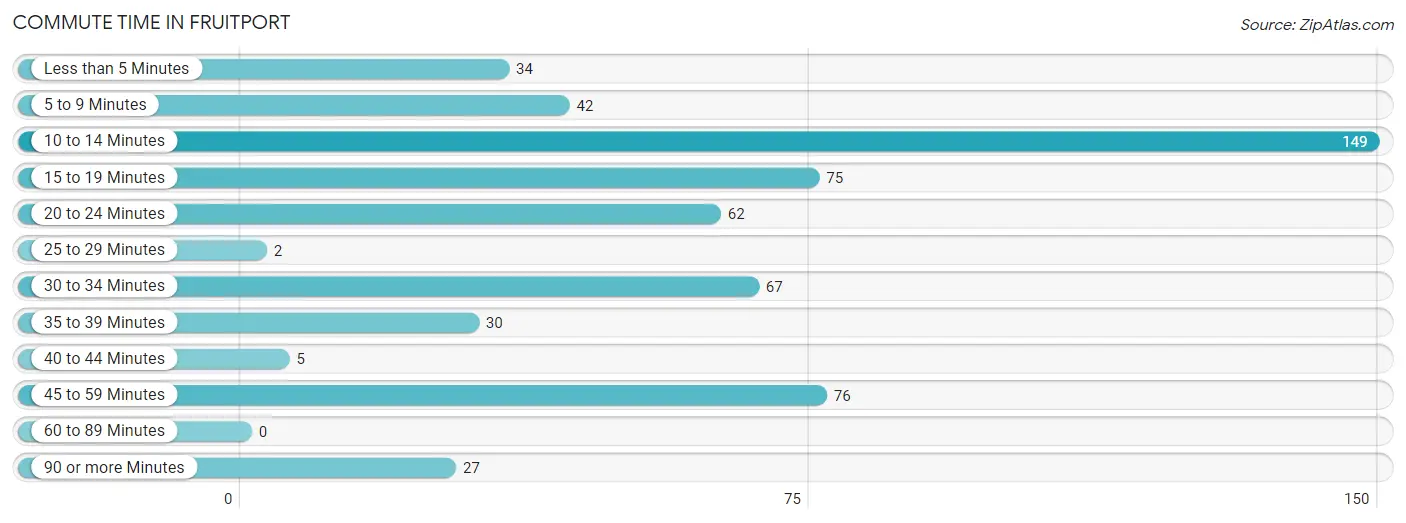
| Commute Time | # Commuters | % Commuters |
| Less than 5 Minutes | 34 | 6.0% |
| 5 to 9 Minutes | 42 | 7.4% |
| 10 to 14 Minutes | 149 | 26.2% |
| 15 to 19 Minutes | 75 | 13.2% |
| 20 to 24 Minutes | 62 | 10.9% |
| 25 to 29 Minutes | 2 | 0.4% |
| 30 to 34 Minutes | 67 | 11.8% |
| 35 to 39 Minutes | 30 | 5.3% |
| 40 to 44 Minutes | 5 | 0.9% |
| 45 to 59 Minutes | 76 | 13.4% |
| 60 to 89 Minutes | 0 | 0.0% |
| 90 or more Minutes | 27 | 4.8% |
Commute Time by Sex in Fruitport
The most common commute times in Fruitport are 10 to 14 minutes (89 commuters, 27.5%) for males and 10 to 14 minutes (60 commuters, 24.5%) for females.
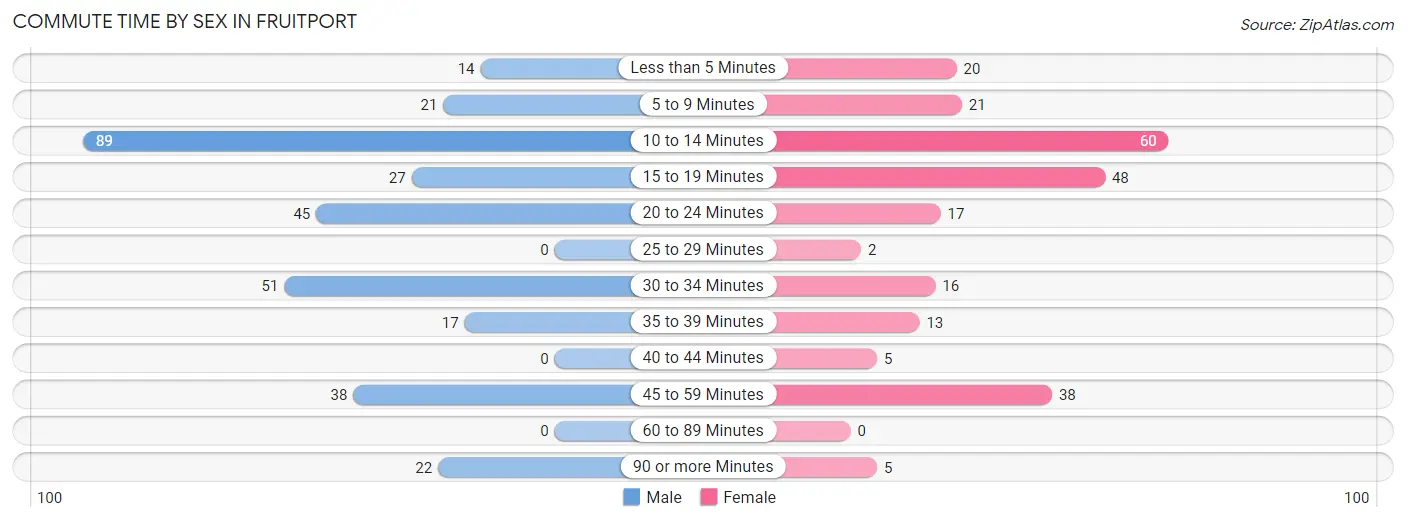
| Commute Time | Male | Female |
| Less than 5 Minutes | 14 (4.3%) | 20 (8.2%) |
| 5 to 9 Minutes | 21 (6.5%) | 21 (8.6%) |
| 10 to 14 Minutes | 89 (27.5%) | 60 (24.5%) |
| 15 to 19 Minutes | 27 (8.3%) | 48 (19.6%) |
| 20 to 24 Minutes | 45 (13.9%) | 17 (6.9%) |
| 25 to 29 Minutes | 0 (0.0%) | 2 (0.8%) |
| 30 to 34 Minutes | 51 (15.7%) | 16 (6.5%) |
| 35 to 39 Minutes | 17 (5.2%) | 13 (5.3%) |
| 40 to 44 Minutes | 0 (0.0%) | 5 (2.0%) |
| 45 to 59 Minutes | 38 (11.7%) | 38 (15.5%) |
| 60 to 89 Minutes | 0 (0.0%) | 0 (0.0%) |
| 90 or more Minutes | 22 (6.8%) | 5 (2.0%) |
Time of Departure to Work by Sex in Fruitport
The most frequent times of departure to work in Fruitport are 7:00 AM to 7:29 AM (86, 26.5%) for males and 8:00 AM to 8:29 AM (60, 24.5%) for females.
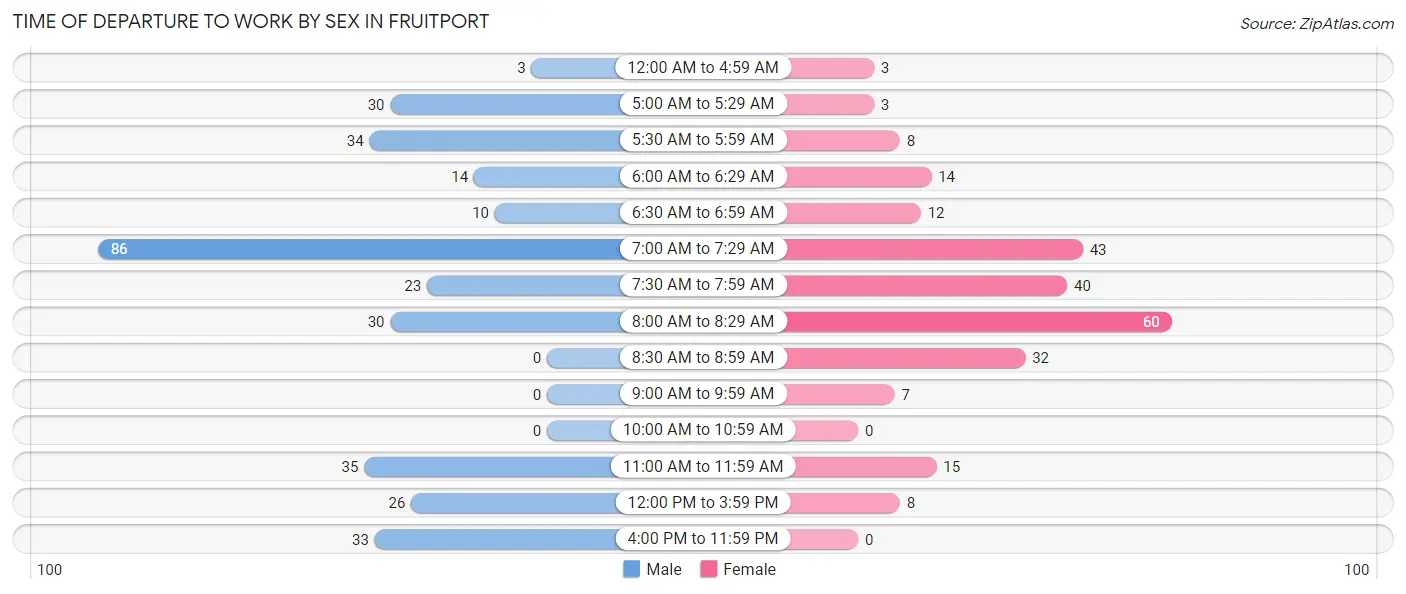
| Time of Departure | Male | Female |
| 12:00 AM to 4:59 AM | 3 (0.9%) | 3 (1.2%) |
| 5:00 AM to 5:29 AM | 30 (9.3%) | 3 (1.2%) |
| 5:30 AM to 5:59 AM | 34 (10.5%) | 8 (3.3%) |
| 6:00 AM to 6:29 AM | 14 (4.3%) | 14 (5.7%) |
| 6:30 AM to 6:59 AM | 10 (3.1%) | 12 (4.9%) |
| 7:00 AM to 7:29 AM | 86 (26.5%) | 43 (17.5%) |
| 7:30 AM to 7:59 AM | 23 (7.1%) | 40 (16.3%) |
| 8:00 AM to 8:29 AM | 30 (9.3%) | 60 (24.5%) |
| 8:30 AM to 8:59 AM | 0 (0.0%) | 32 (13.1%) |
| 9:00 AM to 9:59 AM | 0 (0.0%) | 7 (2.9%) |
| 10:00 AM to 10:59 AM | 0 (0.0%) | 0 (0.0%) |
| 11:00 AM to 11:59 AM | 35 (10.8%) | 15 (6.1%) |
| 12:00 PM to 3:59 PM | 26 (8.0%) | 8 (3.3%) |
| 4:00 PM to 11:59 PM | 33 (10.2%) | 0 (0.0%) |
| Total | 324 (100.0%) | 245 (100.0%) |
Housing Occupancy in Fruitport
Occupancy by Ownership in Fruitport
Of the total 487 dwellings in Fruitport, owner-occupied units account for 476 (97.7%), while renter-occupied units make up 11 (2.3%).
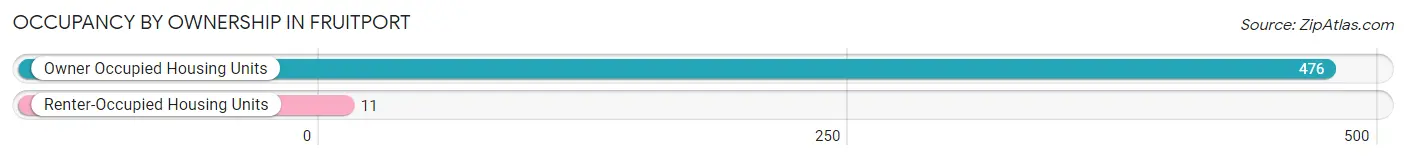
| Occupancy | # Housing Units | % Housing Units |
| Owner Occupied Housing Units | 476 | 97.7% |
| Renter-Occupied Housing Units | 11 | 2.3% |
| Total Occupied Housing Units | 487 | 100.0% |
Occupancy by Household Size in Fruitport
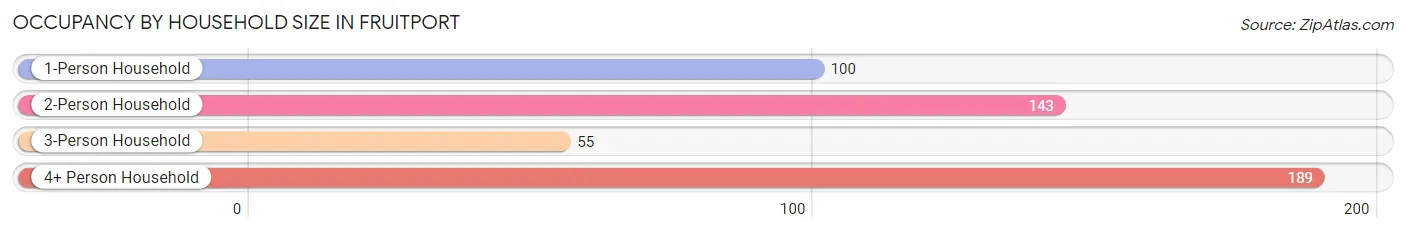
| Household Size | # Housing Units | % Housing Units |
| 1-Person Household | 100 | 20.5% |
| 2-Person Household | 143 | 29.4% |
| 3-Person Household | 55 | 11.3% |
| 4+ Person Household | 189 | 38.8% |
| Total Housing Units | 487 | 100.0% |
Occupancy by Ownership by Household Size in Fruitport
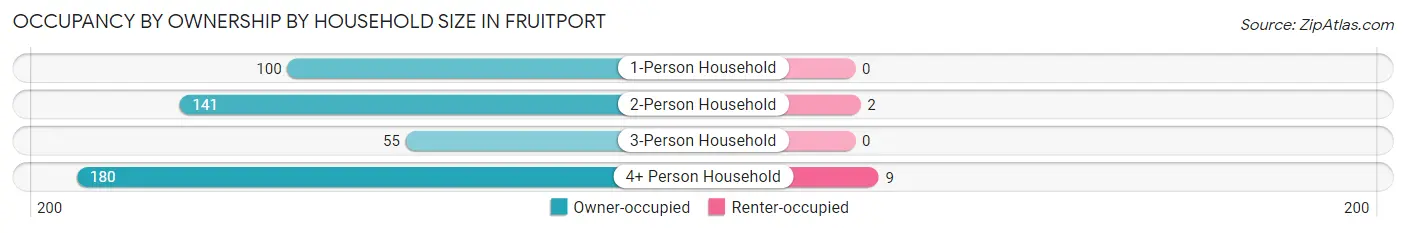
| Household Size | Owner-occupied | Renter-occupied |
| 1-Person Household | 100 (100.0%) | 0 (0.0%) |
| 2-Person Household | 141 (98.6%) | 2 (1.4%) |
| 3-Person Household | 55 (100.0%) | 0 (0.0%) |
| 4+ Person Household | 180 (95.2%) | 9 (4.8%) |
| Total Housing Units | 476 (97.7%) | 11 (2.3%) |
Occupancy by Educational Attainment in Fruitport
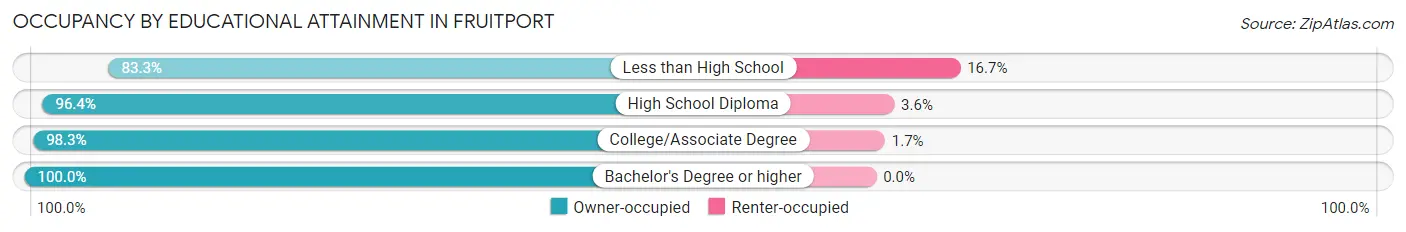
| Household Size | Owner-occupied | Renter-occupied |
| Less than High School | 10 (83.3%) | 2 (16.7%) |
| High School Diploma | 162 (96.4%) | 6 (3.6%) |
| College/Associate Degree | 171 (98.3%) | 3 (1.7%) |
| Bachelor's Degree or higher | 133 (100.0%) | 0 (0.0%) |
Occupancy by Age of Householder in Fruitport
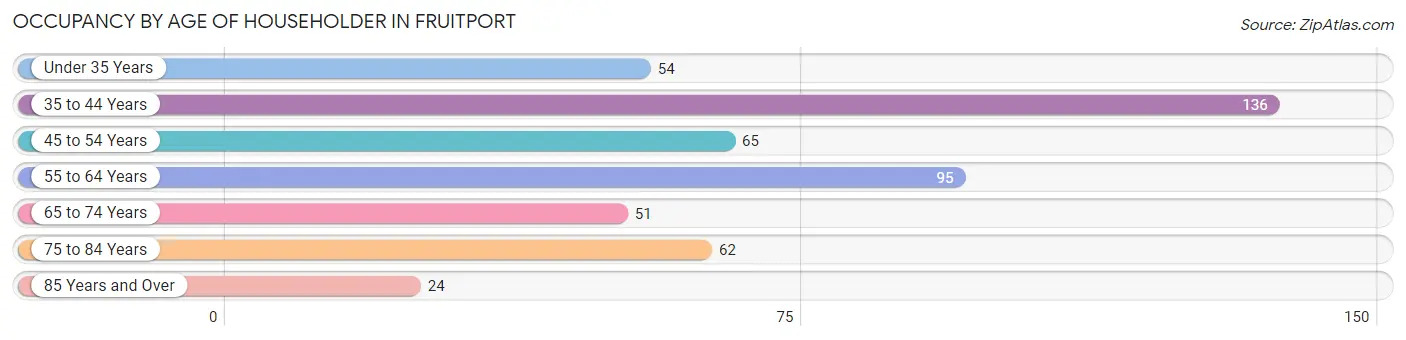
| Age Bracket | # Households | % Households |
| Under 35 Years | 54 | 11.1% |
| 35 to 44 Years | 136 | 27.9% |
| 45 to 54 Years | 65 | 13.4% |
| 55 to 64 Years | 95 | 19.5% |
| 65 to 74 Years | 51 | 10.5% |
| 75 to 84 Years | 62 | 12.7% |
| 85 Years and Over | 24 | 4.9% |
| Total | 487 | 100.0% |
Housing Finances in Fruitport
Median Income by Occupancy in Fruitport
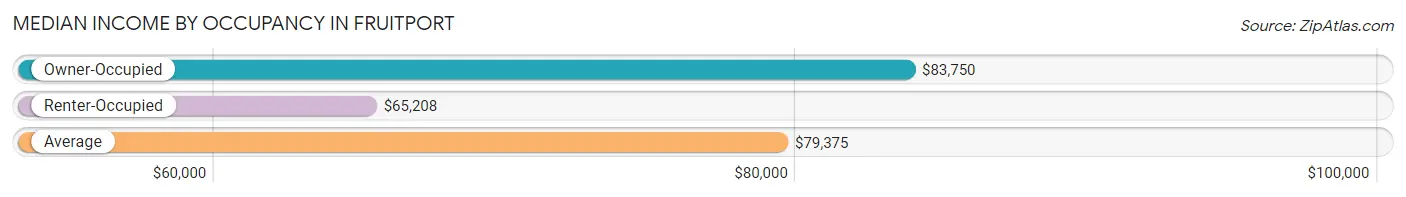
| Occupancy Type | # Households | Median Income |
| Owner-Occupied | 476 (97.7%) | $83,750 |
| Renter-Occupied | 11 (2.3%) | $65,208 |
| Average | 487 (100.0%) | $79,375 |
Occupancy by Householder Income Bracket in Fruitport
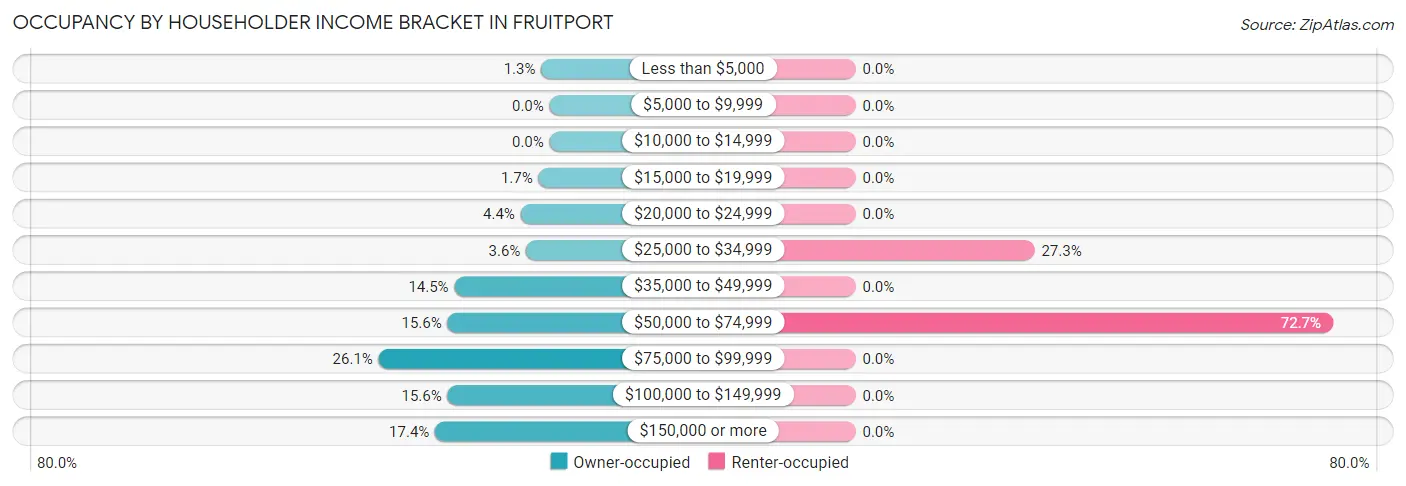
| Income Bracket | Owner-occupied | Renter-occupied |
| Less than $5,000 | 6 (1.3%) | 0 (0.0%) |
| $5,000 to $9,999 | 0 (0.0%) | 0 (0.0%) |
| $10,000 to $14,999 | 0 (0.0%) | 0 (0.0%) |
| $15,000 to $19,999 | 8 (1.7%) | 0 (0.0%) |
| $20,000 to $24,999 | 21 (4.4%) | 0 (0.0%) |
| $25,000 to $34,999 | 17 (3.6%) | 3 (27.3%) |
| $35,000 to $49,999 | 69 (14.5%) | 0 (0.0%) |
| $50,000 to $74,999 | 74 (15.5%) | 8 (72.7%) |
| $75,000 to $99,999 | 124 (26.1%) | 0 (0.0%) |
| $100,000 to $149,999 | 74 (15.5%) | 0 (0.0%) |
| $150,000 or more | 83 (17.4%) | 0 (0.0%) |
| Total | 476 (100.0%) | 11 (100.0%) |
Monthly Housing Cost Tiers in Fruitport
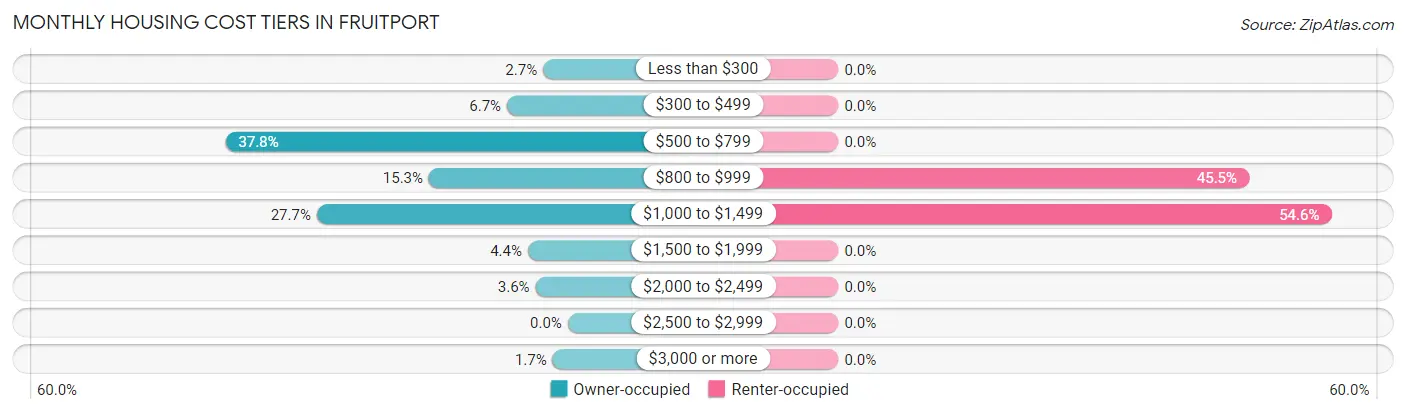
| Monthly Cost | Owner-occupied | Renter-occupied |
| Less than $300 | 13 (2.7%) | 0 (0.0%) |
| $300 to $499 | 32 (6.7%) | 0 (0.0%) |
| $500 to $799 | 180 (37.8%) | 0 (0.0%) |
| $800 to $999 | 73 (15.3%) | 5 (45.5%) |
| $1,000 to $1,499 | 132 (27.7%) | 6 (54.5%) |
| $1,500 to $1,999 | 21 (4.4%) | 0 (0.0%) |
| $2,000 to $2,499 | 17 (3.6%) | 0 (0.0%) |
| $2,500 to $2,999 | 0 (0.0%) | 0 (0.0%) |
| $3,000 or more | 8 (1.7%) | 0 (0.0%) |
| Total | 476 (100.0%) | 11 (100.0%) |
Physical Housing Characteristics in Fruitport
Housing Structures in Fruitport

| Structure Type | # Housing Units | % Housing Units |
| Single Unit, Detached | 475 | 97.5% |
| Single Unit, Attached | 0 | 0.0% |
| 2 Unit Apartments | 10 | 2.1% |
| 3 or 4 Unit Apartments | 0 | 0.0% |
| 5 to 9 Unit Apartments | 2 | 0.4% |
| 10 or more Apartments | 0 | 0.0% |
| Mobile Home / Other | 0 | 0.0% |
| Total | 487 | 100.0% |
Housing Structures by Occupancy in Fruitport
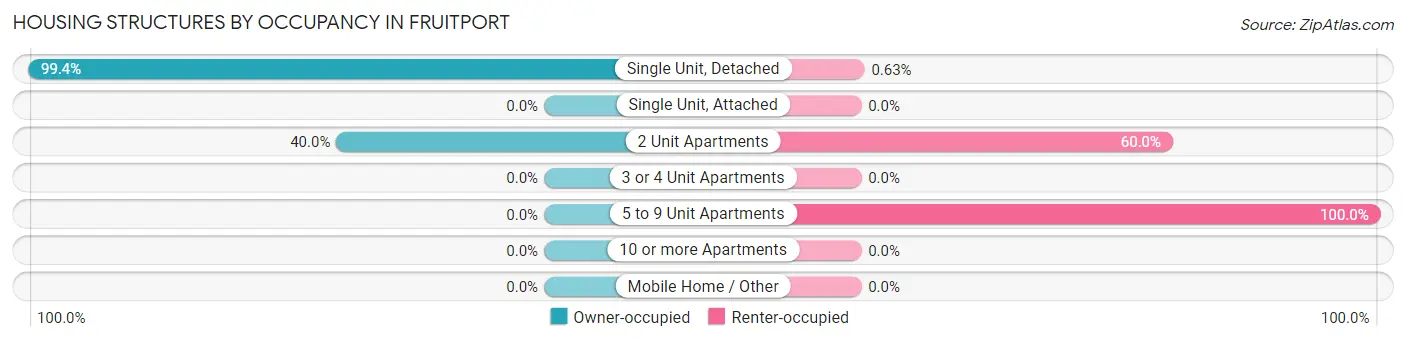
| Structure Type | Owner-occupied | Renter-occupied |
| Single Unit, Detached | 472 (99.4%) | 3 (0.6%) |
| Single Unit, Attached | 0 (0.0%) | 0 (0.0%) |
| 2 Unit Apartments | 4 (40.0%) | 6 (60.0%) |
| 3 or 4 Unit Apartments | 0 (0.0%) | 0 (0.0%) |
| 5 to 9 Unit Apartments | 0 (0.0%) | 2 (100.0%) |
| 10 or more Apartments | 0 (0.0%) | 0 (0.0%) |
| Mobile Home / Other | 0 (0.0%) | 0 (0.0%) |
| Total | 476 (97.7%) | 11 (2.3%) |
Housing Structures by Number of Rooms in Fruitport
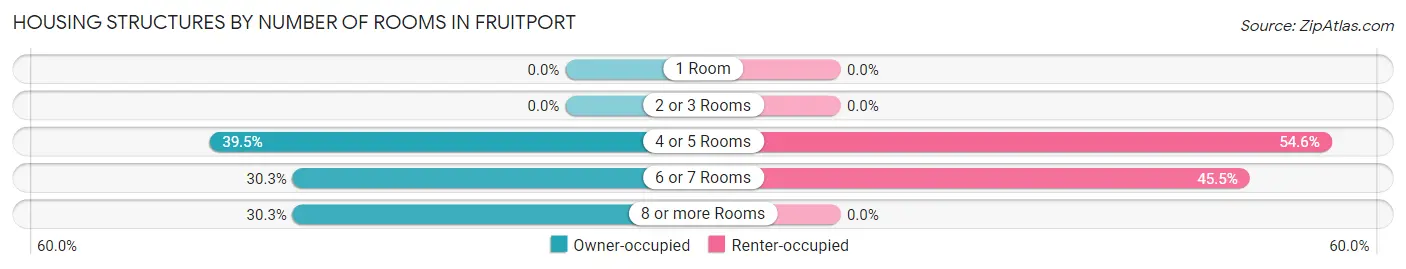
| Number of Rooms | Owner-occupied | Renter-occupied |
| 1 Room | 0 (0.0%) | 0 (0.0%) |
| 2 or 3 Rooms | 0 (0.0%) | 0 (0.0%) |
| 4 or 5 Rooms | 188 (39.5%) | 6 (54.5%) |
| 6 or 7 Rooms | 144 (30.2%) | 5 (45.5%) |
| 8 or more Rooms | 144 (30.2%) | 0 (0.0%) |
| Total | 476 (100.0%) | 11 (100.0%) |
Housing Structure by Heating Type in Fruitport
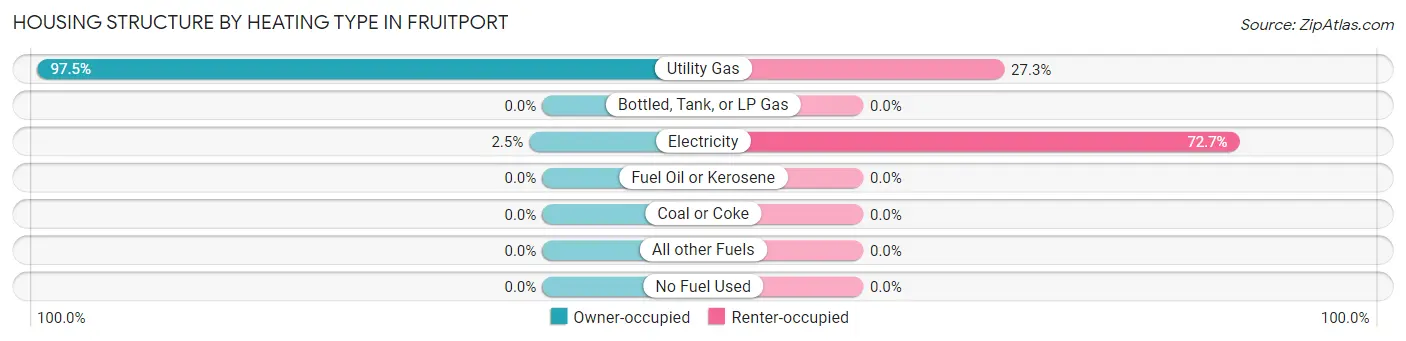
| Heating Type | Owner-occupied | Renter-occupied |
| Utility Gas | 464 (97.5%) | 3 (27.3%) |
| Bottled, Tank, or LP Gas | 0 (0.0%) | 0 (0.0%) |
| Electricity | 12 (2.5%) | 8 (72.7%) |
| Fuel Oil or Kerosene | 0 (0.0%) | 0 (0.0%) |
| Coal or Coke | 0 (0.0%) | 0 (0.0%) |
| All other Fuels | 0 (0.0%) | 0 (0.0%) |
| No Fuel Used | 0 (0.0%) | 0 (0.0%) |
| Total | 476 (100.0%) | 11 (100.0%) |
Household Vehicle Usage in Fruitport
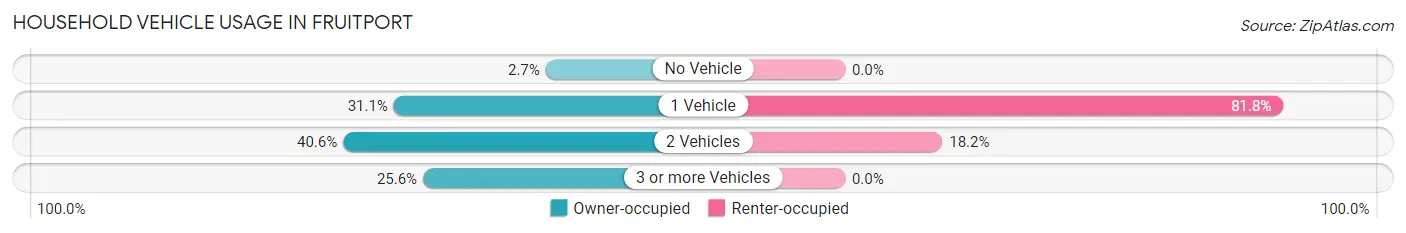
| Vehicles per Household | Owner-occupied | Renter-occupied |
| No Vehicle | 13 (2.7%) | 0 (0.0%) |
| 1 Vehicle | 148 (31.1%) | 9 (81.8%) |
| 2 Vehicles | 193 (40.6%) | 2 (18.2%) |
| 3 or more Vehicles | 122 (25.6%) | 0 (0.0%) |
| Total | 476 (100.0%) | 11 (100.0%) |
Real Estate & Mortgages in Fruitport
Real Estate and Mortgage Overview in Fruitport
| Characteristic | Without Mortgage | With Mortgage |
| Housing Units | 204 | 272 |
| Median Property Value | $166,300 | $178,900 |
| Median Household Income | $75,776 | $34 |
| Monthly Housing Costs | $552 | $8 |
| Real Estate Taxes | $2,974 | $6 |
Property Value by Mortgage Status in Fruitport
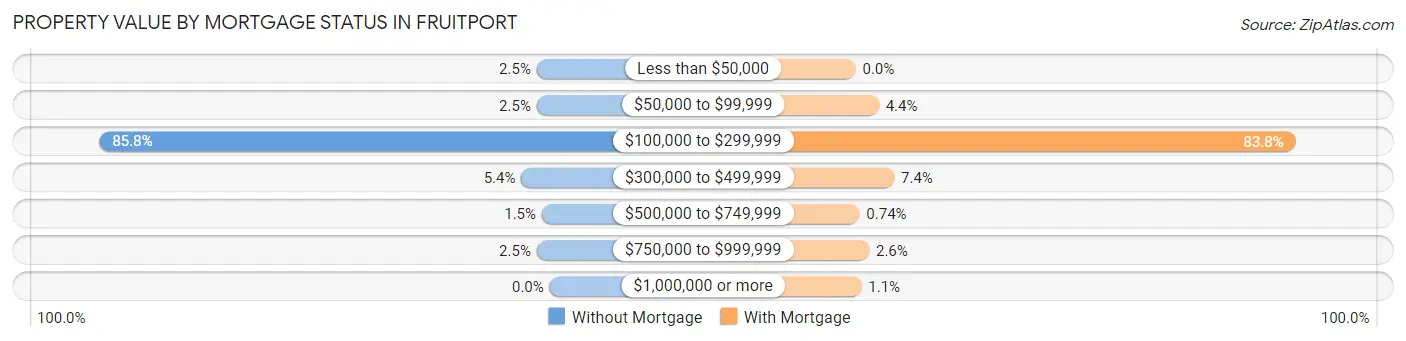
| Property Value | Without Mortgage | With Mortgage |
| Less than $50,000 | 5 (2.5%) | 0 (0.0%) |
| $50,000 to $99,999 | 5 (2.5%) | 12 (4.4%) |
| $100,000 to $299,999 | 175 (85.8%) | 228 (83.8%) |
| $300,000 to $499,999 | 11 (5.4%) | 20 (7.3%) |
| $500,000 to $749,999 | 3 (1.5%) | 2 (0.7%) |
| $750,000 to $999,999 | 5 (2.5%) | 7 (2.6%) |
| $1,000,000 or more | 0 (0.0%) | 3 (1.1%) |
| Total | 204 (100.0%) | 272 (100.0%) |
Household Income by Mortgage Status in Fruitport
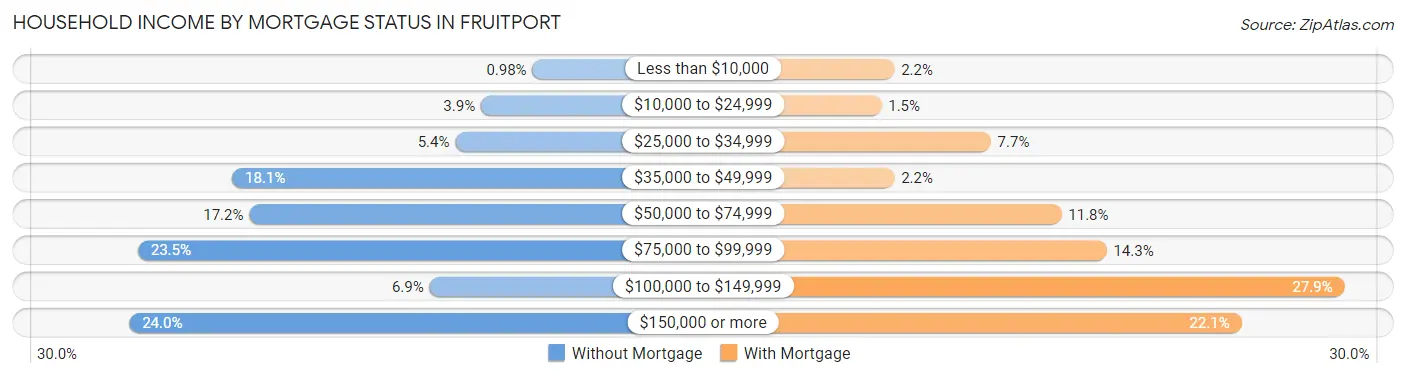
| Household Income | Without Mortgage | With Mortgage |
| Less than $10,000 | 2 (1.0%) | 6 (2.2%) |
| $10,000 to $24,999 | 8 (3.9%) | 4 (1.5%) |
| $25,000 to $34,999 | 11 (5.4%) | 21 (7.7%) |
| $35,000 to $49,999 | 37 (18.1%) | 6 (2.2%) |
| $50,000 to $74,999 | 35 (17.2%) | 32 (11.8%) |
| $75,000 to $99,999 | 48 (23.5%) | 39 (14.3%) |
| $100,000 to $149,999 | 14 (6.9%) | 76 (27.9%) |
| $150,000 or more | 49 (24.0%) | 60 (22.1%) |
| Total | 204 (100.0%) | 272 (100.0%) |
Property Value to Household Income Ratio in Fruitport
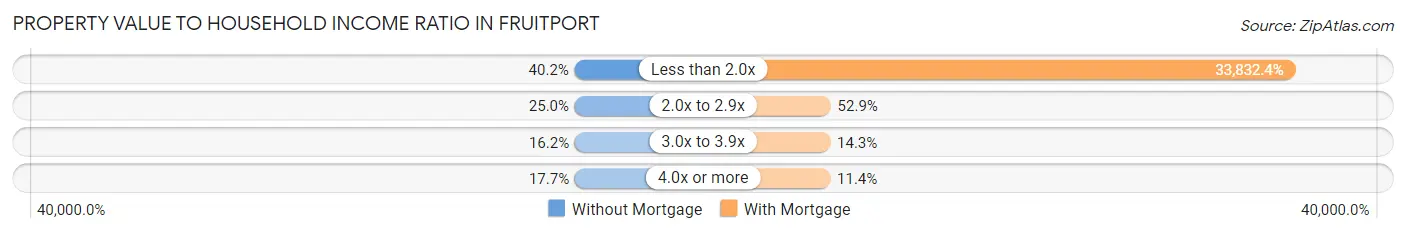
| Value-to-Income Ratio | Without Mortgage | With Mortgage |
| Less than 2.0x | 82 (40.2%) | 92,024 (33,832.4%) |
| 2.0x to 2.9x | 51 (25.0%) | 144 (52.9%) |
| 3.0x to 3.9x | 33 (16.2%) | 39 (14.3%) |
| 4.0x or more | 36 (17.6%) | 31 (11.4%) |
| Total | 204 (100.0%) | 272 (100.0%) |
Real Estate Taxes by Mortgage Status in Fruitport
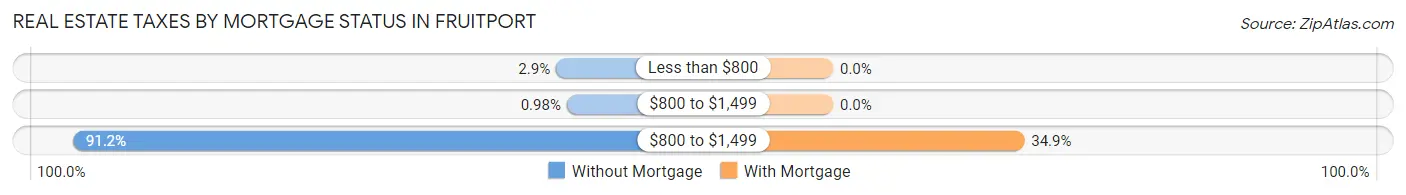
| Property Taxes | Without Mortgage | With Mortgage |
| Less than $800 | 6 (2.9%) | 0 (0.0%) |
| $800 to $1,499 | 2 (1.0%) | 0 (0.0%) |
| $800 to $1,499 | 186 (91.2%) | 95 (34.9%) |
| Total | 204 (100.0%) | 272 (100.0%) |
Health & Disability in Fruitport
Health Insurance Coverage by Age in Fruitport
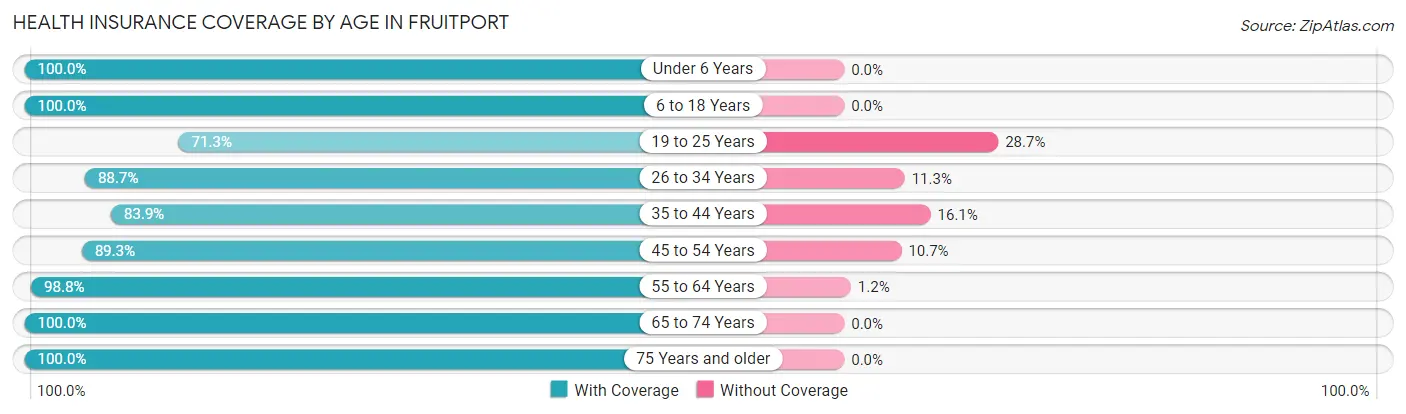
| Age Bracket | With Coverage | Without Coverage |
| Under 6 Years | 111 (100.0%) | 0 (0.0%) |
| 6 to 18 Years | 293 (100.0%) | 0 (0.0%) |
| 19 to 25 Years | 72 (71.3%) | 29 (28.7%) |
| 26 to 34 Years | 126 (88.7%) | 16 (11.3%) |
| 35 to 44 Years | 198 (83.9%) | 38 (16.1%) |
| 45 to 54 Years | 109 (89.3%) | 13 (10.7%) |
| 55 to 64 Years | 160 (98.8%) | 2 (1.2%) |
| 65 to 74 Years | 107 (100.0%) | 0 (0.0%) |
| 75 Years and older | 114 (100.0%) | 0 (0.0%) |
| Total | 1,290 (92.9%) | 98 (7.1%) |
Health Insurance Coverage by Citizenship Status in Fruitport
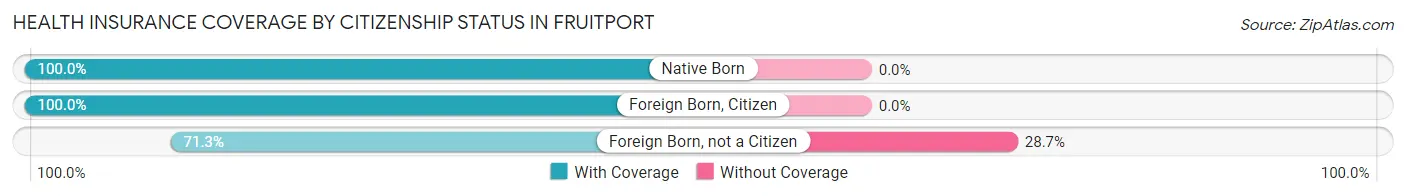
| Citizenship Status | With Coverage | Without Coverage |
| Native Born | 111 (100.0%) | 0 (0.0%) |
| Foreign Born, Citizen | 293 (100.0%) | 0 (0.0%) |
| Foreign Born, not a Citizen | 72 (71.3%) | 29 (28.7%) |
Health Insurance Coverage by Household Income in Fruitport
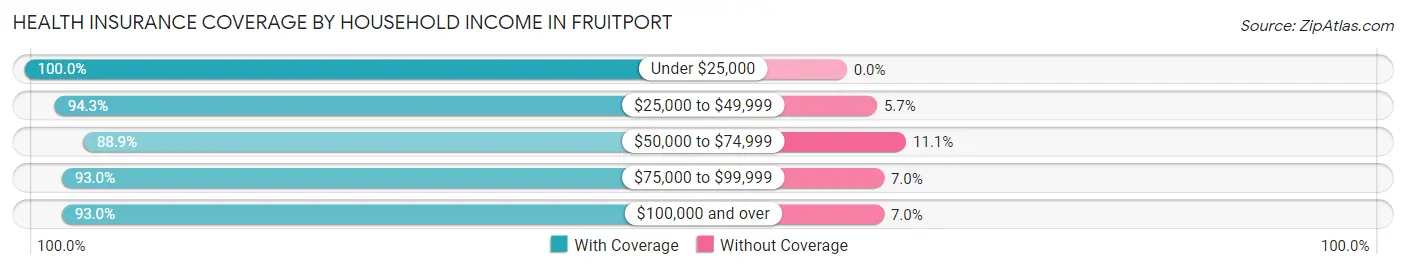
| Household Income | With Coverage | Without Coverage |
| Under $25,000 | 55 (100.0%) | 0 (0.0%) |
| $25,000 to $49,999 | 250 (94.3%) | 15 (5.7%) |
| $50,000 to $74,999 | 184 (88.9%) | 23 (11.1%) |
| $75,000 to $99,999 | 414 (93.0%) | 31 (7.0%) |
| $100,000 and over | 387 (93.0%) | 29 (7.0%) |
Public vs Private Health Insurance Coverage by Age in Fruitport
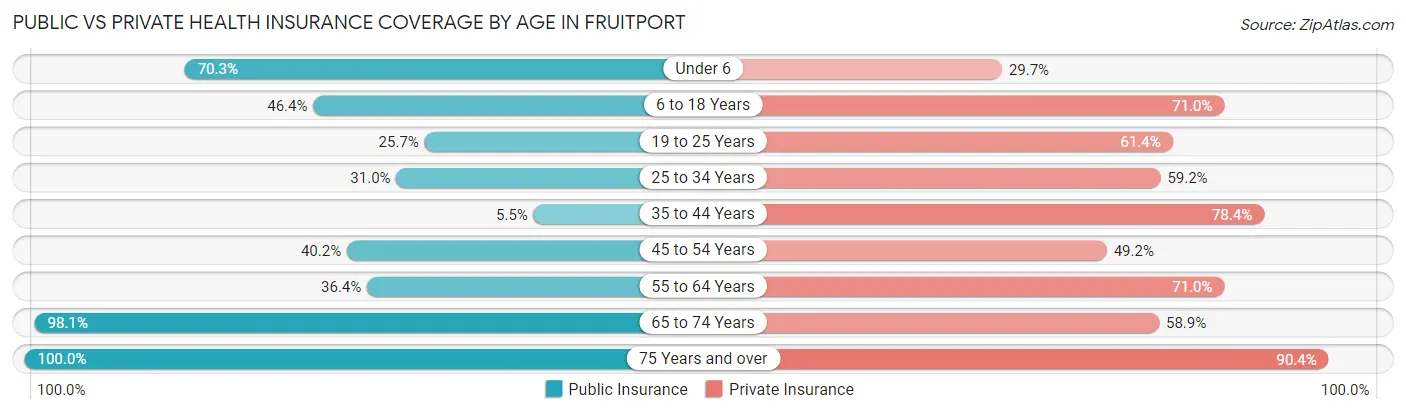
| Age Bracket | Public Insurance | Private Insurance |
| Under 6 | 78 (70.3%) | 33 (29.7%) |
| 6 to 18 Years | 136 (46.4%) | 208 (71.0%) |
| 19 to 25 Years | 26 (25.7%) | 62 (61.4%) |
| 25 to 34 Years | 44 (31.0%) | 84 (59.2%) |
| 35 to 44 Years | 13 (5.5%) | 185 (78.4%) |
| 45 to 54 Years | 49 (40.2%) | 60 (49.2%) |
| 55 to 64 Years | 59 (36.4%) | 115 (71.0%) |
| 65 to 74 Years | 105 (98.1%) | 63 (58.9%) |
| 75 Years and over | 114 (100.0%) | 103 (90.3%) |
| Total | 624 (45.0%) | 913 (65.8%) |
Disability Status by Sex by Age in Fruitport
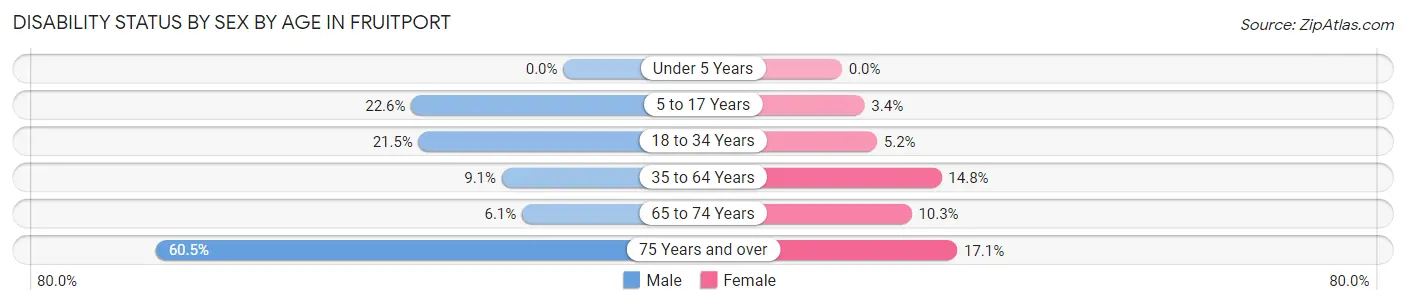
| Age Bracket | Male | Female |
| Under 5 Years | 0 (0.0%) | 0 (0.0%) |
| 5 to 17 Years | 35 (22.6%) | 5 (3.4%) |
| 18 to 34 Years | 32 (21.5%) | 5 (5.2%) |
| 35 to 64 Years | 24 (9.1%) | 38 (14.8%) |
| 65 to 74 Years | 3 (6.1%) | 6 (10.3%) |
| 75 Years and over | 23 (60.5%) | 13 (17.1%) |
Disability Class by Sex by Age in Fruitport
Disability Class: Hearing Difficulty
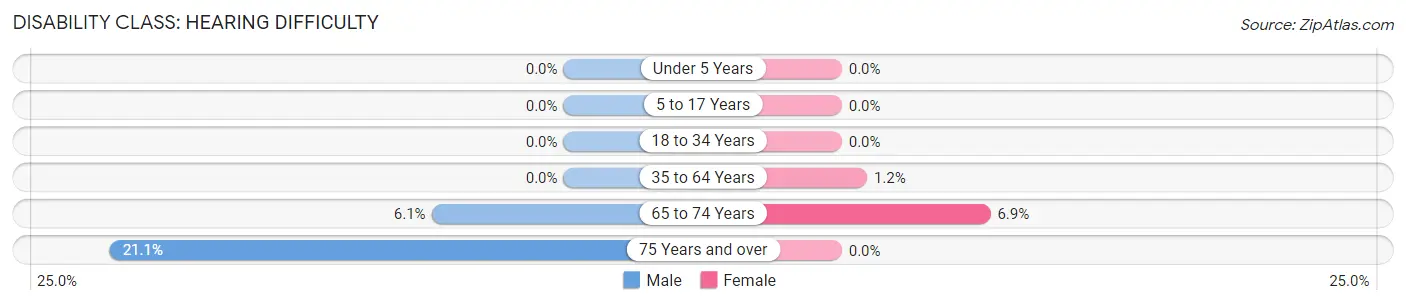
| Age Bracket | Male | Female |
| Under 5 Years | 0 (0.0%) | 0 (0.0%) |
| 5 to 17 Years | 0 (0.0%) | 0 (0.0%) |
| 18 to 34 Years | 0 (0.0%) | 0 (0.0%) |
| 35 to 64 Years | 0 (0.0%) | 3 (1.2%) |
| 65 to 74 Years | 3 (6.1%) | 4 (6.9%) |
| 75 Years and over | 8 (21.0%) | 0 (0.0%) |
Disability Class: Vision Difficulty
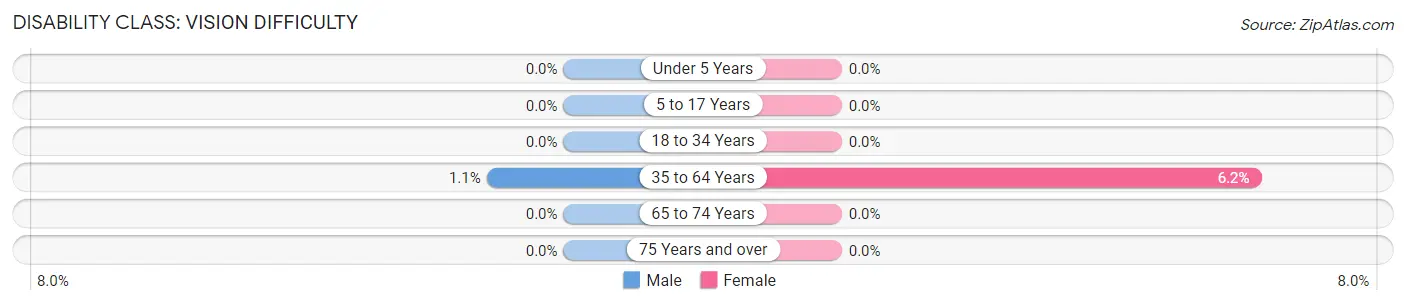
| Age Bracket | Male | Female |
| Under 5 Years | 0 (0.0%) | 0 (0.0%) |
| 5 to 17 Years | 0 (0.0%) | 0 (0.0%) |
| 18 to 34 Years | 0 (0.0%) | 0 (0.0%) |
| 35 to 64 Years | 3 (1.1%) | 16 (6.2%) |
| 65 to 74 Years | 0 (0.0%) | 0 (0.0%) |
| 75 Years and over | 0 (0.0%) | 0 (0.0%) |
Disability Class: Cognitive Difficulty
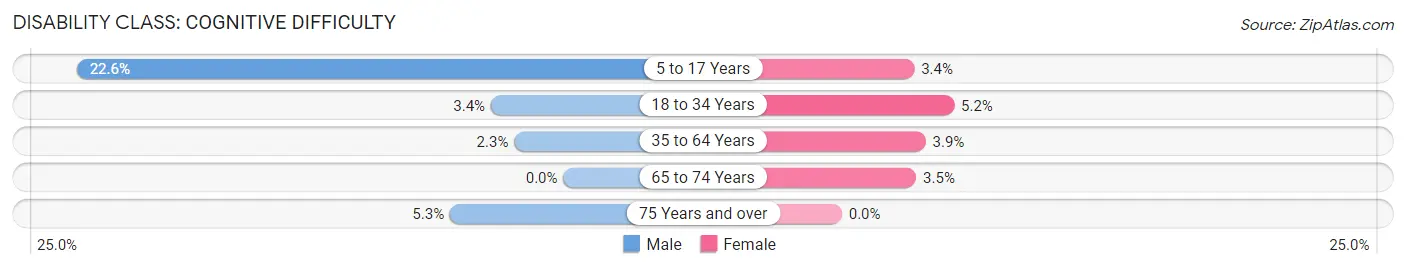
| Age Bracket | Male | Female |
| 5 to 17 Years | 35 (22.6%) | 5 (3.4%) |
| 18 to 34 Years | 5 (3.4%) | 5 (5.2%) |
| 35 to 64 Years | 6 (2.3%) | 10 (3.9%) |
| 65 to 74 Years | 0 (0.0%) | 2 (3.5%) |
| 75 Years and over | 2 (5.3%) | 0 (0.0%) |
Disability Class: Ambulatory Difficulty
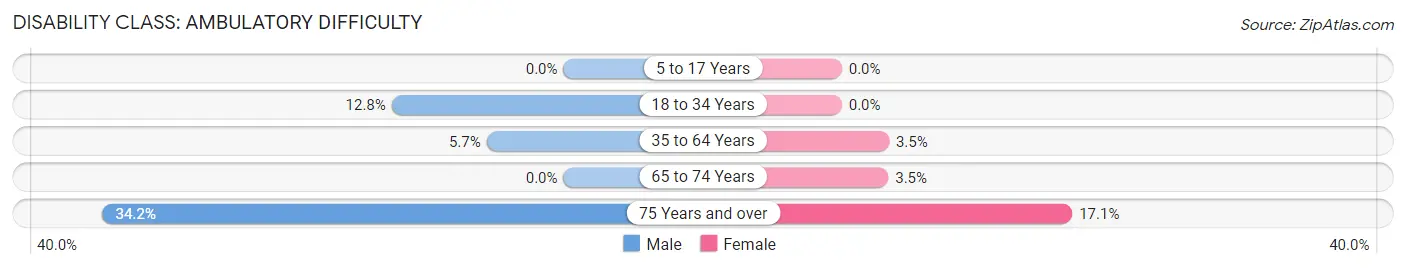
| Age Bracket | Male | Female |
| 5 to 17 Years | 0 (0.0%) | 0 (0.0%) |
| 18 to 34 Years | 19 (12.8%) | 0 (0.0%) |
| 35 to 64 Years | 15 (5.7%) | 9 (3.5%) |
| 65 to 74 Years | 0 (0.0%) | 2 (3.5%) |
| 75 Years and over | 13 (34.2%) | 13 (17.1%) |
Disability Class: Self-Care Difficulty
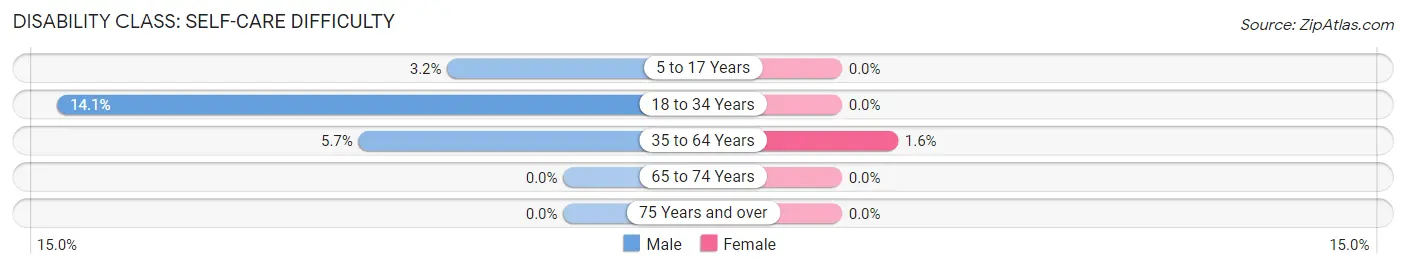
| Age Bracket | Male | Female |
| 5 to 17 Years | 5 (3.2%) | 0 (0.0%) |
| 18 to 34 Years | 21 (14.1%) | 0 (0.0%) |
| 35 to 64 Years | 15 (5.7%) | 4 (1.6%) |
| 65 to 74 Years | 0 (0.0%) | 0 (0.0%) |
| 75 Years and over | 0 (0.0%) | 0 (0.0%) |
Technology Access in Fruitport
Computing Device Access in Fruitport
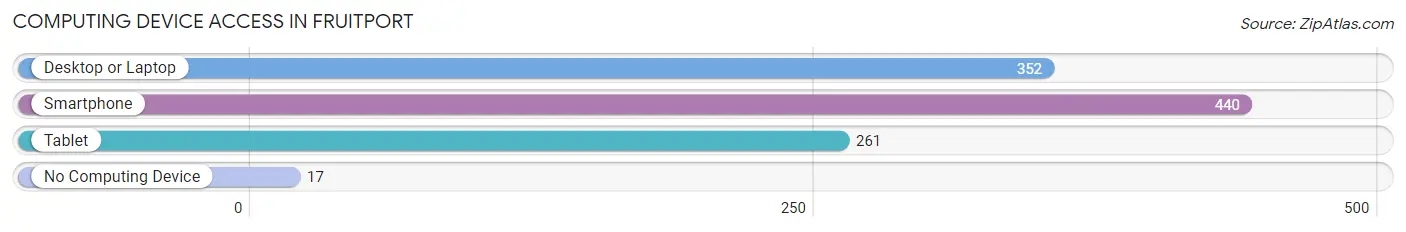
| Device Type | # Households | % Households |
| Desktop or Laptop | 352 | 72.3% |
| Smartphone | 440 | 90.3% |
| Tablet | 261 | 53.6% |
| No Computing Device | 17 | 3.5% |
| Total | 487 | 100.0% |
Internet Access in Fruitport
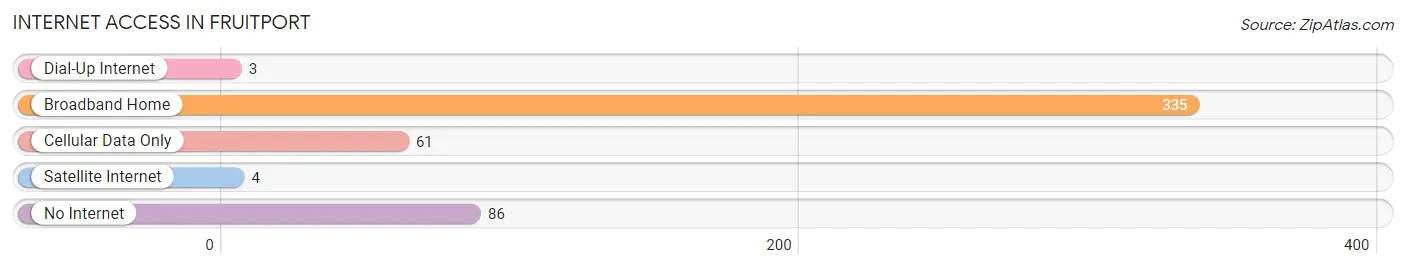
| Internet Type | # Households | % Households |
| Dial-Up Internet | 3 | 0.6% |
| Broadband Home | 335 | 68.8% |
| Cellular Data Only | 61 | 12.5% |
| Satellite Internet | 4 | 0.8% |
| No Internet | 86 | 17.7% |
| Total | 487 | 100.0% |
Fruitport Summary
Fruitport is a small village located in Muskegon County, Michigan. It is situated on the eastern shore of Lake Michigan, about 10 miles north of Muskegon. The village has a population of 2,717 people, according to the 2010 census.
Geography
Fruitport is located in the northwest corner of Muskegon County, Michigan. It is situated on the eastern shore of Lake Michigan, about 10 miles north of Muskegon. The village is bordered by the cities of Norton Shores and Muskegon Heights to the south, and the townships of Fruitland and Ravenna to the north and east. The village is located in the Muskegon River watershed, and is drained by the Muskegon River and its tributaries. The village is located on a flat plain, with an elevation of 645 feet above sea level.
History
Fruitport was first settled in 1855 by a group of Dutch immigrants. The village was originally known as "Fruitland", and was named for the abundance of fruit trees in the area. The village was incorporated in 1867, and the name was changed to "Fruitport" in 1871.
The village grew rapidly in the late 19th century, and by the early 20th century, it had become a popular summer resort destination. The village was home to several resorts, including the Fruitport Hotel, which was built in 1891. The village also had a large amusement park, which was built in the early 1900s.
The village experienced a period of decline in the mid-20th century, as the resorts and amusement park closed. However, the village has experienced a resurgence in recent years, with the opening of several new businesses and the development of a new marina.
Economy
Fruitport's economy is largely based on tourism and retail. The village is home to several small businesses, including restaurants, shops, and a marina. The village also has a small industrial park, which is home to several manufacturing companies.
The village is also home to several large employers, including the Muskegon County Airport, which is located just outside of the village. The airport is home to several airlines, including Delta, United, and American. The airport also serves as a hub for cargo and freight services.
Demographics
As of the 2010 census, Fruitport had a population of 2,717 people. The racial makeup of the village was 94.3% White, 1.2% African American, 0.7% Native American, 0.7% Asian, 0.1% Pacific Islander, 1.2% from other races, and 1.9% from two or more races. Hispanic or Latino of any race were 3.2% of the population.
The median household income in Fruitport was $41,944, and the median family income was $50,917. The per capita income for the village was $20,945. About 8.3% of families and 10.3% of the population were below the poverty line, including 14.2% of those under age 18 and 5.2% of those age 65 or over.
Fruitport is served by the Fruitport Community Schools, which includes Fruitport High School. The village is also home to several churches, including the Fruitport United Methodist Church, the Fruitport Reformed Church, and the Fruitport Baptist Church.
Common Questions
What is Per Capita Income in Fruitport?
Per Capita income in Fruitport is $62,185.
What is the Median Family Income in Fruitport?
Median Family Income in Fruitport is $79,375.
What is the Median Household income in Fruitport?
Median Household Income in Fruitport is $79,375.
What is Income or Wage Gap in Fruitport?
Income or Wage Gap in Fruitport is 49.7%.
Women in Fruitport earn 50.3 cents for every dollar earned by a man.
What is Inequality or Gini Index in Fruitport?
Inequality or Gini Index in Fruitport is 0.61.
What is the Total Population of Fruitport?
Total Population of Fruitport is 1,388.
What is the Total Male Population of Fruitport?
Total Male Population of Fruitport is 691.
What is the Total Female Population of Fruitport?
Total Female Population of Fruitport is 697.
What is the Ratio of Males per 100 Females in Fruitport?
There are 99.14 Males per 100 Females in Fruitport.
What is the Ratio of Females per 100 Males in Fruitport?
There are 100.87 Females per 100 Males in Fruitport.
What is the Median Population Age in Fruitport?
Median Population Age in Fruitport is 38.1 Years.
What is the Average Family Size in Fruitport
Average Family Size in Fruitport is 3.4 People.
What is the Average Household Size in Fruitport
Average Household Size in Fruitport is 2.9 People.
How Large is the Labor Force in Fruitport?
There are 660 People in the Labor Forcein in Fruitport.
What is the Percentage of People in the Labor Force in Fruitport?
64.0% of People are in the Labor Force in Fruitport.
What is the Unemployment Rate in Fruitport?
Unemployment Rate in Fruitport is 5.9%.