Williamston, MI Map & Demographics
Williamston Map
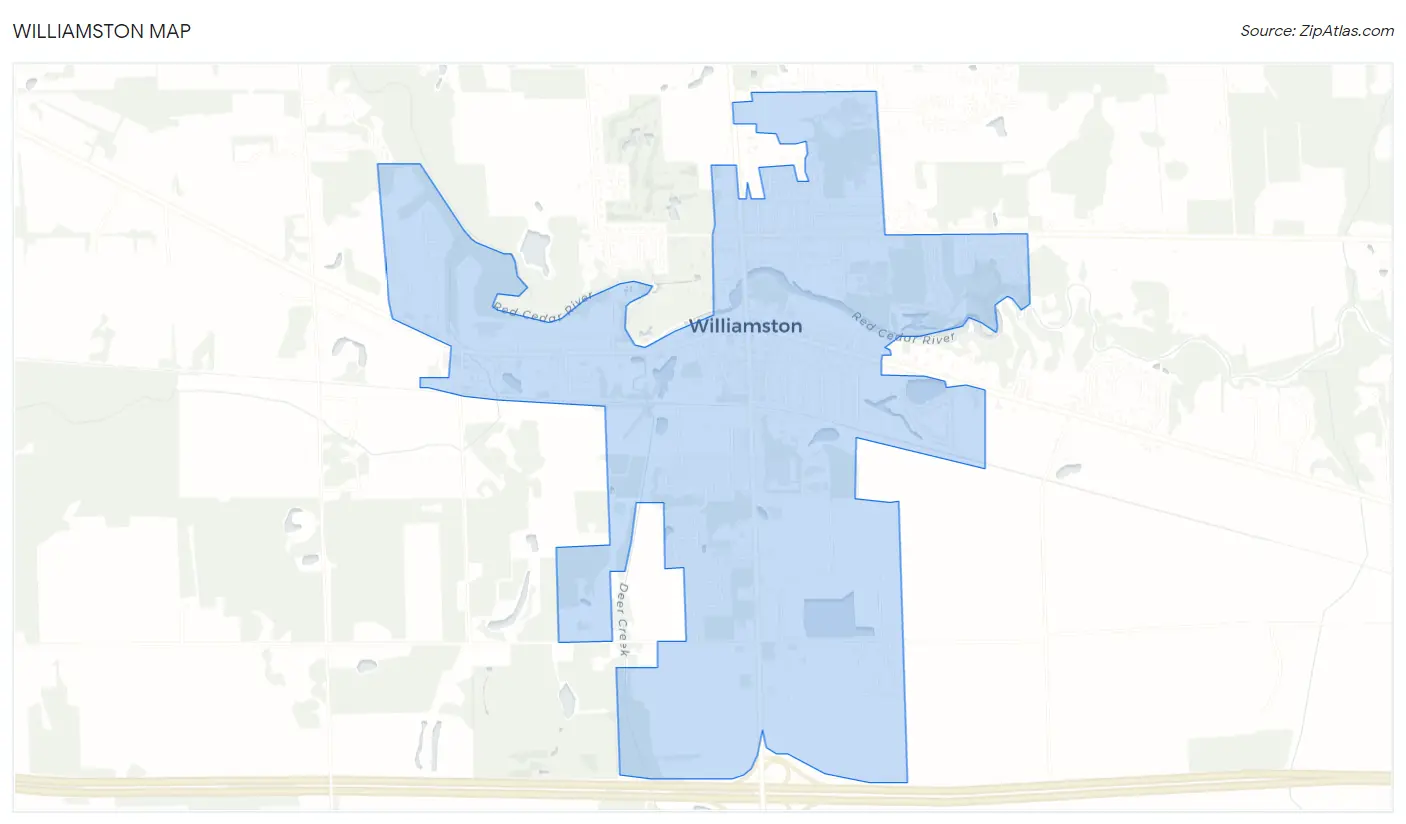
Williamston Overview
$51,635
PER CAPITA INCOME
$120,028
AVG FAMILY INCOME
$76,086
AVG HOUSEHOLD INCOME
14.6%
WAGE / INCOME GAP [ % ]
85.4¢/ $1
WAGE / INCOME GAP [ $ ]
0.52
INEQUALITY / GINI INDEX
3,810
TOTAL POPULATION
1,738
MALE POPULATION
2,072
FEMALE POPULATION
83.88
MALES / 100 FEMALES
119.22
FEMALES / 100 MALES
40.2
MEDIAN AGE
2.9
AVG FAMILY SIZE
2.2
AVG HOUSEHOLD SIZE
2,048
LABOR FORCE [ PEOPLE ]
70.0%
PERCENT IN LABOR FORCE
4.3%
UNEMPLOYMENT RATE
Williamston Zip Codes
Williamston Area Codes
Income in Williamston
Income Overview in Williamston
Per Capita Income in Williamston is $51,635, while median incomes of families and households are $120,028 and $76,086 respectively.
| Characteristic | Number | Measure |
| Per Capita Income | 3,810 | $51,635 |
| Median Family Income | 982 | $120,028 |
| Mean Family Income | 982 | $143,310 |
| Median Household Income | 1,753 | $76,086 |
| Mean Household Income | 1,753 | $111,670 |
| Income Deficit | 982 | $0 |
| Wage / Income Gap (%) | 3,810 | 14.64% |
| Wage / Income Gap ($) | 3,810 | 85.36¢ per $1 |
| Gini / Inequality Index | 3,810 | 0.52 |
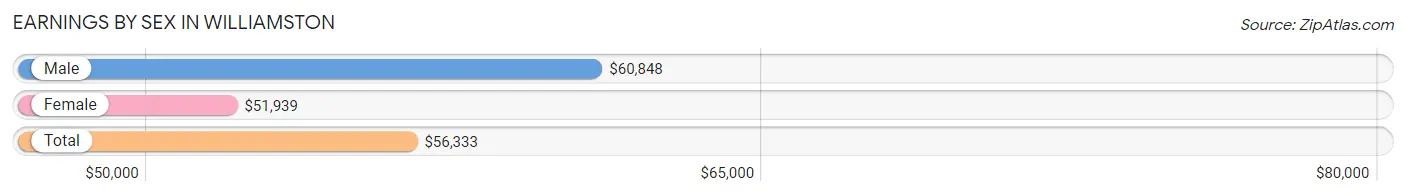
Earnings by Sex in Williamston
Average Earnings in Williamston are $56,333, $60,848 for men and $51,939 for women, a difference of 14.6%.
| Sex | Number | Average Earnings |
| Male | 1,043 (49.9%) | $60,848 |
| Female | 1,047 (50.1%) | $51,939 |
| Total | 2,090 (100.0%) | $56,333 |
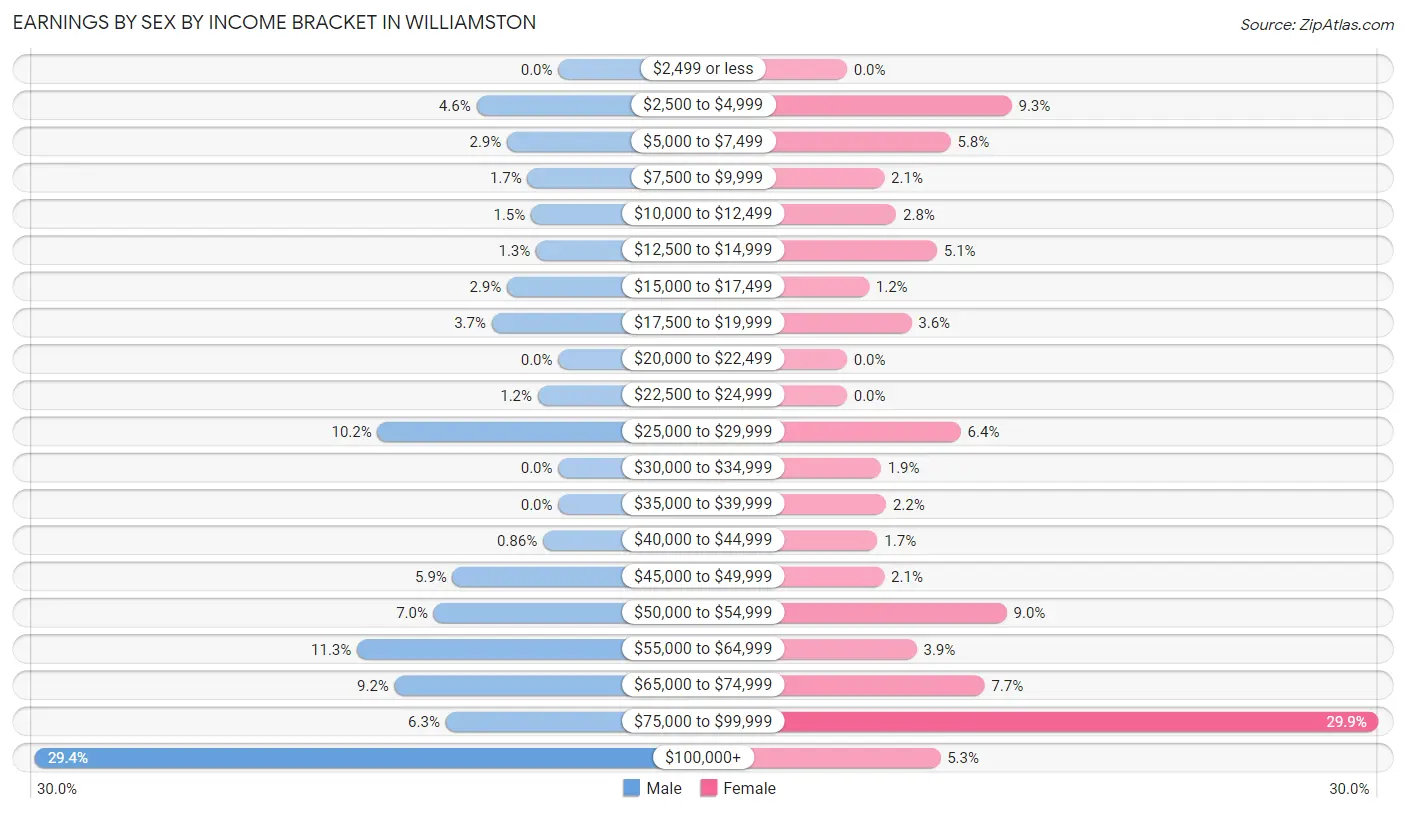
Earnings by Sex by Income Bracket in Williamston
The most common earnings brackets in Williamston are $100,000+ for men (307 | 29.4%) and $75,000 to $99,999 for women (313 | 29.9%).
| Income | Male | Female |
| $2,499 or less | 0 (0.0%) | 0 (0.0%) |
| $2,500 to $4,999 | 48 (4.6%) | 97 (9.3%) |
| $5,000 to $7,499 | 30 (2.9%) | 61 (5.8%) |
| $7,500 to $9,999 | 18 (1.7%) | 22 (2.1%) |
| $10,000 to $12,499 | 16 (1.5%) | 29 (2.8%) |
| $12,500 to $14,999 | 13 (1.3%) | 53 (5.1%) |
| $15,000 to $17,499 | 30 (2.9%) | 13 (1.2%) |
| $17,500 to $19,999 | 39 (3.7%) | 38 (3.6%) |
| $20,000 to $22,499 | 0 (0.0%) | 0 (0.0%) |
| $22,500 to $24,999 | 12 (1.1%) | 0 (0.0%) |
| $25,000 to $29,999 | 106 (10.2%) | 67 (6.4%) |
| $30,000 to $34,999 | 0 (0.0%) | 20 (1.9%) |
| $35,000 to $39,999 | 0 (0.0%) | 23 (2.2%) |
| $40,000 to $44,999 | 9 (0.9%) | 18 (1.7%) |
| $45,000 to $49,999 | 62 (5.9%) | 22 (2.1%) |
| $50,000 to $54,999 | 73 (7.0%) | 94 (9.0%) |
| $55,000 to $64,999 | 118 (11.3%) | 41 (3.9%) |
| $65,000 to $74,999 | 96 (9.2%) | 81 (7.7%) |
| $75,000 to $99,999 | 66 (6.3%) | 313 (29.9%) |
| $100,000+ | 307 (29.4%) | 55 (5.2%) |
| Total | 1,043 (100.0%) | 1,047 (100.0%) |
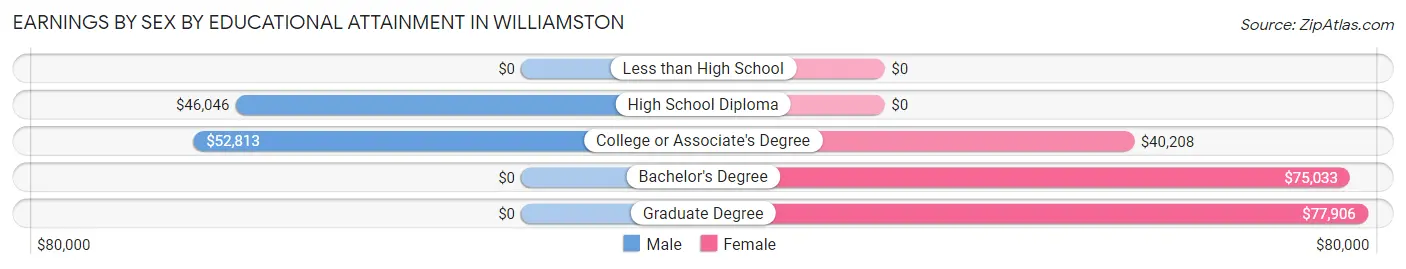
Earnings by Sex by Educational Attainment in Williamston
Average earnings in Williamston are $67,997 for men and $65,167 for women, a difference of 4.2%. Men with an educational attainment of college or associate's degree enjoy the highest average annual earnings of $52,813, while those with high school diploma education earn the least with $46,046. Women with an educational attainment of graduate degree earn the most with the average annual earnings of $77,906, while those with college or associate's degree education have the smallest earnings of $40,208.
| Educational Attainment | Male Income | Female Income |
| Less than High School | - | - |
| High School Diploma | $46,046 | $0 |
| College or Associate's Degree | $52,813 | $40,208 |
| Bachelor's Degree | - | - |
| Graduate Degree | - | - |
| Total | $67,997 | $65,167 |
Family Income in Williamston
Family Income Brackets in Williamston
According to the Williamston family income data, there are 245 families falling into the $200,000+ income range, which is the most common income bracket and makes up 24.9% of all families.
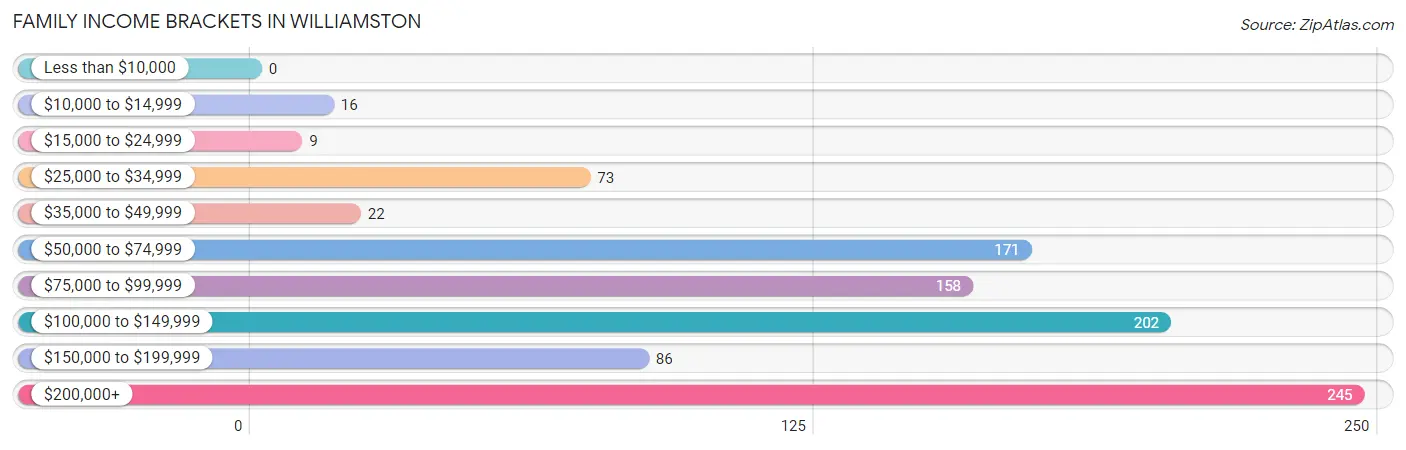
| Income Bracket | # Families | % Families |
| Less than $10,000 | 0 | 0.0% |
| $10,000 to $14,999 | 16 | 1.6% |
| $15,000 to $24,999 | 9 | 0.9% |
| $25,000 to $34,999 | 73 | 7.4% |
| $35,000 to $49,999 | 22 | 2.2% |
| $50,000 to $74,999 | 171 | 17.4% |
| $75,000 to $99,999 | 158 | 16.1% |
| $100,000 to $149,999 | 202 | 20.6% |
| $150,000 to $199,999 | 86 | 8.8% |
| $200,000+ | 245 | 24.9% |
Family Income by Famaliy Size in Williamston
3-person families (76 | 7.7%) account for the highest median family income in Williamston with $147,500 per family, while 2-person families (636 | 64.8%) have the highest median income of $51,953 per family member.
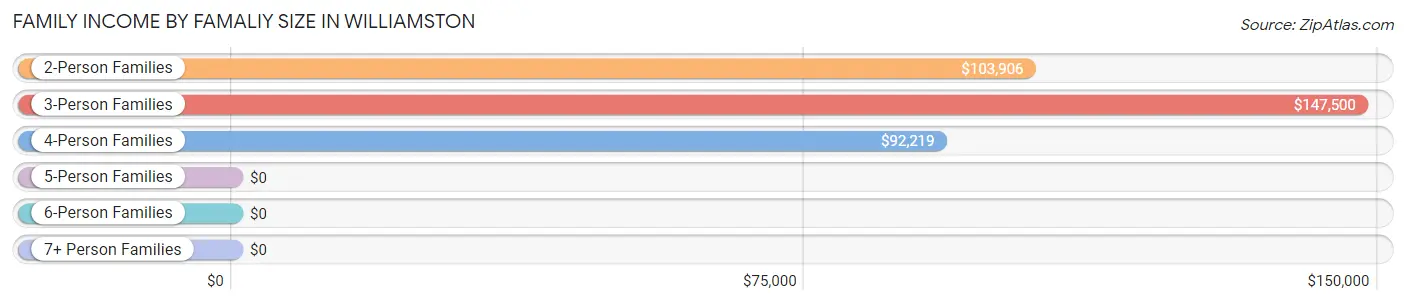
| Income Bracket | # Families | Median Income |
| 2-Person Families | 636 (64.8%) | $103,906 |
| 3-Person Families | 76 (7.7%) | $147,500 |
| 4-Person Families | 131 (13.3%) | $92,219 |
| 5-Person Families | 12 (1.2%) | $0 |
| 6-Person Families | 127 (12.9%) | $0 |
| 7+ Person Families | 0 (0.0%) | $0 |
| Total | 982 (100.0%) | $120,028 |
Family Income by Number of Earners in Williamston
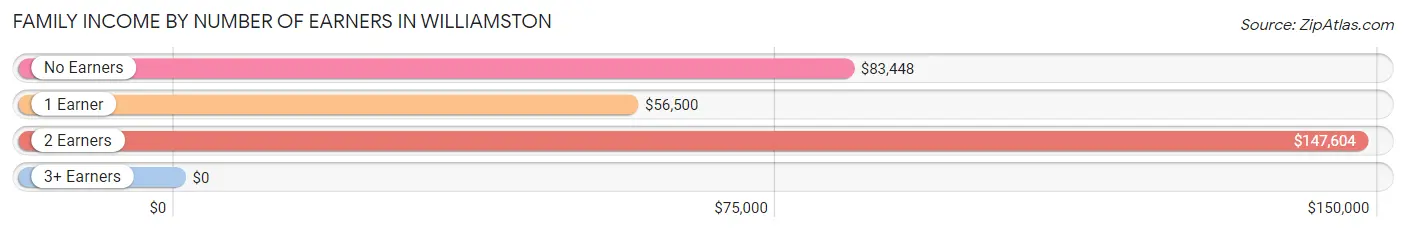
| Number of Earners | # Families | Median Income |
| No Earners | 104 (10.6%) | $83,448 |
| 1 Earner | 230 (23.4%) | $56,500 |
| 2 Earners | 583 (59.4%) | $147,604 |
| 3+ Earners | 65 (6.6%) | $0 |
| Total | 982 (100.0%) | $120,028 |
Household Income in Williamston
Household Income Brackets in Williamston
With 279 households falling in the category, the $75,000 to $99,999 income range is the most frequent in Williamston, accounting for 15.9% of all households. In contrast, only 46 households (2.6%) fall into the less than $10,000 income bracket, making it the least populous group.
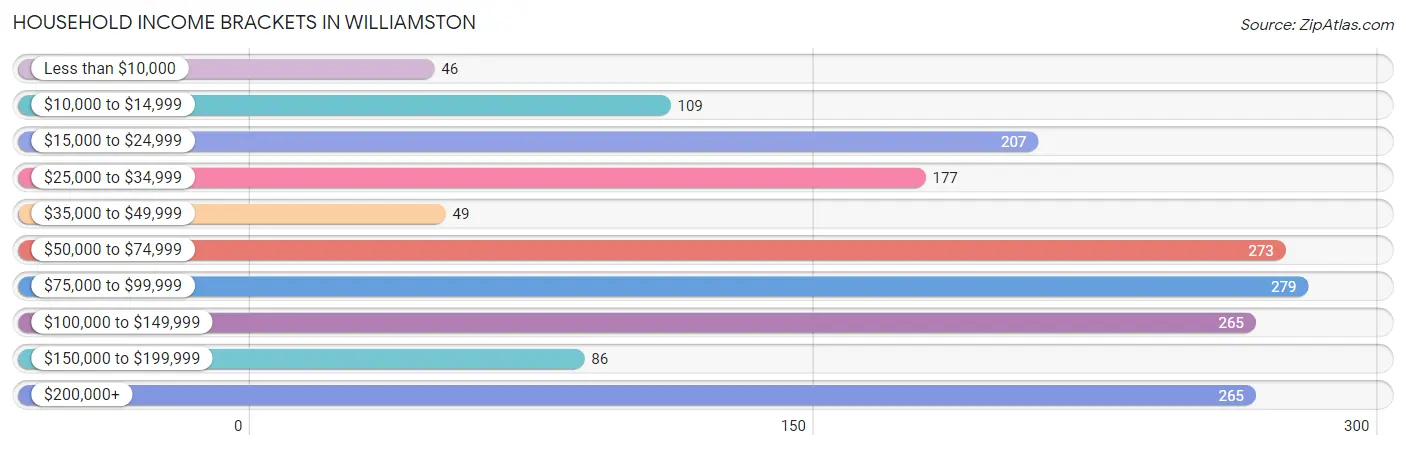
| Income Bracket | # Households | % Households |
| Less than $10,000 | 46 | 2.6% |
| $10,000 to $14,999 | 109 | 6.2% |
| $15,000 to $24,999 | 207 | 11.8% |
| $25,000 to $34,999 | 177 | 10.1% |
| $35,000 to $49,999 | 49 | 2.8% |
| $50,000 to $74,999 | 273 | 15.6% |
| $75,000 to $99,999 | 279 | 15.9% |
| $100,000 to $149,999 | 265 | 15.1% |
| $150,000 to $199,999 | 86 | 4.9% |
| $200,000+ | 265 | 15.1% |
Household Income by Householder Age in Williamston
The median household income in Williamston is $76,086, with the highest median household income of $100,743 found in the 45 to 64 years age bracket for the primary householder. A total of 652 households (37.2%) fall into this category. Meanwhile, the 15 to 24 years age bracket for the primary householder has the lowest median household income of $28,649, with 130 households (7.4%) in this group.
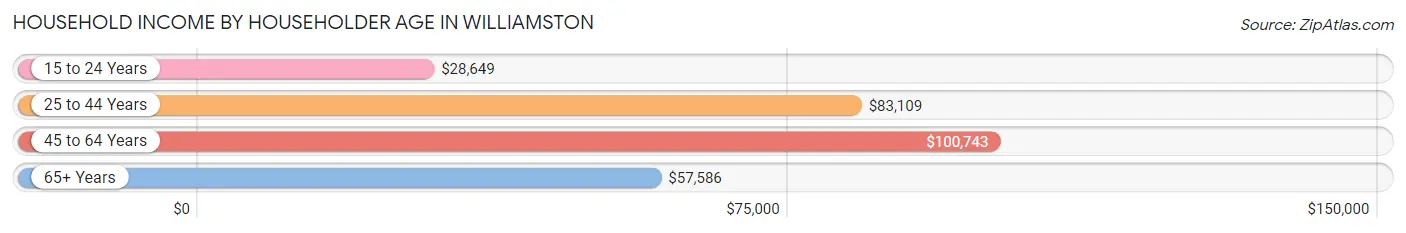
| Income Bracket | # Households | Median Income |
| 15 to 24 Years | 130 (7.4%) | $28,649 |
| 25 to 44 Years | 491 (28.0%) | $83,109 |
| 45 to 64 Years | 652 (37.2%) | $100,743 |
| 65+ Years | 480 (27.4%) | $57,586 |
| Total | 1,753 (100.0%) | $76,086 |
Poverty in Williamston
Income Below Poverty by Sex and Age in Williamston
With 6.7% poverty level for males and 7.7% for females among the residents of Williamston, 45 to 54 year old males and 25 to 34 year old females are the most vulnerable to poverty, with 59 males (29.5%) and 47 females (23.9%) in their respective age groups living below the poverty level.
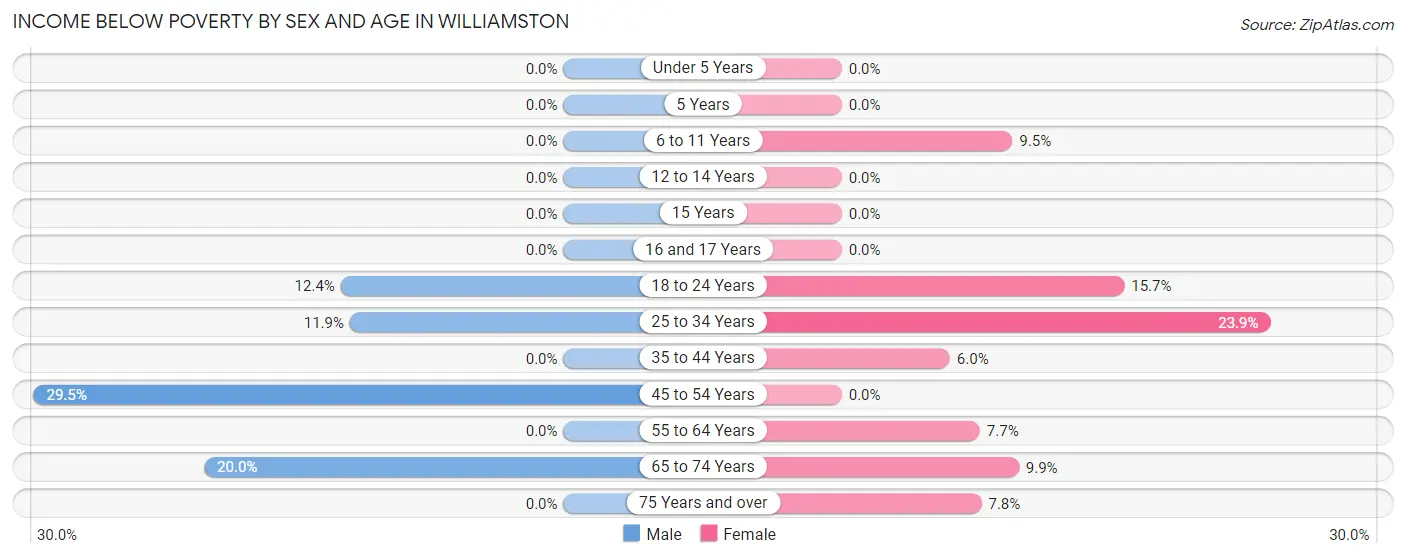
| Age Bracket | Male | Female |
| Under 5 Years | 0 (0.0%) | 0 (0.0%) |
| 5 Years | 0 (0.0%) | 0 (0.0%) |
| 6 to 11 Years | 0 (0.0%) | 17 (9.5%) |
| 12 to 14 Years | 0 (0.0%) | 0 (0.0%) |
| 15 Years | 0 (0.0%) | 0 (0.0%) |
| 16 and 17 Years | 0 (0.0%) | 0 (0.0%) |
| 18 to 24 Years | 15 (12.4%) | 28 (15.7%) |
| 25 to 34 Years | 27 (11.9%) | 47 (23.9%) |
| 35 to 44 Years | 0 (0.0%) | 16 (6.0%) |
| 45 to 54 Years | 59 (29.5%) | 0 (0.0%) |
| 55 to 64 Years | 0 (0.0%) | 18 (7.7%) |
| 65 to 74 Years | 15 (20.0%) | 21 (9.9%) |
| 75 Years and over | 0 (0.0%) | 13 (7.8%) |
| Total | 116 (6.7%) | 160 (7.7%) |
Income Above Poverty by Sex and Age in Williamston
According to the poverty statistics in Williamston, males aged under 5 years and females aged under 5 years are the age groups that are most secure financially, with 100.0% of males and 100.0% of females in these age groups living above the poverty line.
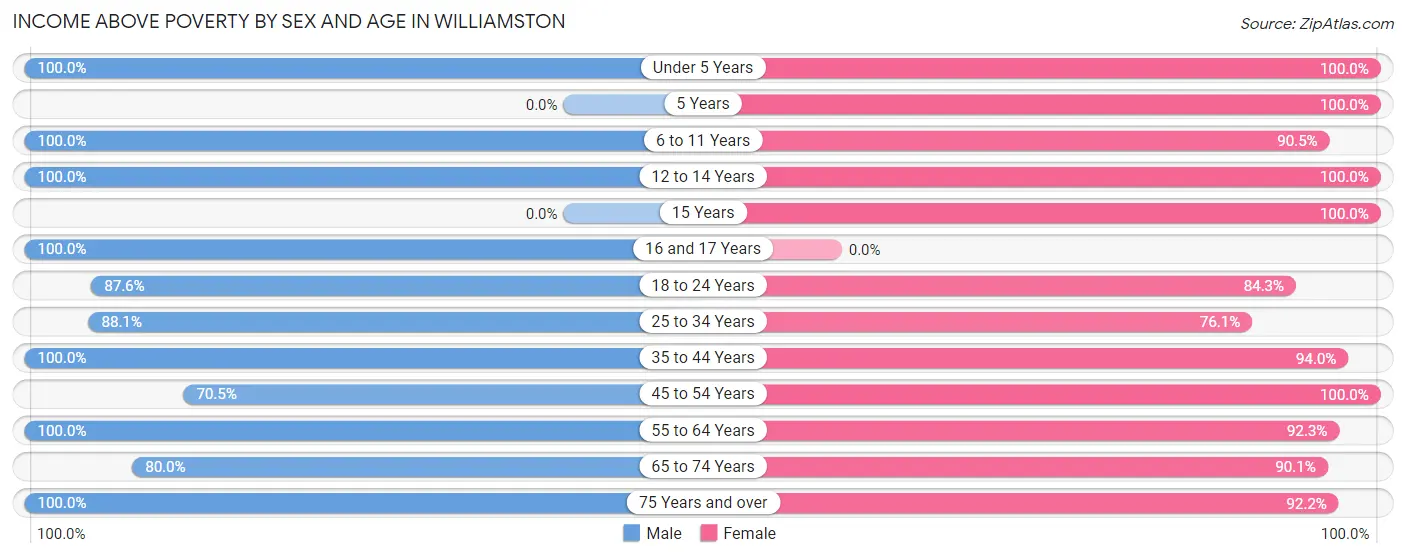
| Age Bracket | Male | Female |
| Under 5 Years | 96 (100.0%) | 272 (100.0%) |
| 5 Years | 0 (0.0%) | 16 (100.0%) |
| 6 to 11 Years | 136 (100.0%) | 162 (90.5%) |
| 12 to 14 Years | 147 (100.0%) | 20 (100.0%) |
| 15 Years | 0 (0.0%) | 17 (100.0%) |
| 16 and 17 Years | 58 (100.0%) | 0 (0.0%) |
| 18 to 24 Years | 106 (87.6%) | 150 (84.3%) |
| 25 to 34 Years | 200 (88.1%) | 150 (76.1%) |
| 35 to 44 Years | 216 (100.0%) | 250 (94.0%) |
| 45 to 54 Years | 141 (70.5%) | 312 (100.0%) |
| 55 to 64 Years | 303 (100.0%) | 216 (92.3%) |
| 65 to 74 Years | 60 (80.0%) | 192 (90.1%) |
| 75 Years and over | 159 (100.0%) | 154 (92.2%) |
| Total | 1,622 (93.3%) | 1,911 (92.3%) |
Income Below Poverty Among Married-Couple Families in Williamston
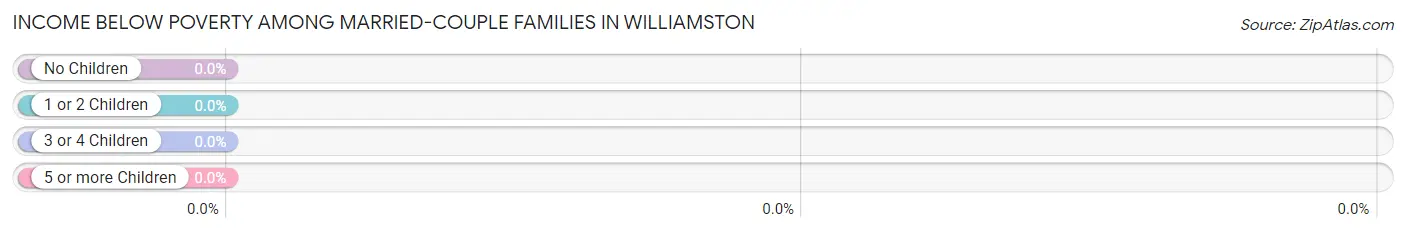
| Children | Above Poverty | Below Poverty |
| No Children | 464 (100.0%) | 0 (0.0%) |
| 1 or 2 Children | 168 (100.0%) | 0 (0.0%) |
| 3 or 4 Children | 139 (100.0%) | 0 (0.0%) |
| 5 or more Children | 0 (0.0%) | 0 (0.0%) |
| Total | 771 (100.0%) | 0 (0.0%) |
Income Below Poverty Among Single-Parent Households in Williamston
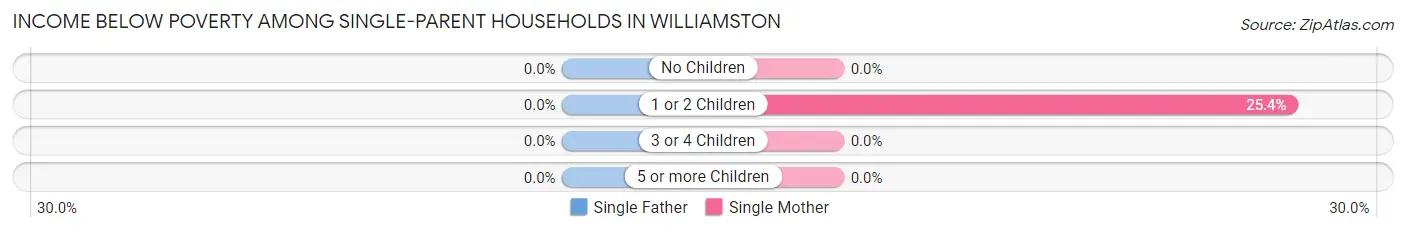
| Children | Single Father | Single Mother |
| No Children | 0 (0.0%) | 0 (0.0%) |
| 1 or 2 Children | 0 (0.0%) | 16 (25.4%) |
| 3 or 4 Children | 0 (0.0%) | 0 (0.0%) |
| 5 or more Children | 0 (0.0%) | 0 (0.0%) |
| Total | 0 (0.0%) | 16 (9.3%) |
Income Below Poverty Among Married-Couple vs Single-Parent Households in Williamston
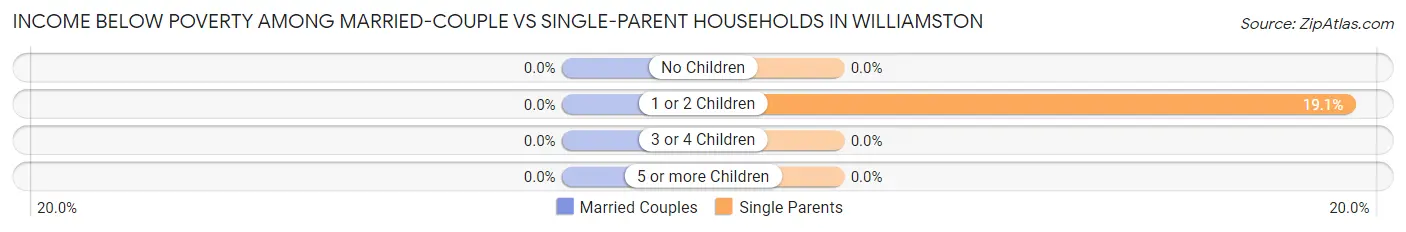
| Children | Married-Couple Families | Single-Parent Households |
| No Children | 0 (0.0%) | 0 (0.0%) |
| 1 or 2 Children | 0 (0.0%) | 16 (19.1%) |
| 3 or 4 Children | 0 (0.0%) | 0 (0.0%) |
| 5 or more Children | 0 (0.0%) | 0 (0.0%) |
| Total | 0 (0.0%) | 16 (7.6%) |
Race in Williamston
The most populous races in Williamston are White / Caucasian (3,734 | 98.0%), Two or more Races (75 | 2.0%), and Hispanic or Latino (39 | 1.0%).
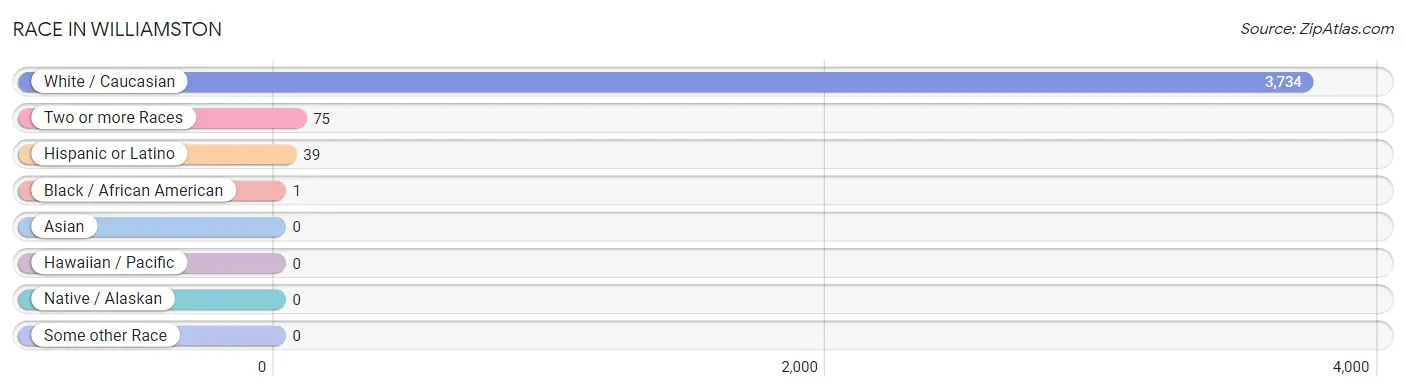
| Race | # Population | % Population |
| Asian | 0 | 0.0% |
| Black / African American | 1 | 0.0% |
| Hawaiian / Pacific | 0 | 0.0% |
| Hispanic or Latino | 39 | 1.0% |
| Native / Alaskan | 0 | 0.0% |
| White / Caucasian | 3,734 | 98.0% |
| Two or more Races | 75 | 2.0% |
| Some other Race | 0 | 0.0% |
| Total | 3,810 | 100.0% |
Ancestry in Williamston
The most populous ancestries reported in Williamston are German (846 | 22.2%), Irish (573 | 15.0%), European (562 | 14.7%), English (337 | 8.8%), and Italian (298 | 7.8%), together accounting for 68.7% of all Williamston residents.
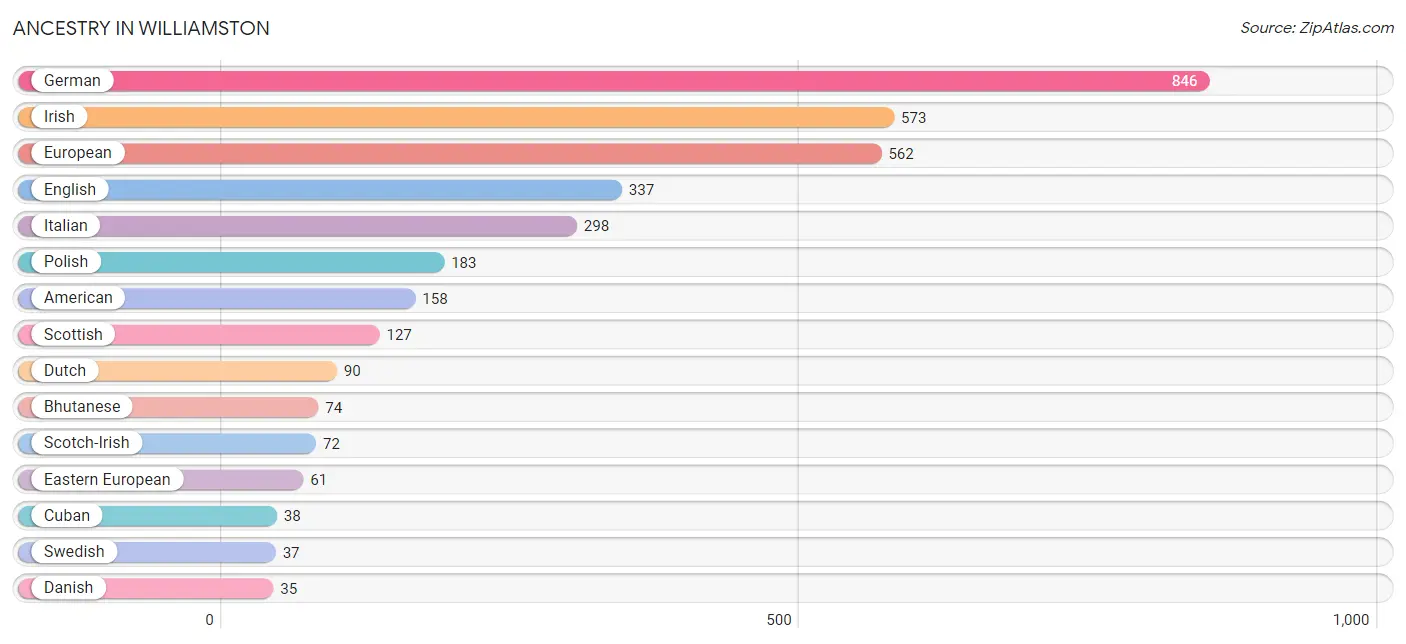
| Ancestry | # Population | % Population |
| American | 158 | 4.2% |
| Bhutanese | 74 | 1.9% |
| Cuban | 38 | 1.0% |
| Czech | 11 | 0.3% |
| Czechoslovakian | 12 | 0.3% |
| Danish | 35 | 0.9% |
| Dutch | 90 | 2.4% |
| Eastern European | 61 | 1.6% |
| English | 337 | 8.8% |
| European | 562 | 14.7% |
| Finnish | 29 | 0.8% |
| French | 23 | 0.6% |
| French Canadian | 6 | 0.2% |
| German | 846 | 22.2% |
| Greek | 6 | 0.2% |
| Hungarian | 27 | 0.7% |
| Irish | 573 | 15.0% |
| Italian | 298 | 7.8% |
| Lithuanian | 19 | 0.5% |
| Mexican | 1 | 0.0% |
| Norwegian | 21 | 0.5% |
| Polish | 183 | 4.8% |
| Scotch-Irish | 72 | 1.9% |
| Scottish | 127 | 3.3% |
| Serbian | 26 | 0.7% |
| Swedish | 37 | 1.0% |
| Swiss | 9 | 0.2% | View All 27 Rows |
Immigrants in Williamston

| Immigration Origin | # Population | % Population | View All 0 Rows |
Sex and Age in Williamston
Sex and Age in Williamston
The most populous age groups in Williamston are 10 to 14 Years (264 | 15.2%) for men and Under 5 Years (272 | 13.1%) for women.
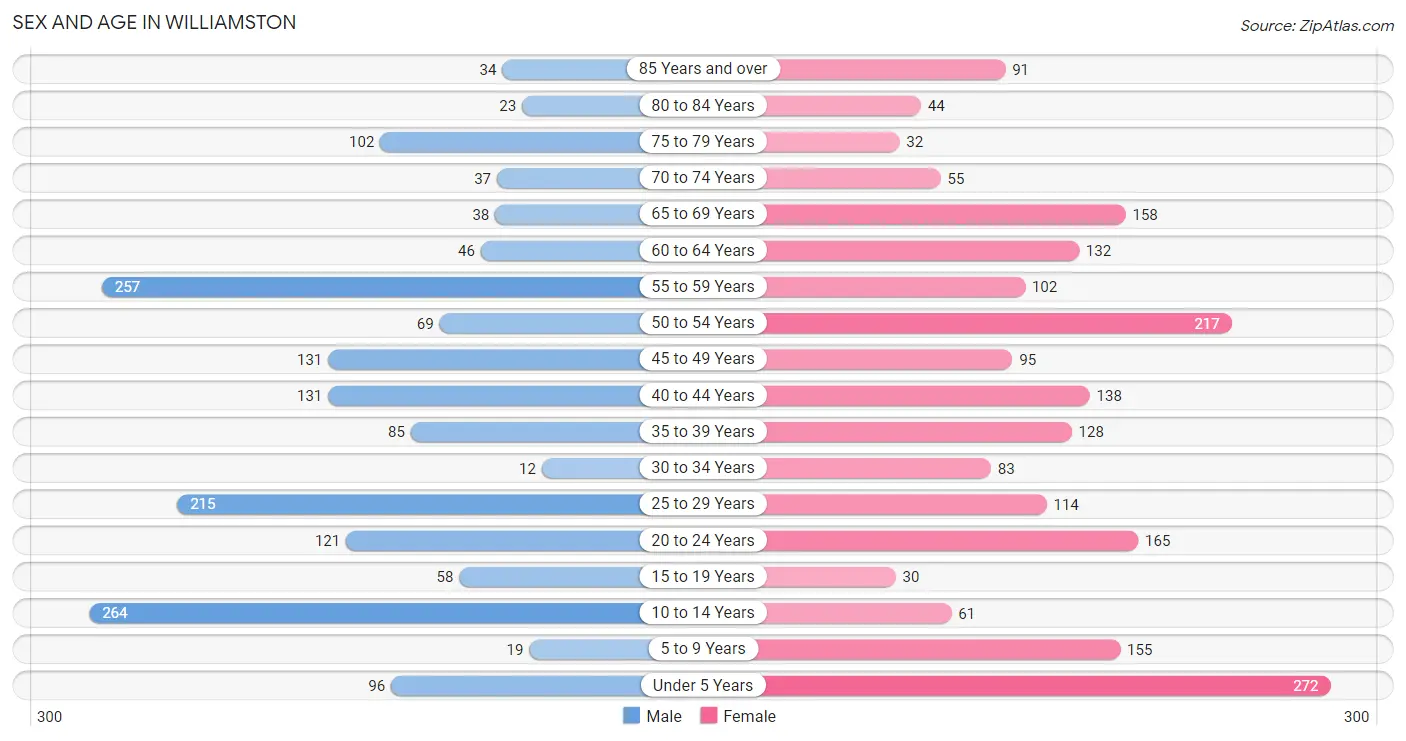
| Age Bracket | Male | Female |
| Under 5 Years | 96 (5.5%) | 272 (13.1%) |
| 5 to 9 Years | 19 (1.1%) | 155 (7.5%) |
| 10 to 14 Years | 264 (15.2%) | 61 (2.9%) |
| 15 to 19 Years | 58 (3.3%) | 30 (1.5%) |
| 20 to 24 Years | 121 (7.0%) | 165 (8.0%) |
| 25 to 29 Years | 215 (12.4%) | 114 (5.5%) |
| 30 to 34 Years | 12 (0.7%) | 83 (4.0%) |
| 35 to 39 Years | 85 (4.9%) | 128 (6.2%) |
| 40 to 44 Years | 131 (7.5%) | 138 (6.7%) |
| 45 to 49 Years | 131 (7.5%) | 95 (4.6%) |
| 50 to 54 Years | 69 (4.0%) | 217 (10.5%) |
| 55 to 59 Years | 257 (14.8%) | 102 (4.9%) |
| 60 to 64 Years | 46 (2.6%) | 132 (6.4%) |
| 65 to 69 Years | 38 (2.2%) | 158 (7.6%) |
| 70 to 74 Years | 37 (2.1%) | 55 (2.6%) |
| 75 to 79 Years | 102 (5.9%) | 32 (1.5%) |
| 80 to 84 Years | 23 (1.3%) | 44 (2.1%) |
| 85 Years and over | 34 (2.0%) | 91 (4.4%) |
| Total | 1,738 (100.0%) | 2,072 (100.0%) |
Families and Households in Williamston
Median Family Size in Williamston
The median family size in Williamston is 2.94 persons per family, with married-couple families (771 | 78.5%) accounting for the largest median family size of 3.13 persons per family. On the other hand, single female/mother families (172 | 17.5%) represent the smallest median family size with 2.20 persons per family.
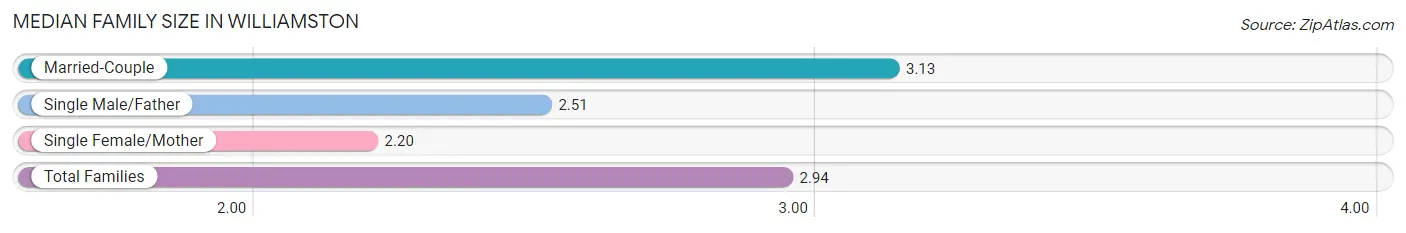
| Family Type | # Families | Family Size |
| Married-Couple | 771 (78.5%) | 3.13 |
| Single Male/Father | 39 (4.0%) | 2.51 |
| Single Female/Mother | 172 (17.5%) | 2.20 |
| Total Families | 982 (100.0%) | 2.94 |
Median Household Size in Williamston
The median household size in Williamston is 2.17 persons per household, with single male/father households (39 | 2.2%) accounting for the largest median household size of 3.51 persons per household. non-family households (771 | 44.0%) represent the smallest median household size with 1.14 persons per household.
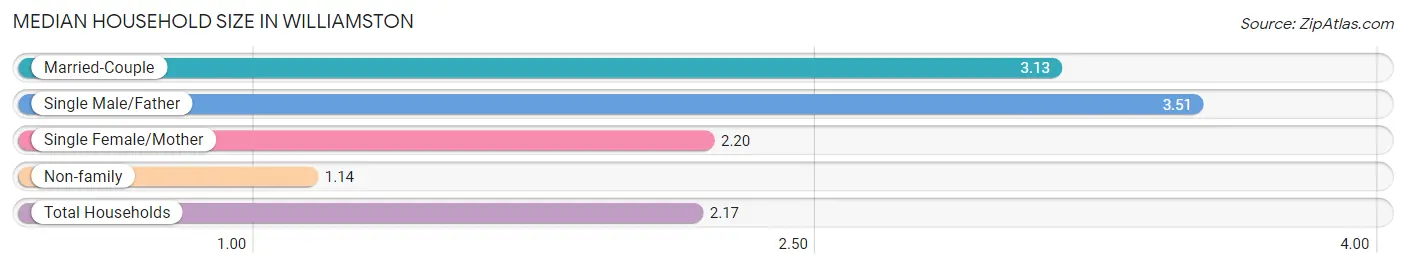
| Household Type | # Households | Household Size |
| Married-Couple | 771 (44.0%) | 3.13 |
| Single Male/Father | 39 (2.2%) | 3.51 |
| Single Female/Mother | 172 (9.8%) | 2.20 |
| Non-family | 771 (44.0%) | 1.14 |
| Total Households | 1,753 (100.0%) | 2.17 |
Household Size by Marriage Status in Williamston
Out of a total of 1,753 households in Williamston, 982 (56.0%) are family households, while 771 (44.0%) are nonfamily households. The most numerous type of family households are 2-person households, comprising 630, and the most common type of nonfamily households are 1-person households, comprising 672.
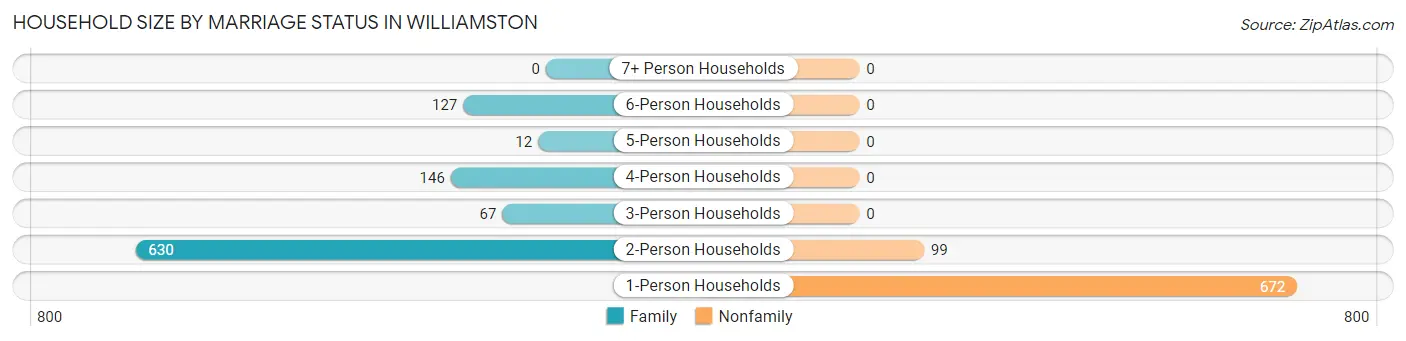
| Household Size | Family Households | Nonfamily Households |
| 1-Person Households | - | 672 (38.3%) |
| 2-Person Households | 630 (35.9%) | 99 (5.7%) |
| 3-Person Households | 67 (3.8%) | 0 (0.0%) |
| 4-Person Households | 146 (8.3%) | 0 (0.0%) |
| 5-Person Households | 12 (0.7%) | 0 (0.0%) |
| 6-Person Households | 127 (7.2%) | 0 (0.0%) |
| 7+ Person Households | 0 (0.0%) | 0 (0.0%) |
| Total | 982 (56.0%) | 771 (44.0%) |
Female Fertility in Williamston
Fertility by Age in Williamston
Average fertility rate in Williamston is 96.0 births per 1,000 women. Women in the age bracket of 20 to 34 years have the highest fertility rate with 199.0 births per 1,000 women. Women in the age bracket of 20 to 34 years acount for 100.0% of all women with births.
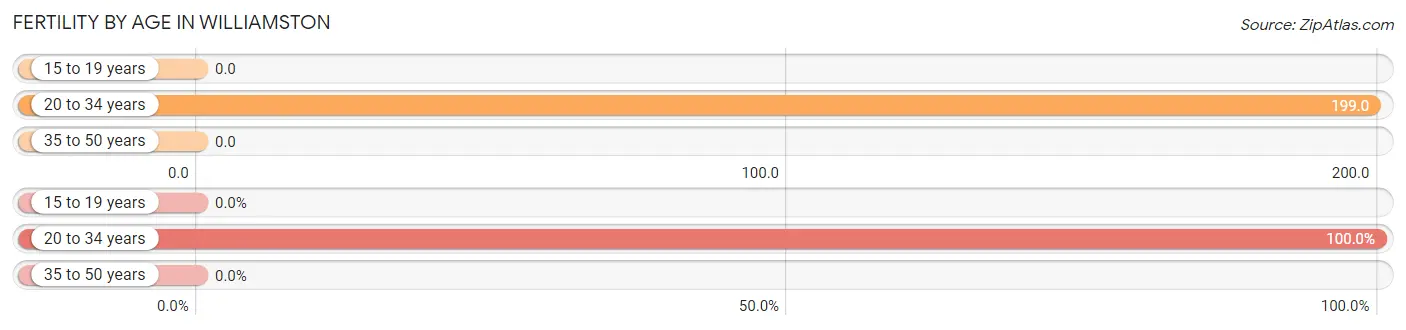
| Age Bracket | Women with Births | Births / 1,000 Women |
| 15 to 19 years | 0 (0.0%) | 0.0 |
| 20 to 34 years | 72 (100.0%) | 199.0 |
| 35 to 50 years | 0 (0.0%) | 0.0 |
| Total | 72 (100.0%) | 96.0 |
Fertility by Age by Marriage Status in Williamston
73.6% of women with births (72) in Williamston are married. The highest percentage of unmarried women with births falls into 20 to 34 years age bracket with 26.4% of them unmarried at the time of birth, while the lowest percentage of unmarried women with births belong to 20 to 34 years age bracket with 26.4% of them unmarried.
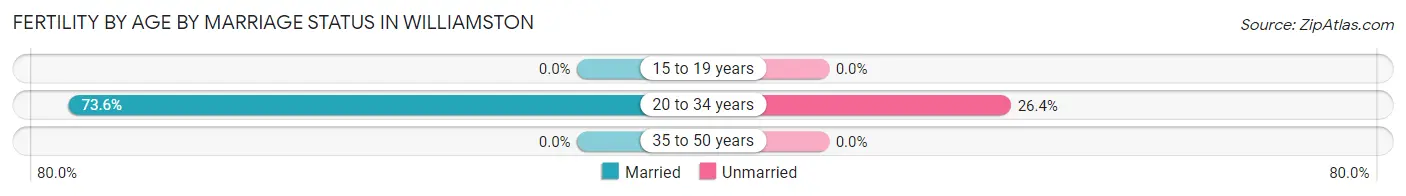
| Age Bracket | Married | Unmarried |
| 15 to 19 years | 0 (0.0%) | 0 (0.0%) |
| 20 to 34 years | 53 (73.6%) | 19 (26.4%) |
| 35 to 50 years | 0 (0.0%) | 0 (0.0%) |
| Total | 53 (73.6%) | 19 (26.4%) |
Fertility by Education in Williamston
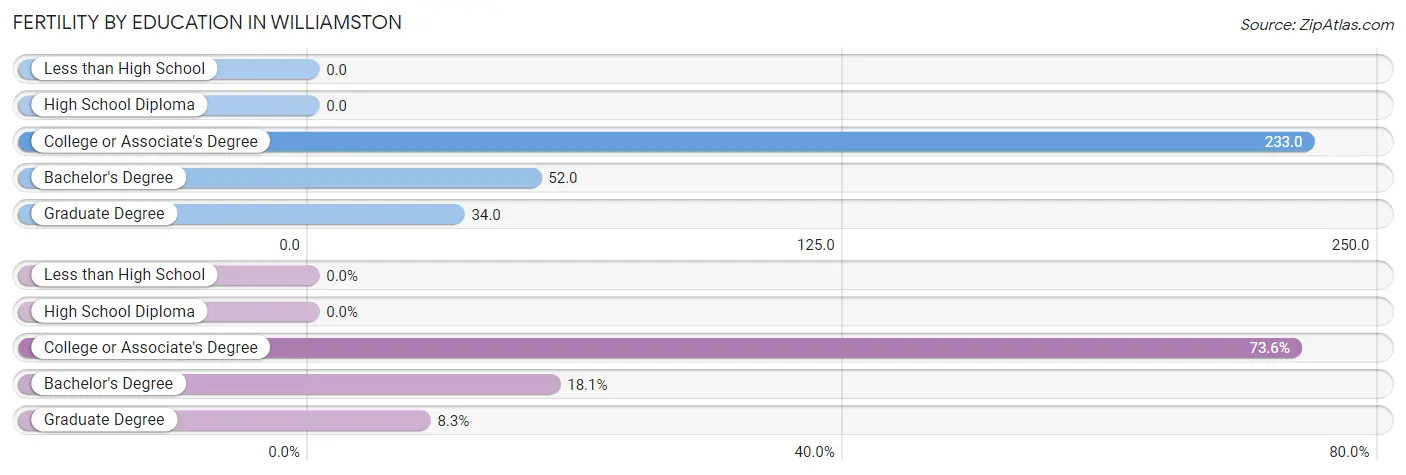
| Educational Attainment | Women with Births | Births / 1,000 Women |
| Less than High School | 0 (0.0%) | 0.0 |
| High School Diploma | 0 (0.0%) | 0.0 |
| College or Associate's Degree | 53 (73.6%) | 233.0 |
| Bachelor's Degree | 13 (18.1%) | 52.0 |
| Graduate Degree | 6 (8.3%) | 34.0 |
| Total | 72 (100.0%) | 96.0 |
Fertility by Education by Marriage Status in Williamston
26.4% of women with births in Williamston are unmarried. Women with the educational attainment of college or associate's degree are most likely to be married with 100.0% of them married at childbirth, while women with the educational attainment of bachelor's degree are least likely to be married with 100.0% of them unmarried at childbirth.
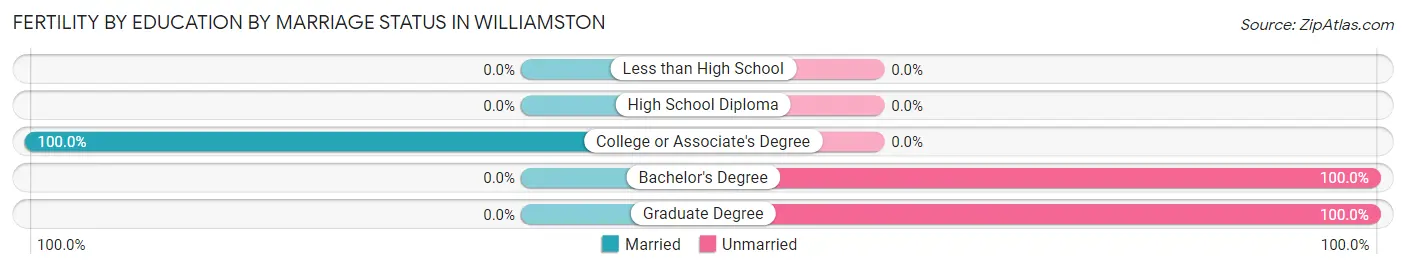
| Educational Attainment | Married | Unmarried |
| Less than High School | 0 (0.0%) | 0 (0.0%) |
| High School Diploma | 0 (0.0%) | 0 (0.0%) |
| College or Associate's Degree | 53 (100.0%) | 0 (0.0%) |
| Bachelor's Degree | 0 (0.0%) | 13 (100.0%) |
| Graduate Degree | 0 (0.0%) | 6 (100.0%) |
| Total | 53 (73.6%) | 19 (26.4%) |
Employment Characteristics in Williamston
Employment by Class of Employer in Williamston
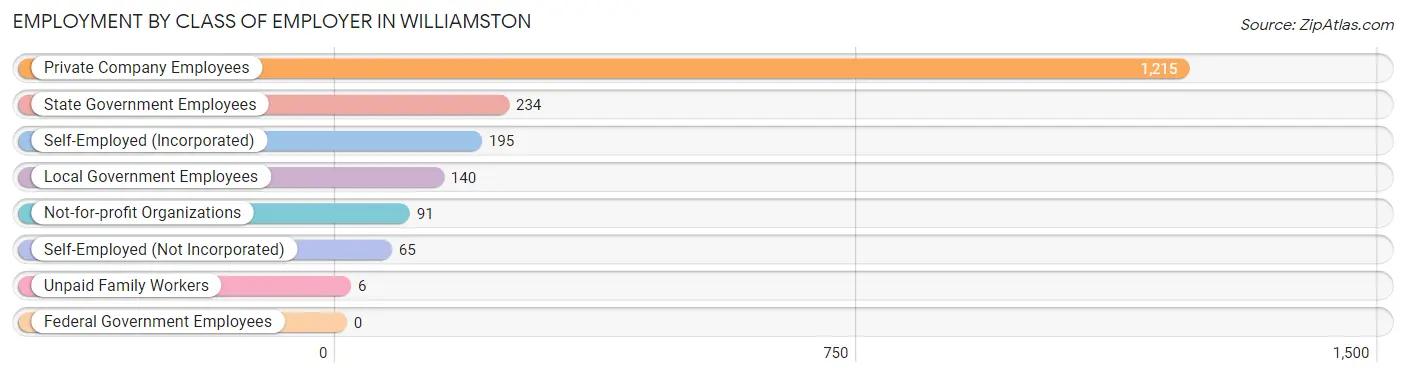
Among the 1,946 employed individuals in Williamston, private company employees (1,215 | 62.4%), state government employees (234 | 12.0%), and self-employed (incorporated) (195 | 10.0%) make up the most common classes of employment.
| Employer Class | # Employees | % Employees |
| Private Company Employees | 1,215 | 62.4% |
| Self-Employed (Incorporated) | 195 | 10.0% |
| Self-Employed (Not Incorporated) | 65 | 3.3% |
| Not-for-profit Organizations | 91 | 4.7% |
| Local Government Employees | 140 | 7.2% |
| State Government Employees | 234 | 12.0% |
| Federal Government Employees | 0 | 0.0% |
| Unpaid Family Workers | 6 | 0.3% |
| Total | 1,946 | 100.0% |
Employment Status by Age in Williamston
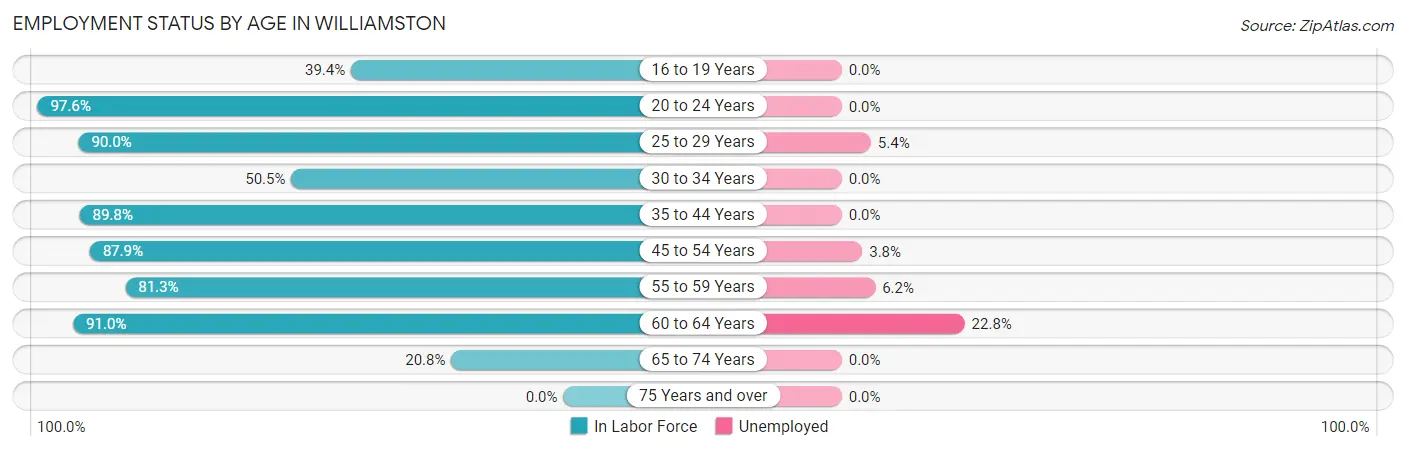
According to the labor force statistics for Williamston, out of the total population over 16 years of age (2,926), 70.0% or 2,048 individuals are in the labor force, with 4.3% or 88 of them unemployed. The age group with the highest labor force participation rate is 20 to 24 years, with 97.6% or 279 individuals in the labor force. Within the labor force, the 60 to 64 years age range has the highest percentage of unemployed individuals, with 22.8% or 37 of them being unemployed.
| Age Bracket | In Labor Force | Unemployed |
| 16 to 19 Years | 28 (39.4%) | 0 (0.0%) |
| 20 to 24 Years | 279 (97.6%) | 0 (0.0%) |
| 25 to 29 Years | 296 (90.0%) | 16 (5.4%) |
| 30 to 34 Years | 48 (50.5%) | 0 (0.0%) |
| 35 to 44 Years | 433 (89.8%) | 0 (0.0%) |
| 45 to 54 Years | 450 (87.9%) | 17 (3.8%) |
| 55 to 59 Years | 292 (81.3%) | 18 (6.2%) |
| 60 to 64 Years | 162 (91.0%) | 37 (22.8%) |
| 65 to 74 Years | 60 (20.8%) | 0 (0.0%) |
| 75 Years and over | 0 (0.0%) | 0 (0.0%) |
| Total | 2,048 (70.0%) | 88 (4.3%) |
Employment Status by Educational Attainment in Williamston
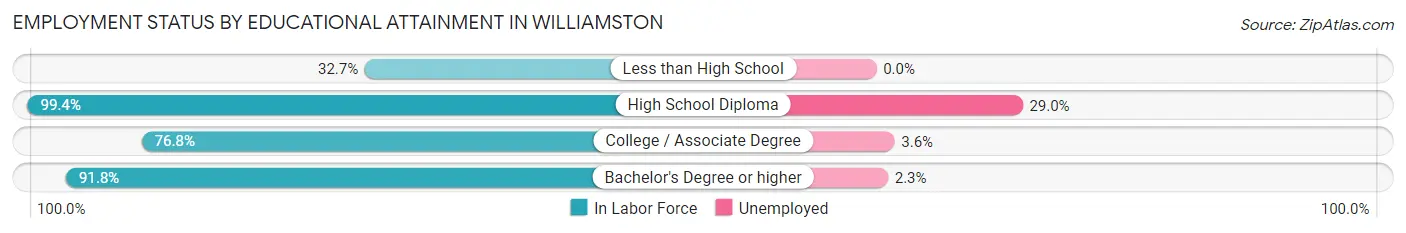
According to labor force statistics for Williamston, 86.0% of individuals (1,681) out of the total population between 25 and 64 years of age (1,955) are in the labor force, with 5.2% or 87 of them being unemployed. The group with the highest labor force participation rate are those with the educational attainment of high school diploma, with 99.4% or 162 individuals in the labor force. Within the labor force, individuals with high school diploma education have the highest percentage of unemployment, with 29.0% or 47 of them being unemployed.
| Educational Attainment | In Labor Force | Unemployed |
| Less than High School | 16 (32.7%) | 0 (0.0%) |
| High School Diploma | 162 (99.4%) | 47 (29.0%) |
| College / Associate Degree | 497 (76.8%) | 23 (3.6%) |
| Bachelor's Degree or higher | 1,006 (91.8%) | 25 (2.3%) |
| Total | 1,681 (86.0%) | 102 (5.2%) |
Employment Occupations by Sex in Williamston
Management, Business, Science and Arts Occupations
The most common Management, Business, Science and Arts occupations in Williamston are Health Diagnosing & Treating (283 | 14.4%), Community & Social Service (268 | 13.7%), Management (260 | 13.3%), Health Technologists (243 | 12.4%), and Education Instruction & Library (155 | 7.9%).

Management, Business, Science and Arts Occupations by Sex
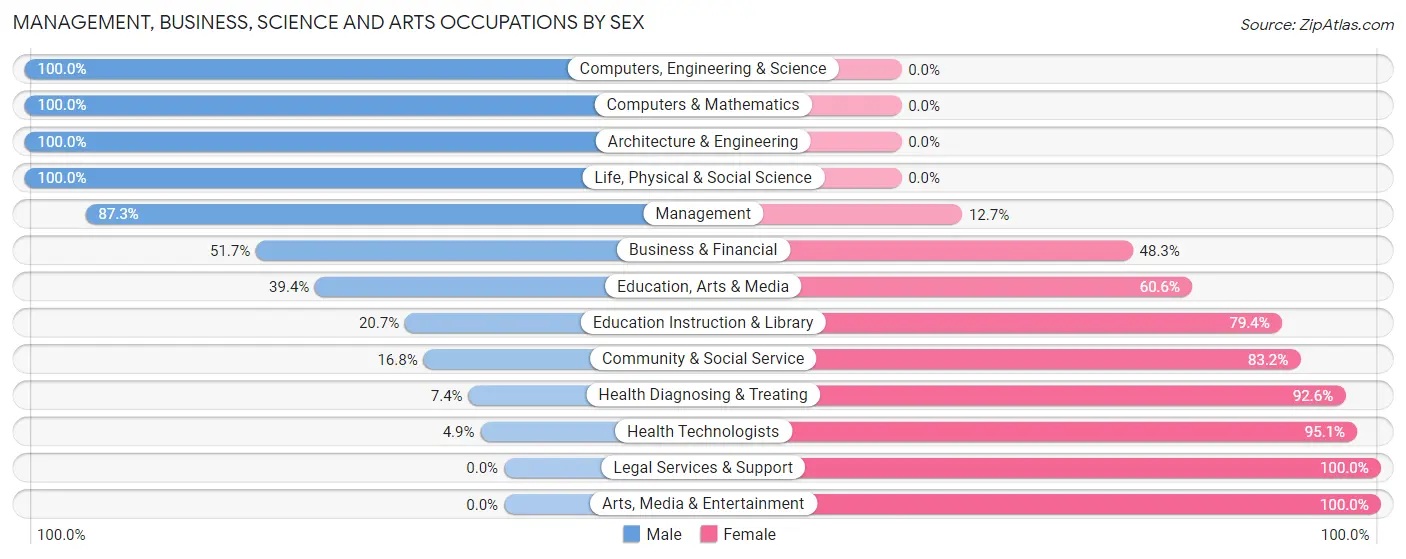
Within the Management, Business, Science and Arts occupations in Williamston, the most male-oriented occupations are Computers, Engineering & Science (100.0%), Computers & Mathematics (100.0%), and Architecture & Engineering (100.0%), while the most female-oriented occupations are Legal Services & Support (100.0%), Arts, Media & Entertainment (100.0%), and Health Technologists (95.1%).
| Occupation | Male | Female |
| Management | 227 (87.3%) | 33 (12.7%) |
| Business & Financial | 30 (51.7%) | 28 (48.3%) |
| Computers, Engineering & Science | 140 (100.0%) | 0 (0.0%) |
| Computers & Mathematics | 34 (100.0%) | 0 (0.0%) |
| Architecture & Engineering | 15 (100.0%) | 0 (0.0%) |
| Life, Physical & Social Science | 91 (100.0%) | 0 (0.0%) |
| Community & Social Service | 45 (16.8%) | 223 (83.2%) |
| Education, Arts & Media | 13 (39.4%) | 20 (60.6%) |
| Legal Services & Support | 0 (0.0%) | 14 (100.0%) |
| Education Instruction & Library | 32 (20.6%) | 123 (79.3%) |
| Arts, Media & Entertainment | 0 (0.0%) | 66 (100.0%) |
| Health Diagnosing & Treating | 21 (7.4%) | 262 (92.6%) |
| Health Technologists | 12 (4.9%) | 231 (95.1%) |
| Total (Category) | 463 (45.9%) | 546 (54.1%) |
| Total (Overall) | 995 (50.8%) | 965 (49.2%) |
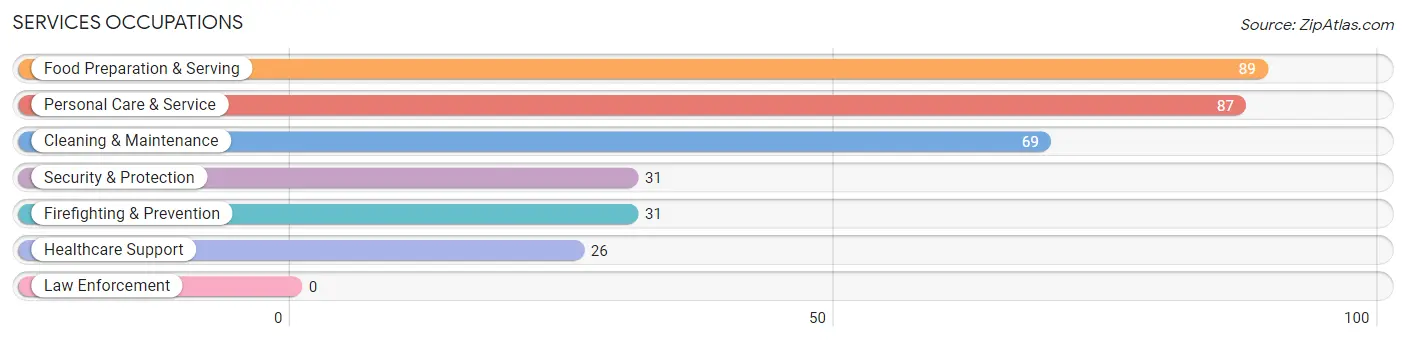
Services Occupations
The most common Services occupations in Williamston are Food Preparation & Serving (89 | 4.5%), Personal Care & Service (87 | 4.4%), Cleaning & Maintenance (69 | 3.5%), Security & Protection (31 | 1.6%), and Firefighting & Prevention (31 | 1.6%).
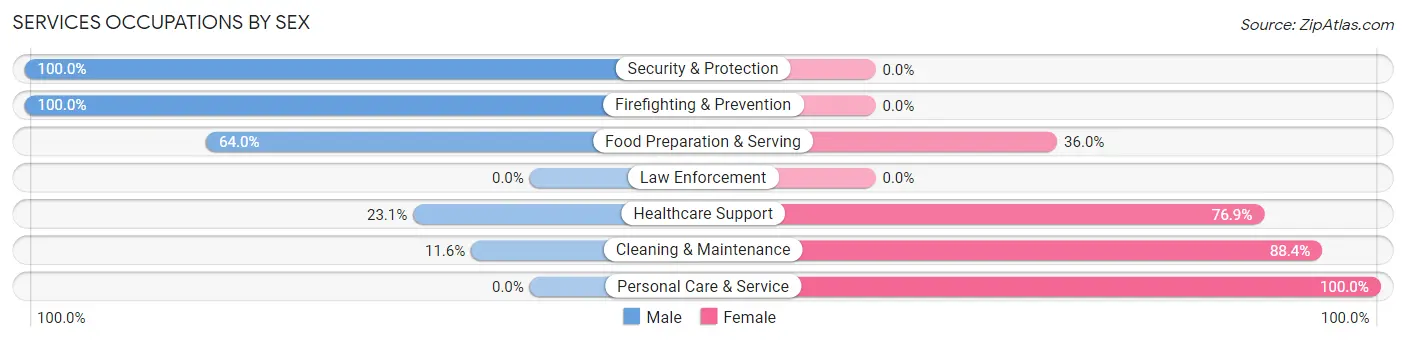
Services Occupations by Sex
Within the Services occupations in Williamston, the most male-oriented occupations are Security & Protection (100.0%), Firefighting & Prevention (100.0%), and Food Preparation & Serving (64.0%), while the most female-oriented occupations are Personal Care & Service (100.0%), Cleaning & Maintenance (88.4%), and Healthcare Support (76.9%).
| Occupation | Male | Female |
| Healthcare Support | 6 (23.1%) | 20 (76.9%) |
| Security & Protection | 31 (100.0%) | 0 (0.0%) |
| Firefighting & Prevention | 31 (100.0%) | 0 (0.0%) |
| Law Enforcement | 0 (0.0%) | 0 (0.0%) |
| Food Preparation & Serving | 57 (64.0%) | 32 (36.0%) |
| Cleaning & Maintenance | 8 (11.6%) | 61 (88.4%) |
| Personal Care & Service | 0 (0.0%) | 87 (100.0%) |
| Total (Category) | 102 (33.8%) | 200 (66.2%) |
| Total (Overall) | 995 (50.8%) | 965 (49.2%) |
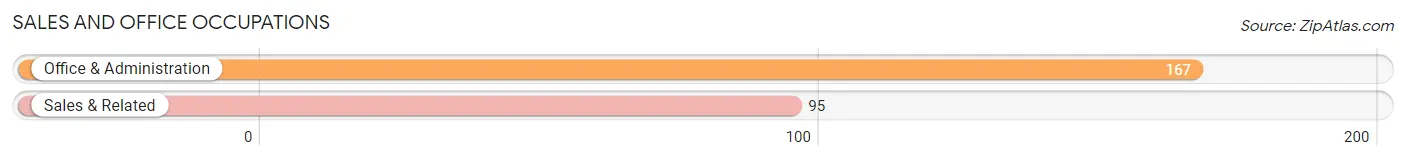
Sales and Office Occupations
The most common Sales and Office occupations in Williamston are Office & Administration (167 | 8.5%), and Sales & Related (95 | 4.9%).
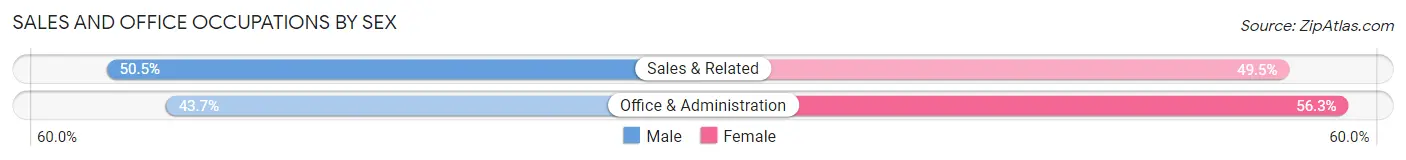
Sales and Office Occupations by Sex
| Occupation | Male | Female |
| Sales & Related | 48 (50.5%) | 47 (49.5%) |
| Office & Administration | 73 (43.7%) | 94 (56.3%) |
| Total (Category) | 121 (46.2%) | 141 (53.8%) |
| Total (Overall) | 995 (50.8%) | 965 (49.2%) |
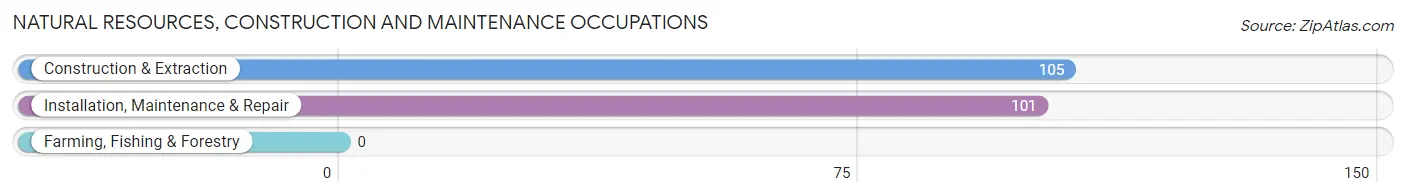
Natural Resources, Construction and Maintenance Occupations
The most common Natural Resources, Construction and Maintenance occupations in Williamston are Construction & Extraction (105 | 5.4%), and Installation, Maintenance & Repair (101 | 5.1%).
Natural Resources, Construction and Maintenance Occupations by Sex
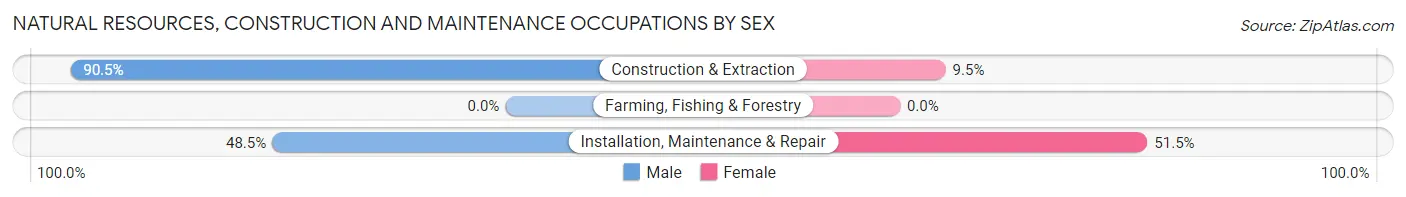
| Occupation | Male | Female |
| Farming, Fishing & Forestry | 0 (0.0%) | 0 (0.0%) |
| Construction & Extraction | 95 (90.5%) | 10 (9.5%) |
| Installation, Maintenance & Repair | 49 (48.5%) | 52 (51.5%) |
| Total (Category) | 144 (69.9%) | 62 (30.1%) |
| Total (Overall) | 995 (50.8%) | 965 (49.2%) |
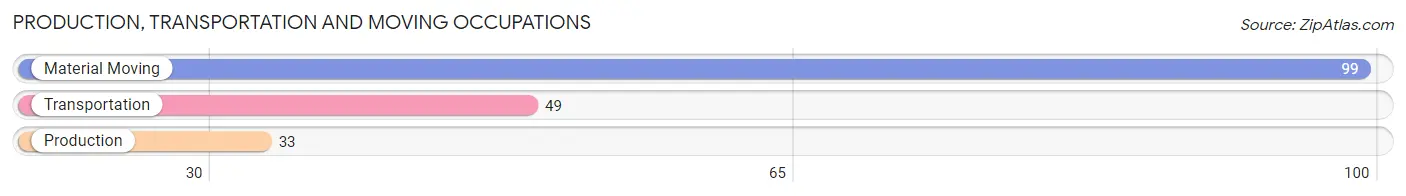
Production, Transportation and Moving Occupations
The most common Production, Transportation and Moving occupations in Williamston are Material Moving (99 | 5.1%), Transportation (49 | 2.5%), and Production (33 | 1.7%).
Production, Transportation and Moving Occupations by Sex
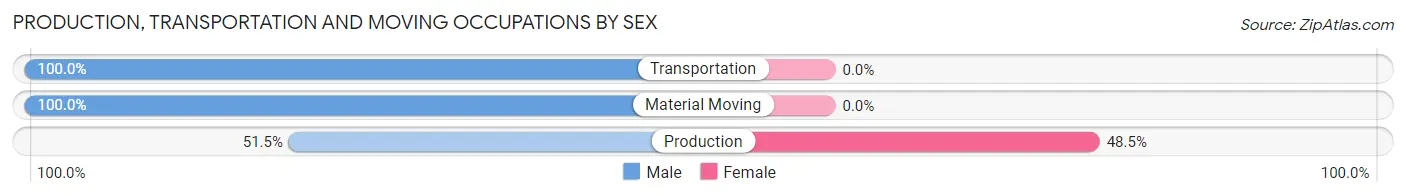
| Occupation | Male | Female |
| Production | 17 (51.5%) | 16 (48.5%) |
| Transportation | 49 (100.0%) | 0 (0.0%) |
| Material Moving | 99 (100.0%) | 0 (0.0%) |
| Total (Category) | 165 (91.2%) | 16 (8.8%) |
| Total (Overall) | 995 (50.8%) | 965 (49.2%) |
Employment Industries by Sex in Williamston
Employment Industries in Williamston
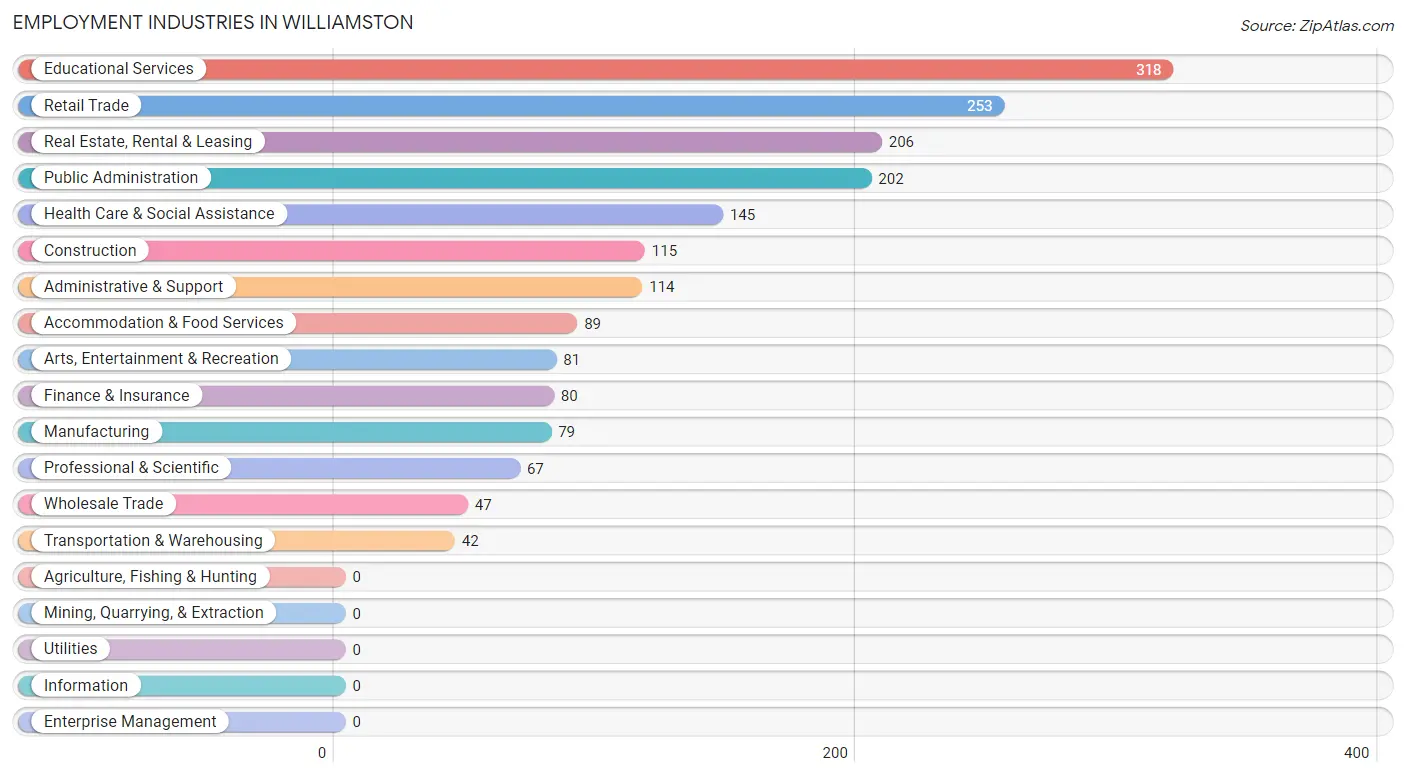
The major employment industries in Williamston include Educational Services (318 | 16.2%), Retail Trade (253 | 12.9%), Real Estate, Rental & Leasing (206 | 10.5%), Public Administration (202 | 10.3%), and Health Care & Social Assistance (145 | 7.4%).
Employment Industries by Sex in Williamston
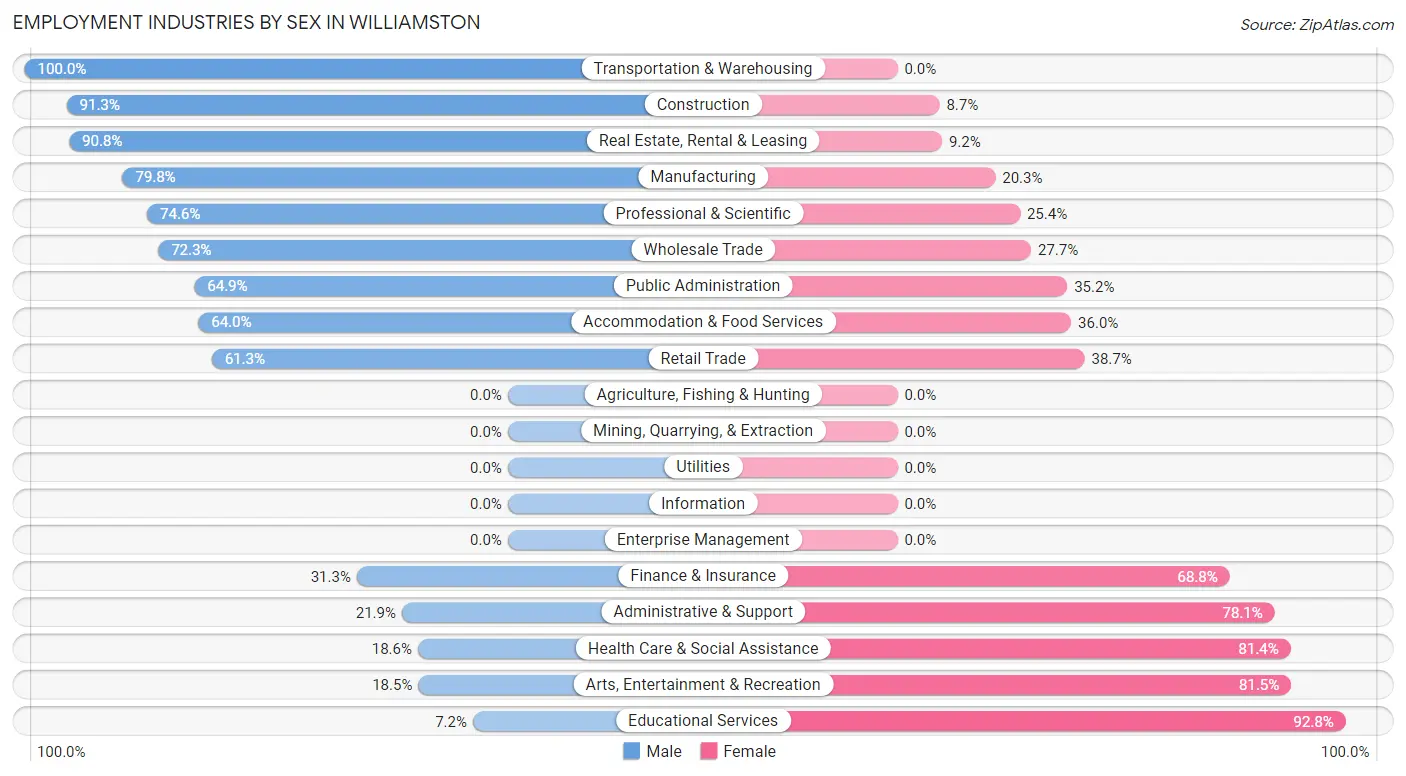
The Williamston industries that see more men than women are Transportation & Warehousing (100.0%), Construction (91.3%), and Real Estate, Rental & Leasing (90.8%), whereas the industries that tend to have a higher number of women are Educational Services (92.8%), Arts, Entertainment & Recreation (81.5%), and Health Care & Social Assistance (81.4%).
| Industry | Male | Female |
| Agriculture, Fishing & Hunting | 0 (0.0%) | 0 (0.0%) |
| Mining, Quarrying, & Extraction | 0 (0.0%) | 0 (0.0%) |
| Construction | 105 (91.3%) | 10 (8.7%) |
| Manufacturing | 63 (79.7%) | 16 (20.3%) |
| Wholesale Trade | 34 (72.3%) | 13 (27.7%) |
| Retail Trade | 155 (61.3%) | 98 (38.7%) |
| Transportation & Warehousing | 42 (100.0%) | 0 (0.0%) |
| Utilities | 0 (0.0%) | 0 (0.0%) |
| Information | 0 (0.0%) | 0 (0.0%) |
| Finance & Insurance | 25 (31.2%) | 55 (68.8%) |
| Real Estate, Rental & Leasing | 187 (90.8%) | 19 (9.2%) |
| Professional & Scientific | 50 (74.6%) | 17 (25.4%) |
| Enterprise Management | 0 (0.0%) | 0 (0.0%) |
| Administrative & Support | 25 (21.9%) | 89 (78.1%) |
| Educational Services | 23 (7.2%) | 295 (92.8%) |
| Health Care & Social Assistance | 27 (18.6%) | 118 (81.4%) |
| Arts, Entertainment & Recreation | 15 (18.5%) | 66 (81.5%) |
| Accommodation & Food Services | 57 (64.0%) | 32 (36.0%) |
| Public Administration | 131 (64.8%) | 71 (35.1%) |
| Total | 995 (50.8%) | 965 (49.2%) |
Education in Williamston
School Enrollment in Williamston
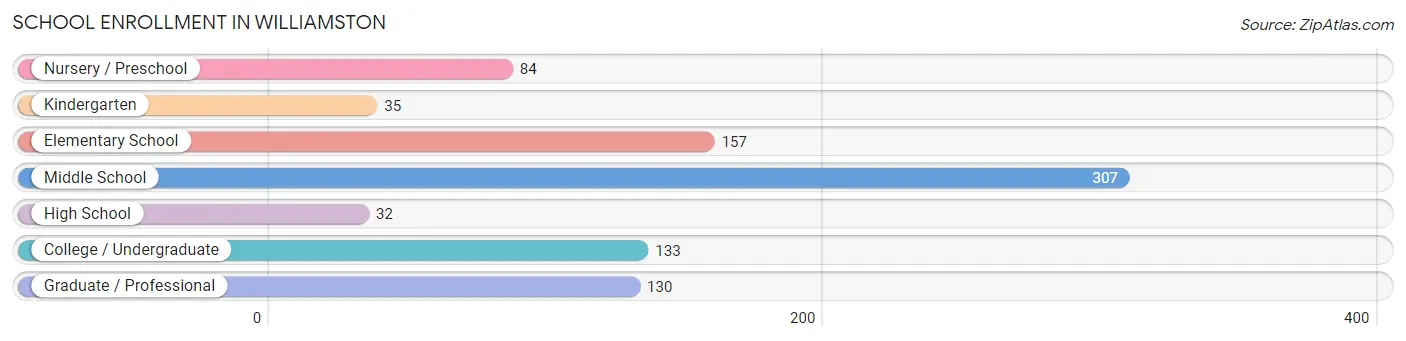
The most common levels of schooling among the 878 students in Williamston are middle school (307 | 35.0%), elementary school (157 | 17.9%), and college / undergraduate (133 | 15.1%).
| School Level | # Students | % Students |
| Nursery / Preschool | 84 | 9.6% |
| Kindergarten | 35 | 4.0% |
| Elementary School | 157 | 17.9% |
| Middle School | 307 | 35.0% |
| High School | 32 | 3.6% |
| College / Undergraduate | 133 | 15.1% |
| Graduate / Professional | 130 | 14.8% |
| Total | 878 | 100.0% |
School Enrollment by Age by Funding Source in Williamston
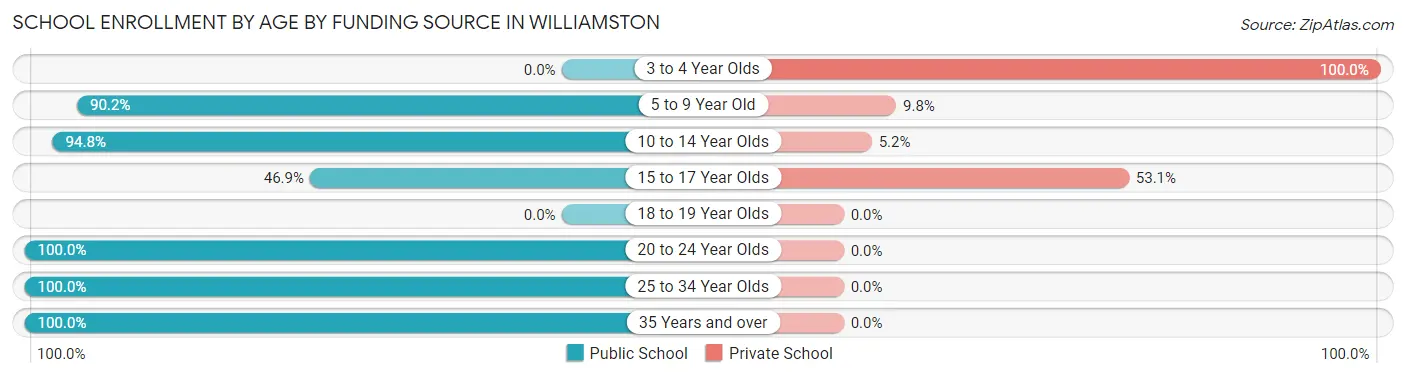
Out of a total of 878 students who are enrolled in schools in Williamston, 135 (15.4%) attend a private institution, while the remaining 743 (84.6%) are enrolled in public schools. The age group of 3 to 4 year olds has the highest likelihood of being enrolled in private schools, with 84 (100.0% in the age bracket) enrolled. Conversely, the age group of 20 to 24 year olds has the lowest likelihood of being enrolled in a private school, with 67 (100.0% in the age bracket) attending a public institution.
| Age Bracket | Public School | Private School |
| 3 to 4 Year Olds | 0 (0.0%) | 84 (100.0%) |
| 5 to 9 Year Old | 157 (90.2%) | 17 (9.8%) |
| 10 to 14 Year Olds | 308 (94.8%) | 17 (5.2%) |
| 15 to 17 Year Olds | 15 (46.9%) | 17 (53.1%) |
| 18 to 19 Year Olds | 0 (0.0%) | 0 (0.0%) |
| 20 to 24 Year Olds | 67 (100.0%) | 0 (0.0%) |
| 25 to 34 Year Olds | 57 (100.0%) | 0 (0.0%) |
| 35 Years and over | 139 (100.0%) | 0 (0.0%) |
| Total | 743 (84.6%) | 135 (15.4%) |
Educational Attainment by Field of Study in Williamston
Business (358 | 23.0%), bio, nature & agricultural (320 | 20.5%), physical & health sciences (238 | 15.3%), education (220 | 14.1%), and arts & humanities (153 | 9.8%) are the most common fields of study among 1,559 individuals in Williamston who have obtained a bachelor's degree or higher.
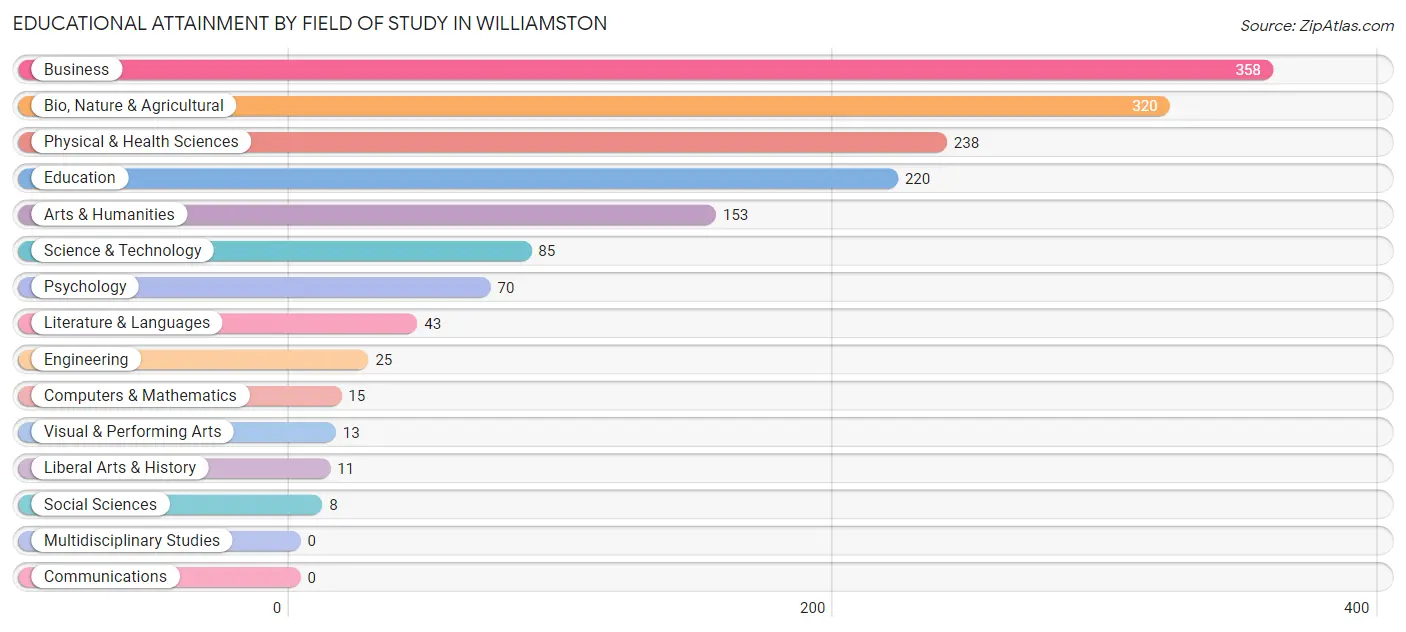
| Field of Study | # Graduates | % Graduates |
| Computers & Mathematics | 15 | 1.0% |
| Bio, Nature & Agricultural | 320 | 20.5% |
| Physical & Health Sciences | 238 | 15.3% |
| Psychology | 70 | 4.5% |
| Social Sciences | 8 | 0.5% |
| Engineering | 25 | 1.6% |
| Multidisciplinary Studies | 0 | 0.0% |
| Science & Technology | 85 | 5.4% |
| Business | 358 | 23.0% |
| Education | 220 | 14.1% |
| Literature & Languages | 43 | 2.8% |
| Liberal Arts & History | 11 | 0.7% |
| Visual & Performing Arts | 13 | 0.8% |
| Communications | 0 | 0.0% |
| Arts & Humanities | 153 | 9.8% |
| Total | 1,559 | 100.0% |
Transportation & Commute in Williamston
Vehicle Availability by Sex in Williamston
The most prevalent vehicle ownership categories in Williamston are males with 2 vehicles (631, accounting for 63.5%) and females with 2 vehicles (622, making up 66.3%).
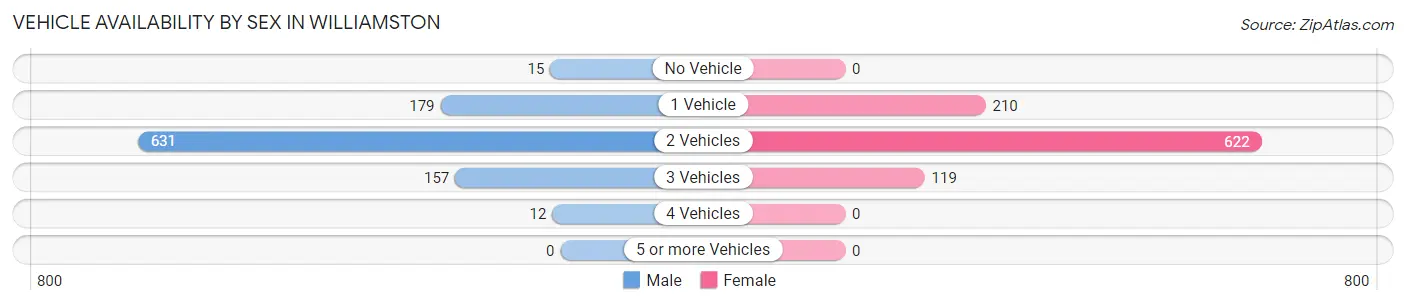
| Vehicles Available | Male | Female |
| No Vehicle | 15 (1.5%) | 0 (0.0%) |
| 1 Vehicle | 179 (18.0%) | 210 (22.1%) |
| 2 Vehicles | 631 (63.5%) | 622 (65.4%) |
| 3 Vehicles | 157 (15.8%) | 119 (12.5%) |
| 4 Vehicles | 12 (1.2%) | 0 (0.0%) |
| 5 or more Vehicles | 0 (0.0%) | 0 (0.0%) |
| Total | 994 (100.0%) | 951 (100.0%) |
Commute Time in Williamston
The most frequently occuring commute durations in Williamston are 25 to 29 minutes (451 commuters, 25.8%), 60 to 89 minutes (290 commuters, 16.6%), and 15 to 19 minutes (263 commuters, 15.1%).
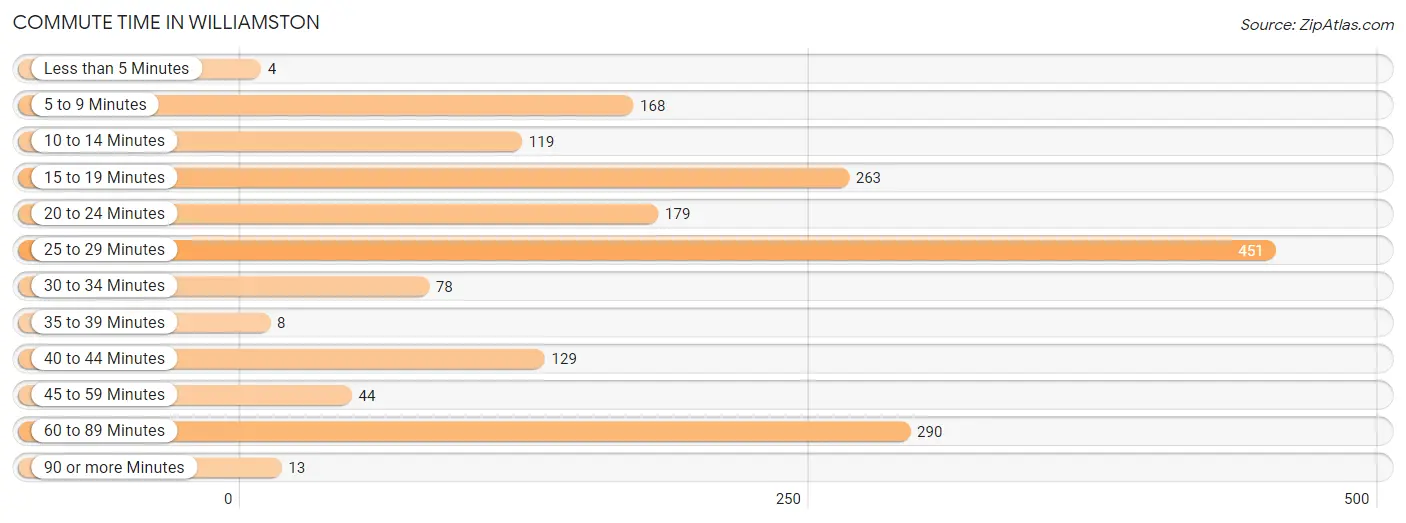
| Commute Time | # Commuters | % Commuters |
| Less than 5 Minutes | 4 | 0.2% |
| 5 to 9 Minutes | 168 | 9.6% |
| 10 to 14 Minutes | 119 | 6.8% |
| 15 to 19 Minutes | 263 | 15.1% |
| 20 to 24 Minutes | 179 | 10.2% |
| 25 to 29 Minutes | 451 | 25.8% |
| 30 to 34 Minutes | 78 | 4.5% |
| 35 to 39 Minutes | 8 | 0.5% |
| 40 to 44 Minutes | 129 | 7.4% |
| 45 to 59 Minutes | 44 | 2.5% |
| 60 to 89 Minutes | 290 | 16.6% |
| 90 or more Minutes | 13 | 0.7% |
Commute Time by Sex in Williamston
The most common commute times in Williamston are 25 to 29 minutes (230 commuters, 25.1%) for males and 25 to 29 minutes (221 commuters, 26.6%) for females.
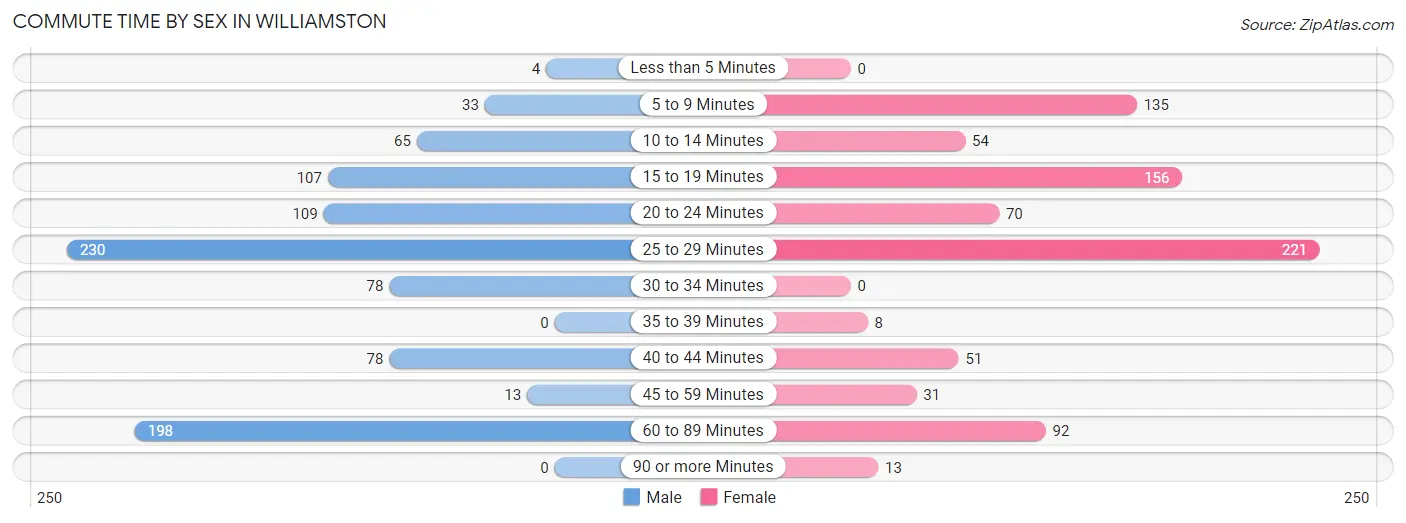
| Commute Time | Male | Female |
| Less than 5 Minutes | 4 (0.4%) | 0 (0.0%) |
| 5 to 9 Minutes | 33 (3.6%) | 135 (16.3%) |
| 10 to 14 Minutes | 65 (7.1%) | 54 (6.5%) |
| 15 to 19 Minutes | 107 (11.7%) | 156 (18.8%) |
| 20 to 24 Minutes | 109 (11.9%) | 70 (8.4%) |
| 25 to 29 Minutes | 230 (25.1%) | 221 (26.6%) |
| 30 to 34 Minutes | 78 (8.5%) | 0 (0.0%) |
| 35 to 39 Minutes | 0 (0.0%) | 8 (1.0%) |
| 40 to 44 Minutes | 78 (8.5%) | 51 (6.1%) |
| 45 to 59 Minutes | 13 (1.4%) | 31 (3.7%) |
| 60 to 89 Minutes | 198 (21.6%) | 92 (11.1%) |
| 90 or more Minutes | 0 (0.0%) | 13 (1.6%) |
Time of Departure to Work by Sex in Williamston
The most frequent times of departure to work in Williamston are 8:30 AM to 8:59 AM (209, 22.8%) for males and 8:00 AM to 8:29 AM (210, 25.3%) for females.
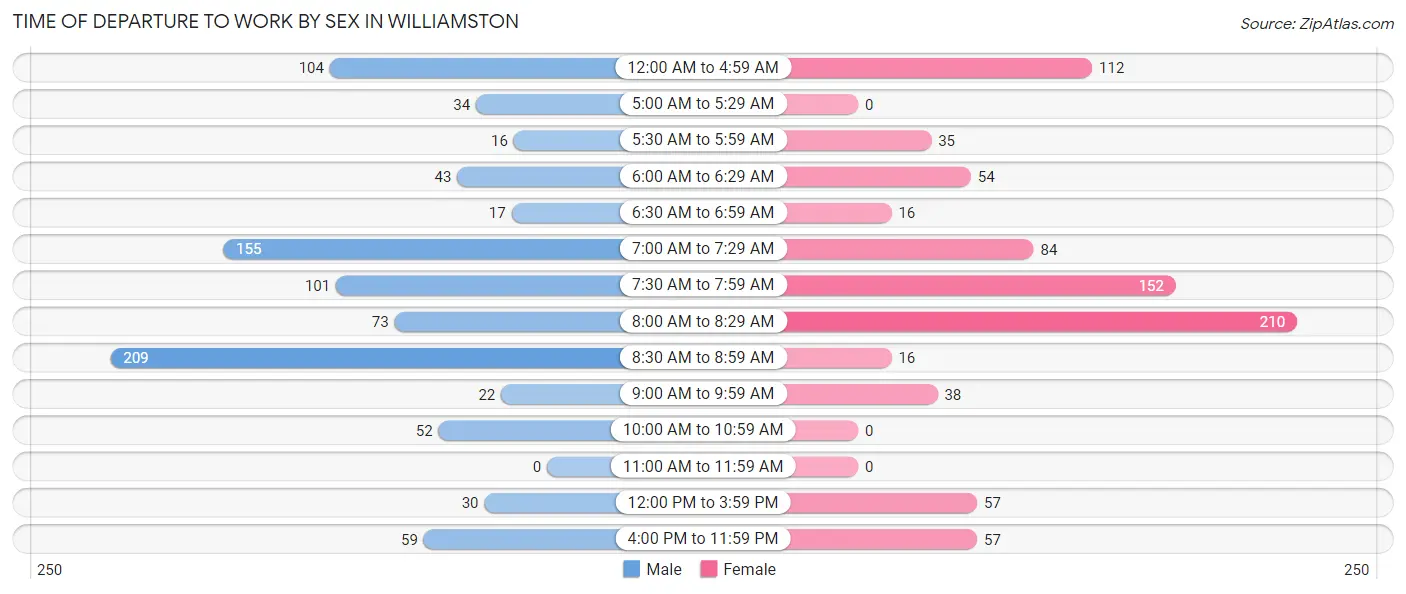
| Time of Departure | Male | Female |
| 12:00 AM to 4:59 AM | 104 (11.4%) | 112 (13.5%) |
| 5:00 AM to 5:29 AM | 34 (3.7%) | 0 (0.0%) |
| 5:30 AM to 5:59 AM | 16 (1.8%) | 35 (4.2%) |
| 6:00 AM to 6:29 AM | 43 (4.7%) | 54 (6.5%) |
| 6:30 AM to 6:59 AM | 17 (1.9%) | 16 (1.9%) |
| 7:00 AM to 7:29 AM | 155 (16.9%) | 84 (10.1%) |
| 7:30 AM to 7:59 AM | 101 (11.0%) | 152 (18.3%) |
| 8:00 AM to 8:29 AM | 73 (8.0%) | 210 (25.3%) |
| 8:30 AM to 8:59 AM | 209 (22.8%) | 16 (1.9%) |
| 9:00 AM to 9:59 AM | 22 (2.4%) | 38 (4.6%) |
| 10:00 AM to 10:59 AM | 52 (5.7%) | 0 (0.0%) |
| 11:00 AM to 11:59 AM | 0 (0.0%) | 0 (0.0%) |
| 12:00 PM to 3:59 PM | 30 (3.3%) | 57 (6.9%) |
| 4:00 PM to 11:59 PM | 59 (6.5%) | 57 (6.9%) |
| Total | 915 (100.0%) | 831 (100.0%) |
Housing Occupancy in Williamston
Occupancy by Ownership in Williamston
Of the total 1,753 dwellings in Williamston, owner-occupied units account for 1,206 (68.8%), while renter-occupied units make up 547 (31.2%).
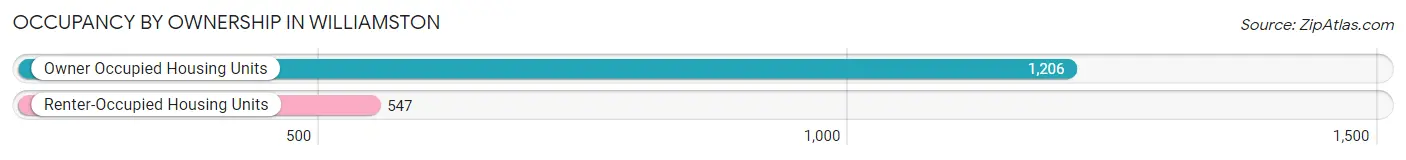
| Occupancy | # Housing Units | % Housing Units |
| Owner Occupied Housing Units | 1,206 | 68.8% |
| Renter-Occupied Housing Units | 547 | 31.2% |
| Total Occupied Housing Units | 1,753 | 100.0% |
Occupancy by Household Size in Williamston
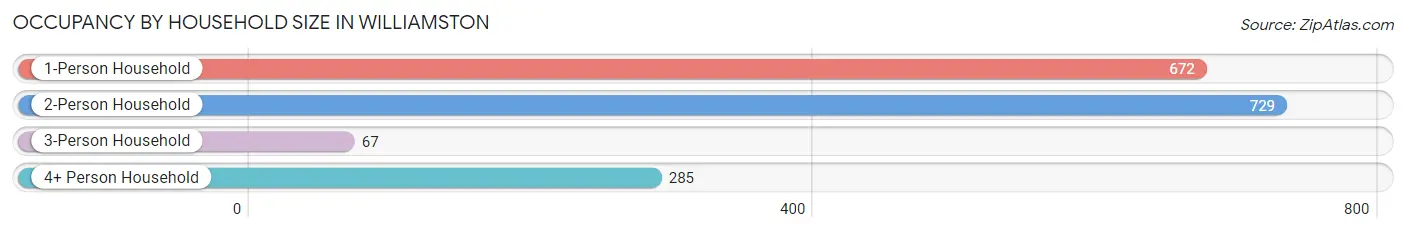
| Household Size | # Housing Units | % Housing Units |
| 1-Person Household | 672 | 38.3% |
| 2-Person Household | 729 | 41.6% |
| 3-Person Household | 67 | 3.8% |
| 4+ Person Household | 285 | 16.3% |
| Total Housing Units | 1,753 | 100.0% |
Occupancy by Ownership by Household Size in Williamston
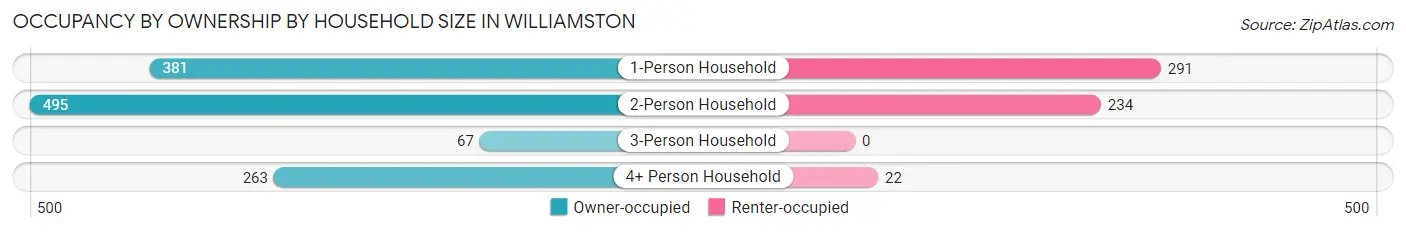
| Household Size | Owner-occupied | Renter-occupied |
| 1-Person Household | 381 (56.7%) | 291 (43.3%) |
| 2-Person Household | 495 (67.9%) | 234 (32.1%) |
| 3-Person Household | 67 (100.0%) | 0 (0.0%) |
| 4+ Person Household | 263 (92.3%) | 22 (7.7%) |
| Total Housing Units | 1,206 (68.8%) | 547 (31.2%) |
Occupancy by Educational Attainment in Williamston
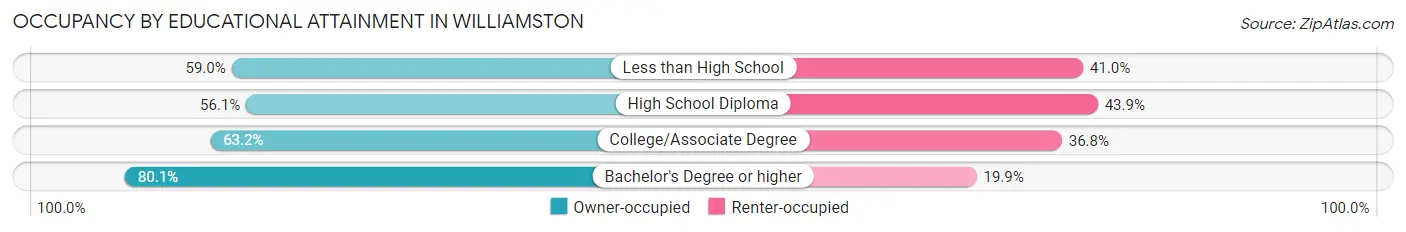
| Household Size | Owner-occupied | Renter-occupied |
| Less than High School | 23 (59.0%) | 16 (41.0%) |
| High School Diploma | 231 (56.1%) | 181 (43.9%) |
| College/Associate Degree | 340 (63.2%) | 198 (36.8%) |
| Bachelor's Degree or higher | 612 (80.1%) | 152 (19.9%) |
Occupancy by Age of Householder in Williamston
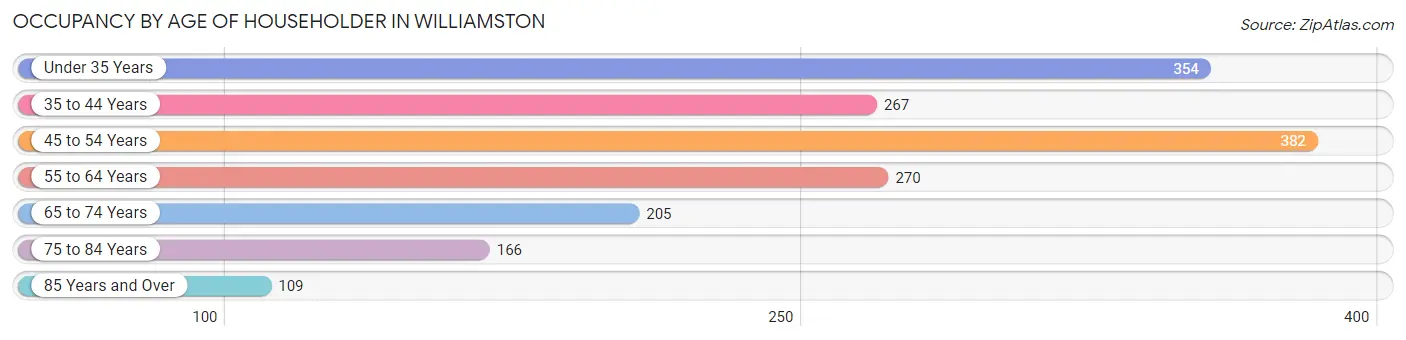
| Age Bracket | # Households | % Households |
| Under 35 Years | 354 | 20.2% |
| 35 to 44 Years | 267 | 15.2% |
| 45 to 54 Years | 382 | 21.8% |
| 55 to 64 Years | 270 | 15.4% |
| 65 to 74 Years | 205 | 11.7% |
| 75 to 84 Years | 166 | 9.5% |
| 85 Years and Over | 109 | 6.2% |
| Total | 1,753 | 100.0% |
Housing Finances in Williamston
Median Income by Occupancy in Williamston
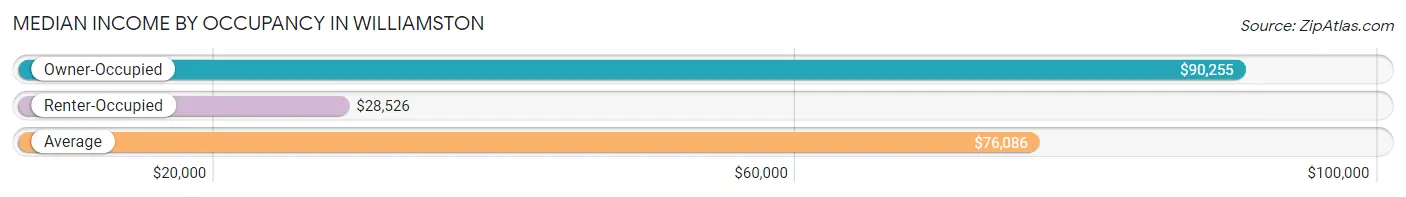
| Occupancy Type | # Households | Median Income |
| Owner-Occupied | 1,206 (68.8%) | $90,255 |
| Renter-Occupied | 547 (31.2%) | $28,526 |
| Average | 1,753 (100.0%) | $76,086 |
Occupancy by Householder Income Bracket in Williamston
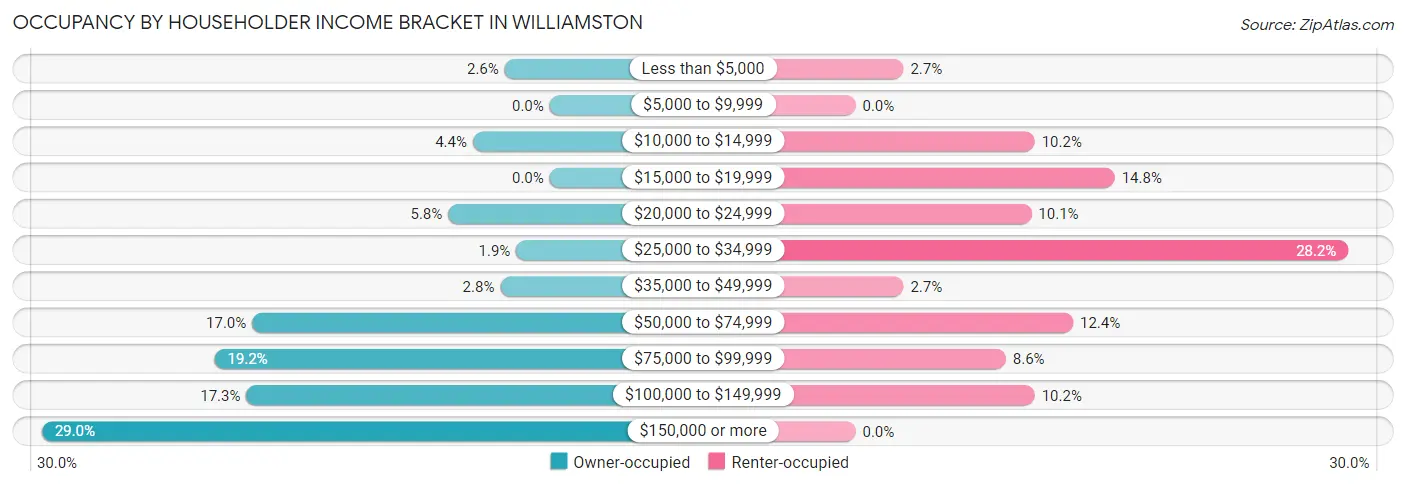
| Income Bracket | Owner-occupied | Renter-occupied |
| Less than $5,000 | 31 (2.6%) | 15 (2.7%) |
| $5,000 to $9,999 | 0 (0.0%) | 0 (0.0%) |
| $10,000 to $14,999 | 53 (4.4%) | 56 (10.2%) |
| $15,000 to $19,999 | 0 (0.0%) | 81 (14.8%) |
| $20,000 to $24,999 | 70 (5.8%) | 55 (10.1%) |
| $25,000 to $34,999 | 23 (1.9%) | 154 (28.1%) |
| $35,000 to $49,999 | 34 (2.8%) | 15 (2.7%) |
| $50,000 to $74,999 | 205 (17.0%) | 68 (12.4%) |
| $75,000 to $99,999 | 231 (19.2%) | 47 (8.6%) |
| $100,000 to $149,999 | 209 (17.3%) | 56 (10.2%) |
| $150,000 or more | 350 (29.0%) | 0 (0.0%) |
| Total | 1,206 (100.0%) | 547 (100.0%) |
Monthly Housing Cost Tiers in Williamston
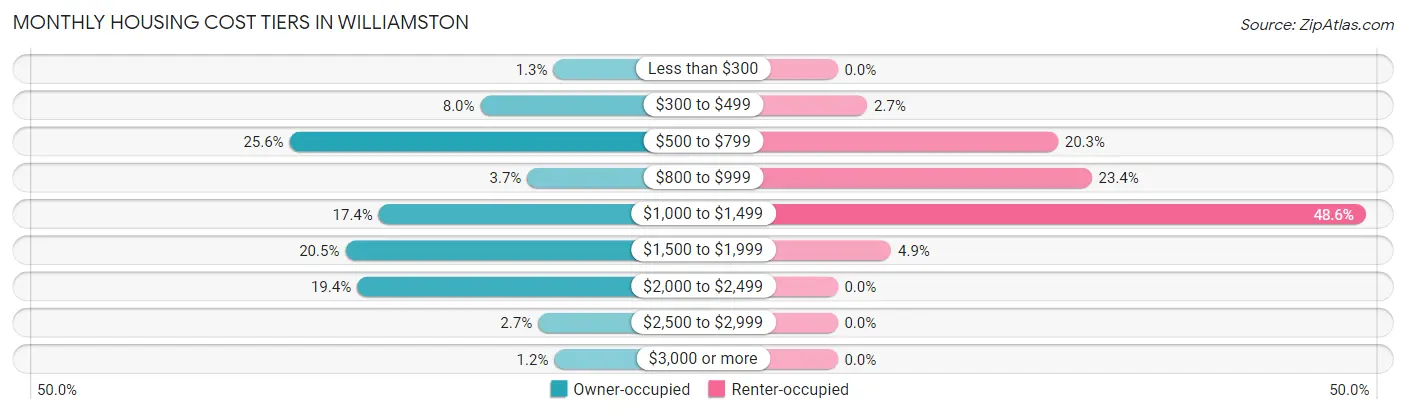
| Monthly Cost | Owner-occupied | Renter-occupied |
| Less than $300 | 16 (1.3%) | 0 (0.0%) |
| $300 to $499 | 97 (8.0%) | 15 (2.7%) |
| $500 to $799 | 309 (25.6%) | 111 (20.3%) |
| $800 to $999 | 45 (3.7%) | 128 (23.4%) |
| $1,000 to $1,499 | 210 (17.4%) | 266 (48.6%) |
| $1,500 to $1,999 | 247 (20.5%) | 27 (4.9%) |
| $2,000 to $2,499 | 234 (19.4%) | 0 (0.0%) |
| $2,500 to $2,999 | 33 (2.7%) | 0 (0.0%) |
| $3,000 or more | 15 (1.2%) | 0 (0.0%) |
| Total | 1,206 (100.0%) | 547 (100.0%) |
Physical Housing Characteristics in Williamston
Housing Structures in Williamston
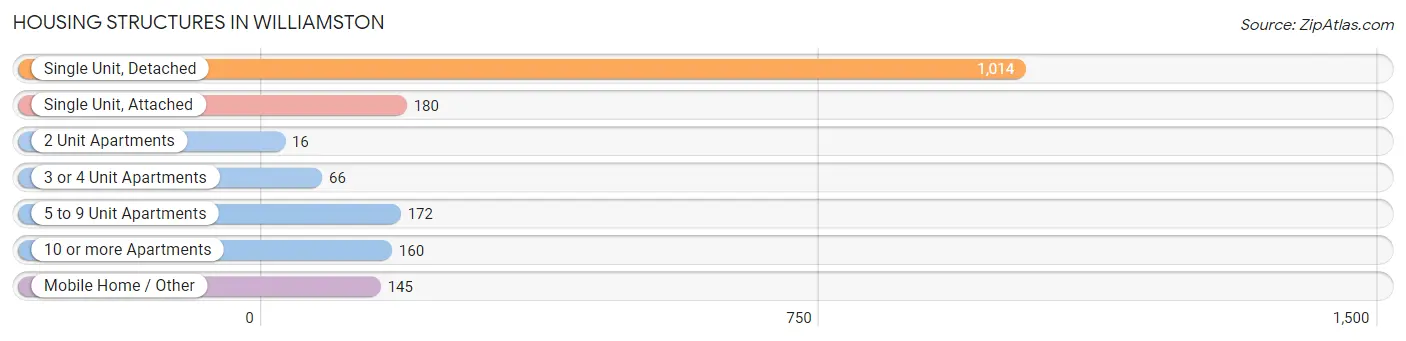
| Structure Type | # Housing Units | % Housing Units |
| Single Unit, Detached | 1,014 | 57.8% |
| Single Unit, Attached | 180 | 10.3% |
| 2 Unit Apartments | 16 | 0.9% |
| 3 or 4 Unit Apartments | 66 | 3.8% |
| 5 to 9 Unit Apartments | 172 | 9.8% |
| 10 or more Apartments | 160 | 9.1% |
| Mobile Home / Other | 145 | 8.3% |
| Total | 1,753 | 100.0% |
Housing Structures by Occupancy in Williamston
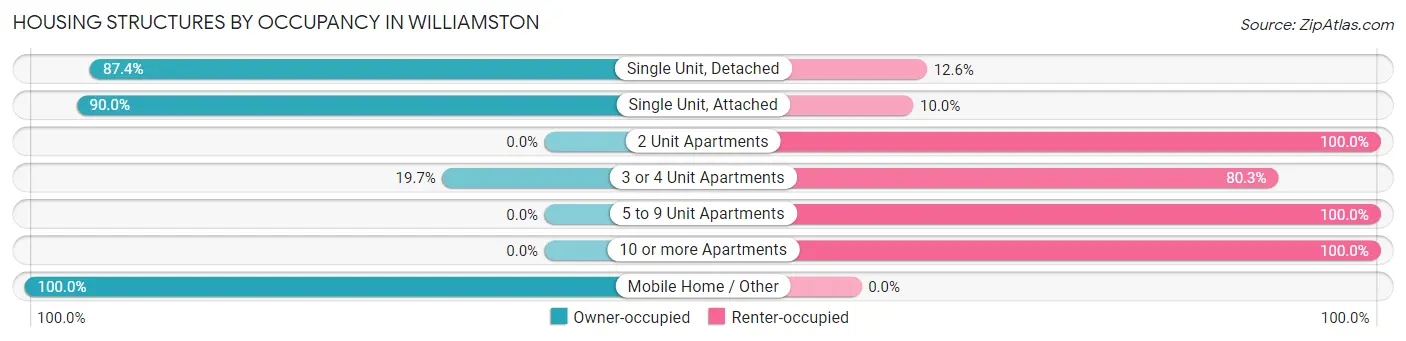
| Structure Type | Owner-occupied | Renter-occupied |
| Single Unit, Detached | 886 (87.4%) | 128 (12.6%) |
| Single Unit, Attached | 162 (90.0%) | 18 (10.0%) |
| 2 Unit Apartments | 0 (0.0%) | 16 (100.0%) |
| 3 or 4 Unit Apartments | 13 (19.7%) | 53 (80.3%) |
| 5 to 9 Unit Apartments | 0 (0.0%) | 172 (100.0%) |
| 10 or more Apartments | 0 (0.0%) | 160 (100.0%) |
| Mobile Home / Other | 145 (100.0%) | 0 (0.0%) |
| Total | 1,206 (68.8%) | 547 (31.2%) |
Housing Structures by Number of Rooms in Williamston
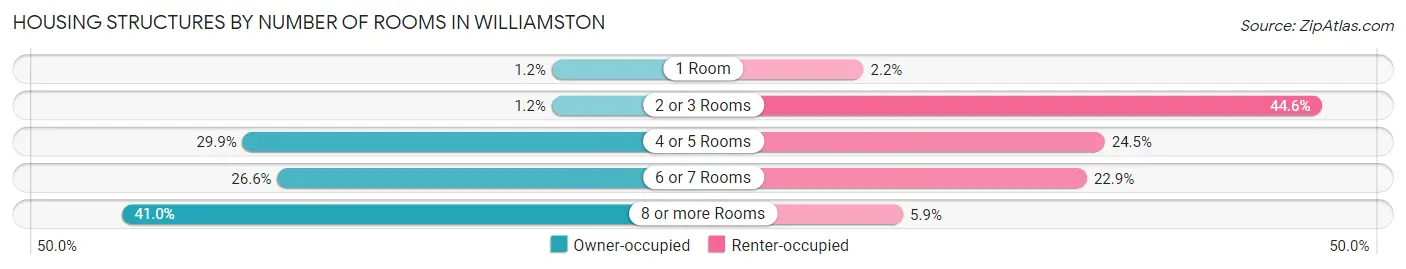
| Number of Rooms | Owner-occupied | Renter-occupied |
| 1 Room | 15 (1.2%) | 12 (2.2%) |
| 2 or 3 Rooms | 15 (1.2%) | 244 (44.6%) |
| 4 or 5 Rooms | 360 (29.8%) | 134 (24.5%) |
| 6 or 7 Rooms | 321 (26.6%) | 125 (22.9%) |
| 8 or more Rooms | 495 (41.0%) | 32 (5.9%) |
| Total | 1,206 (100.0%) | 547 (100.0%) |
Housing Structure by Heating Type in Williamston
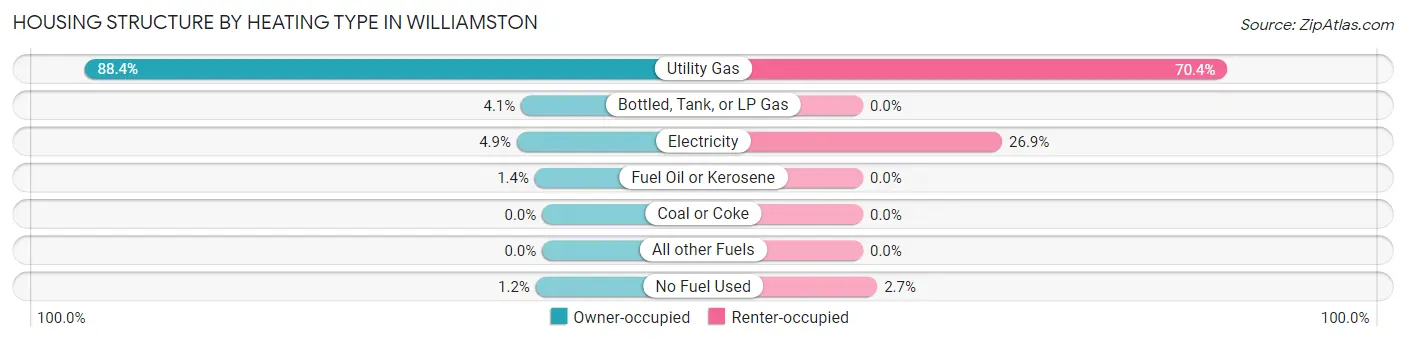
| Heating Type | Owner-occupied | Renter-occupied |
| Utility Gas | 1,066 (88.4%) | 385 (70.4%) |
| Bottled, Tank, or LP Gas | 49 (4.1%) | 0 (0.0%) |
| Electricity | 59 (4.9%) | 147 (26.9%) |
| Fuel Oil or Kerosene | 17 (1.4%) | 0 (0.0%) |
| Coal or Coke | 0 (0.0%) | 0 (0.0%) |
| All other Fuels | 0 (0.0%) | 0 (0.0%) |
| No Fuel Used | 15 (1.2%) | 15 (2.7%) |
| Total | 1,206 (100.0%) | 547 (100.0%) |
Household Vehicle Usage in Williamston
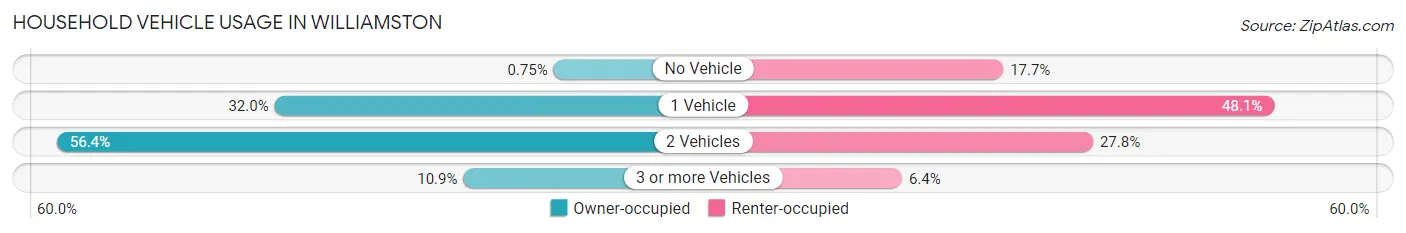
| Vehicles per Household | Owner-occupied | Renter-occupied |
| No Vehicle | 9 (0.7%) | 97 (17.7%) |
| 1 Vehicle | 386 (32.0%) | 263 (48.1%) |
| 2 Vehicles | 680 (56.4%) | 152 (27.8%) |
| 3 or more Vehicles | 131 (10.9%) | 35 (6.4%) |
| Total | 1,206 (100.0%) | 547 (100.0%) |
Real Estate & Mortgages in Williamston
Real Estate and Mortgage Overview in Williamston
| Characteristic | Without Mortgage | With Mortgage |
| Housing Units | 482 | 724 |
| Median Property Value | $117,000 | $244,000 |
| Median Household Income | $69,911 | $341 |
| Monthly Housing Costs | $582 | $15 |
| Real Estate Taxes | $3,280 | $12 |
Property Value by Mortgage Status in Williamston
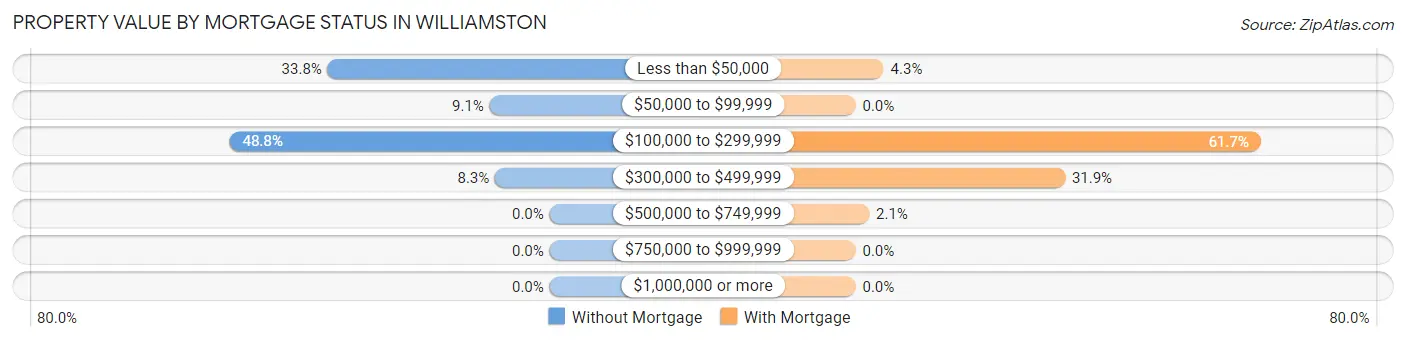
| Property Value | Without Mortgage | With Mortgage |
| Less than $50,000 | 163 (33.8%) | 31 (4.3%) |
| $50,000 to $99,999 | 44 (9.1%) | 0 (0.0%) |
| $100,000 to $299,999 | 235 (48.8%) | 447 (61.7%) |
| $300,000 to $499,999 | 40 (8.3%) | 231 (31.9%) |
| $500,000 to $749,999 | 0 (0.0%) | 15 (2.1%) |
| $750,000 to $999,999 | 0 (0.0%) | 0 (0.0%) |
| $1,000,000 or more | 0 (0.0%) | 0 (0.0%) |
| Total | 482 (100.0%) | 724 (100.0%) |
Household Income by Mortgage Status in Williamston
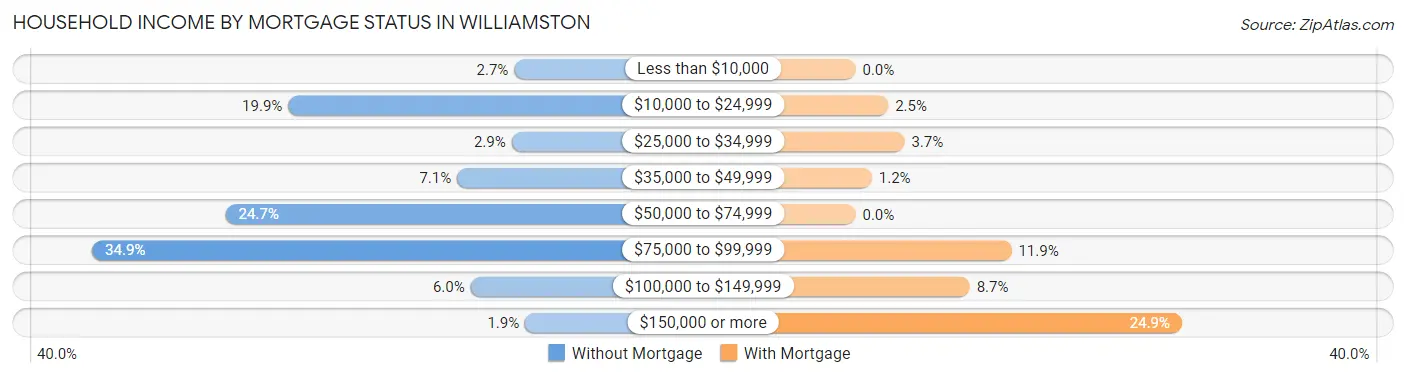
| Household Income | Without Mortgage | With Mortgage |
| Less than $10,000 | 13 (2.7%) | 0 (0.0%) |
| $10,000 to $24,999 | 96 (19.9%) | 18 (2.5%) |
| $25,000 to $34,999 | 14 (2.9%) | 27 (3.7%) |
| $35,000 to $49,999 | 34 (7.0%) | 9 (1.2%) |
| $50,000 to $74,999 | 119 (24.7%) | 0 (0.0%) |
| $75,000 to $99,999 | 168 (34.8%) | 86 (11.9%) |
| $100,000 to $149,999 | 29 (6.0%) | 63 (8.7%) |
| $150,000 or more | 9 (1.9%) | 180 (24.9%) |
| Total | 482 (100.0%) | 724 (100.0%) |
Property Value to Household Income Ratio in Williamston
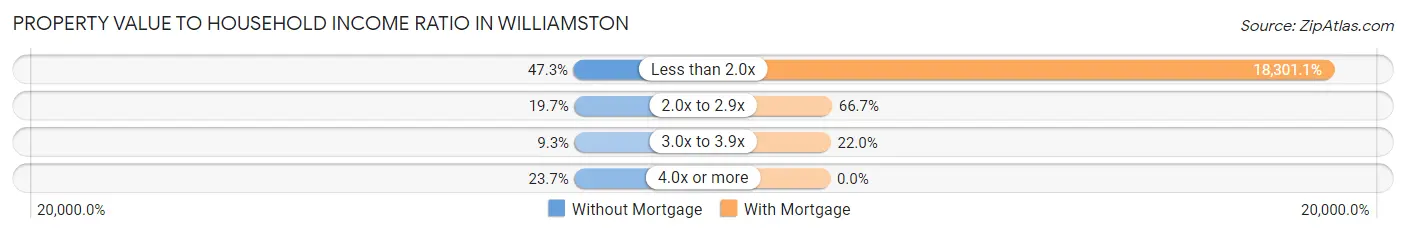
| Value-to-Income Ratio | Without Mortgage | With Mortgage |
| Less than 2.0x | 228 (47.3%) | 132,500 (18,301.1%) |
| 2.0x to 2.9x | 95 (19.7%) | 483 (66.7%) |
| 3.0x to 3.9x | 45 (9.3%) | 159 (22.0%) |
| 4.0x or more | 114 (23.6%) | 0 (0.0%) |
| Total | 482 (100.0%) | 724 (100.0%) |
Real Estate Taxes by Mortgage Status in Williamston
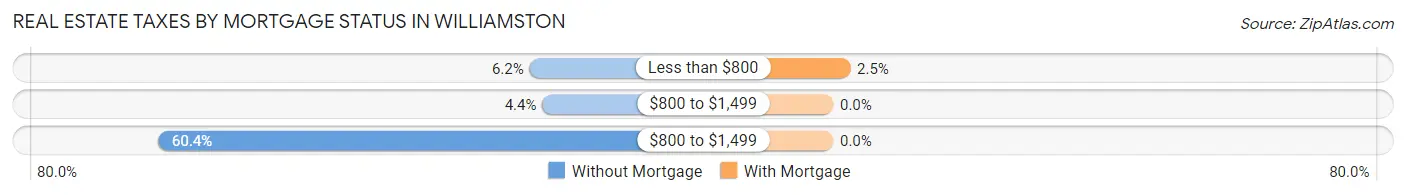
| Property Taxes | Without Mortgage | With Mortgage |
| Less than $800 | 30 (6.2%) | 18 (2.5%) |
| $800 to $1,499 | 21 (4.4%) | 0 (0.0%) |
| $800 to $1,499 | 291 (60.4%) | 0 (0.0%) |
| Total | 482 (100.0%) | 724 (100.0%) |
Health & Disability in Williamston
Health Insurance Coverage by Age in Williamston
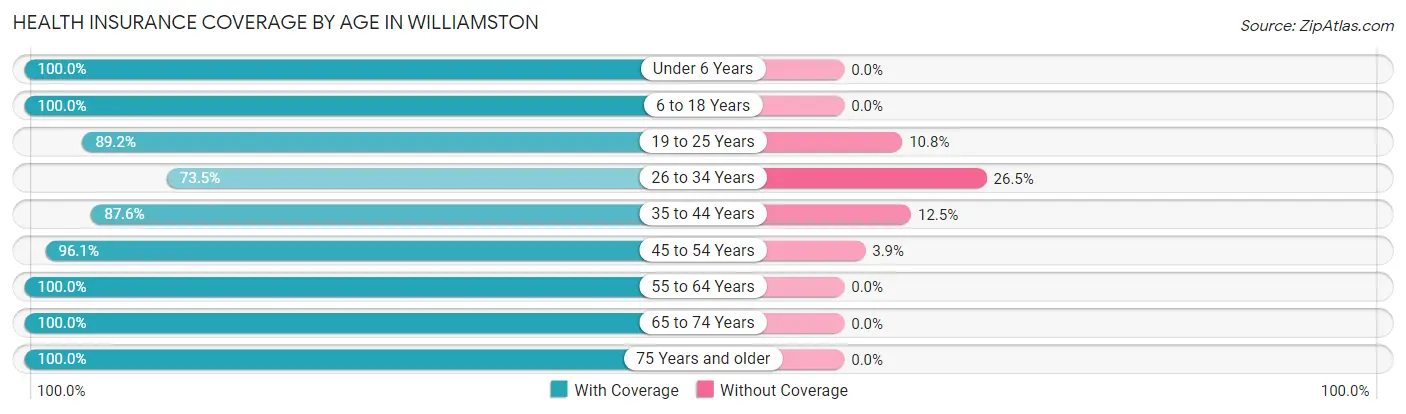
| Age Bracket | With Coverage | Without Coverage |
| Under 6 Years | 384 (100.0%) | 0 (0.0%) |
| 6 to 18 Years | 571 (100.0%) | 0 (0.0%) |
| 19 to 25 Years | 314 (89.2%) | 38 (10.8%) |
| 26 to 34 Years | 263 (73.5%) | 95 (26.5%) |
| 35 to 44 Years | 422 (87.5%) | 60 (12.4%) |
| 45 to 54 Years | 492 (96.1%) | 20 (3.9%) |
| 55 to 64 Years | 537 (100.0%) | 0 (0.0%) |
| 65 to 74 Years | 288 (100.0%) | 0 (0.0%) |
| 75 Years and older | 326 (100.0%) | 0 (0.0%) |
| Total | 3,597 (94.4%) | 213 (5.6%) |
Health Insurance Coverage by Citizenship Status in Williamston
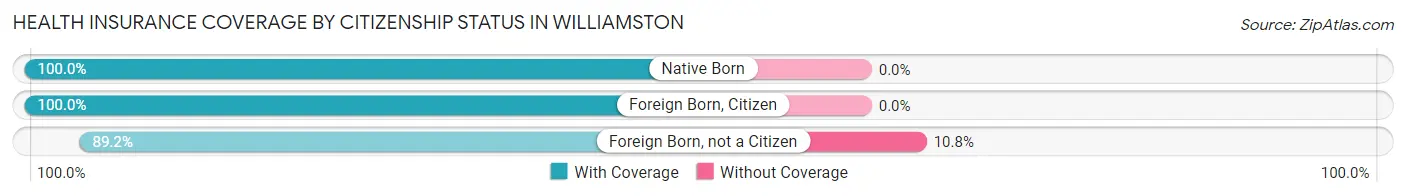
| Citizenship Status | With Coverage | Without Coverage |
| Native Born | 384 (100.0%) | 0 (0.0%) |
| Foreign Born, Citizen | 571 (100.0%) | 0 (0.0%) |
| Foreign Born, not a Citizen | 314 (89.2%) | 38 (10.8%) |
Health Insurance Coverage by Household Income in Williamston
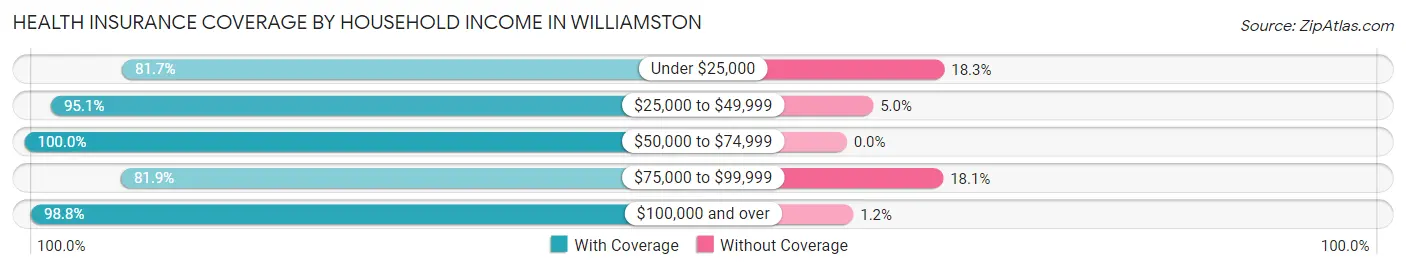
| Household Income | With Coverage | Without Coverage |
| Under $25,000 | 340 (81.7%) | 76 (18.3%) |
| $25,000 to $49,999 | 346 (95.1%) | 18 (5.0%) |
| $50,000 to $74,999 | 762 (100.0%) | 0 (0.0%) |
| $75,000 to $99,999 | 440 (81.9%) | 97 (18.1%) |
| $100,000 and over | 1,707 (98.8%) | 21 (1.2%) |
Public vs Private Health Insurance Coverage by Age in Williamston
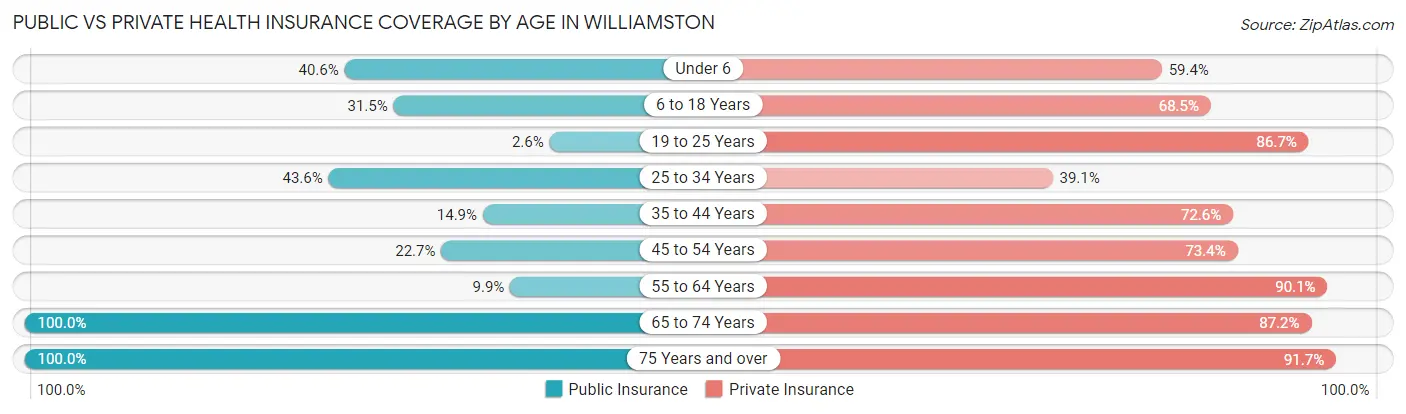
| Age Bracket | Public Insurance | Private Insurance |
| Under 6 | 156 (40.6%) | 228 (59.4%) |
| 6 to 18 Years | 180 (31.5%) | 391 (68.5%) |
| 19 to 25 Years | 9 (2.6%) | 305 (86.7%) |
| 25 to 34 Years | 156 (43.6%) | 140 (39.1%) |
| 35 to 44 Years | 72 (14.9%) | 350 (72.6%) |
| 45 to 54 Years | 116 (22.7%) | 376 (73.4%) |
| 55 to 64 Years | 53 (9.9%) | 484 (90.1%) |
| 65 to 74 Years | 288 (100.0%) | 251 (87.2%) |
| 75 Years and over | 326 (100.0%) | 299 (91.7%) |
| Total | 1,356 (35.6%) | 2,824 (74.1%) |
Disability Status by Sex by Age in Williamston
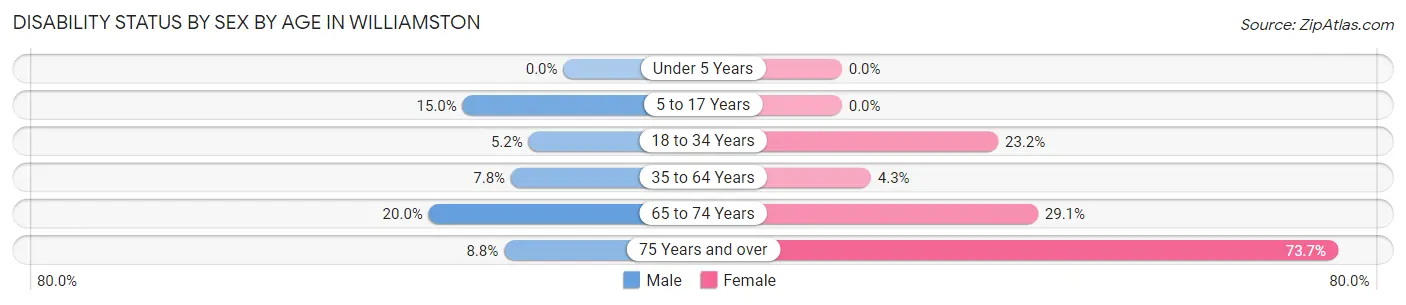
| Age Bracket | Male | Female |
| Under 5 Years | 0 (0.0%) | 0 (0.0%) |
| 5 to 17 Years | 51 (15.0%) | 0 (0.0%) |
| 18 to 34 Years | 18 (5.2%) | 87 (23.2%) |
| 35 to 64 Years | 56 (7.8%) | 35 (4.3%) |
| 65 to 74 Years | 15 (20.0%) | 62 (29.1%) |
| 75 Years and over | 14 (8.8%) | 123 (73.7%) |
Disability Class by Sex by Age in Williamston
Disability Class: Hearing Difficulty
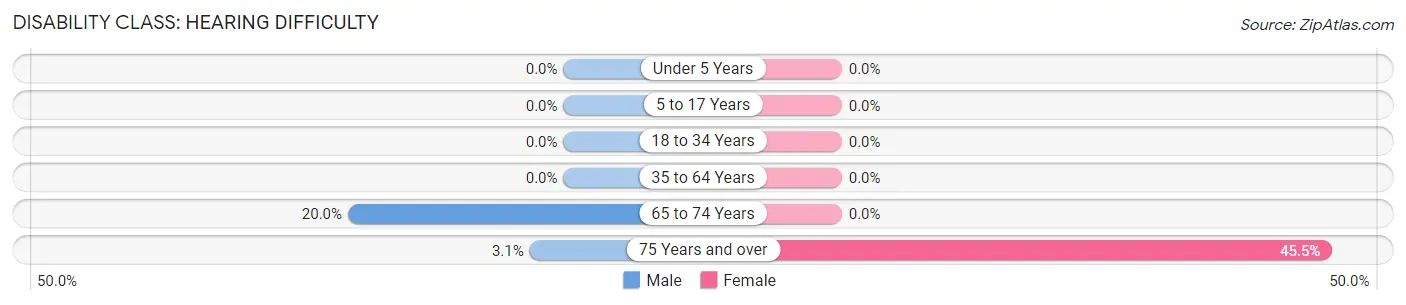
| Age Bracket | Male | Female |
| Under 5 Years | 0 (0.0%) | 0 (0.0%) |
| 5 to 17 Years | 0 (0.0%) | 0 (0.0%) |
| 18 to 34 Years | 0 (0.0%) | 0 (0.0%) |
| 35 to 64 Years | 0 (0.0%) | 0 (0.0%) |
| 65 to 74 Years | 15 (20.0%) | 0 (0.0%) |
| 75 Years and over | 5 (3.1%) | 76 (45.5%) |
Disability Class: Vision Difficulty
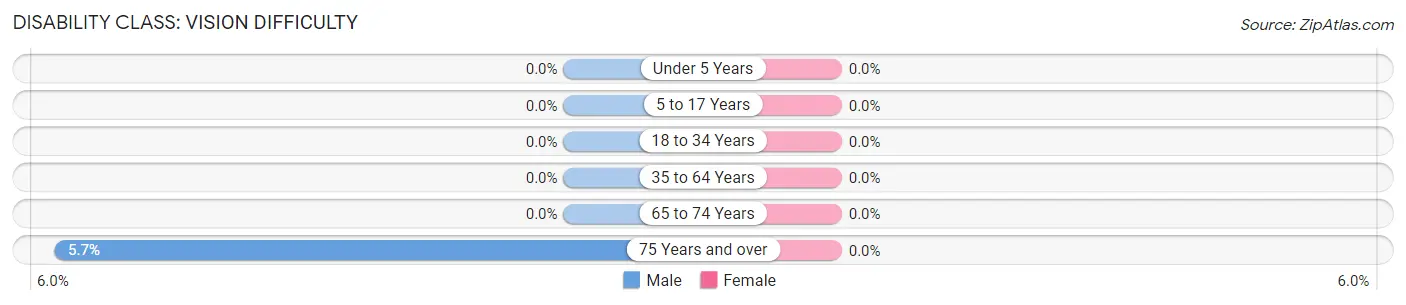
| Age Bracket | Male | Female |
| Under 5 Years | 0 (0.0%) | 0 (0.0%) |
| 5 to 17 Years | 0 (0.0%) | 0 (0.0%) |
| 18 to 34 Years | 0 (0.0%) | 0 (0.0%) |
| 35 to 64 Years | 0 (0.0%) | 0 (0.0%) |
| 65 to 74 Years | 0 (0.0%) | 0 (0.0%) |
| 75 Years and over | 9 (5.7%) | 0 (0.0%) |
Disability Class: Cognitive Difficulty
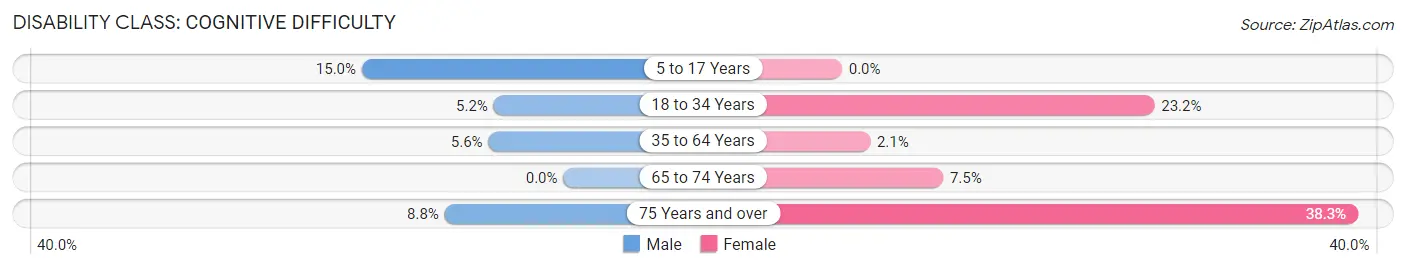
| Age Bracket | Male | Female |
| 5 to 17 Years | 51 (15.0%) | 0 (0.0%) |
| 18 to 34 Years | 18 (5.2%) | 87 (23.2%) |
| 35 to 64 Years | 40 (5.6%) | 17 (2.1%) |
| 65 to 74 Years | 0 (0.0%) | 16 (7.5%) |
| 75 Years and over | 14 (8.8%) | 64 (38.3%) |
Disability Class: Ambulatory Difficulty
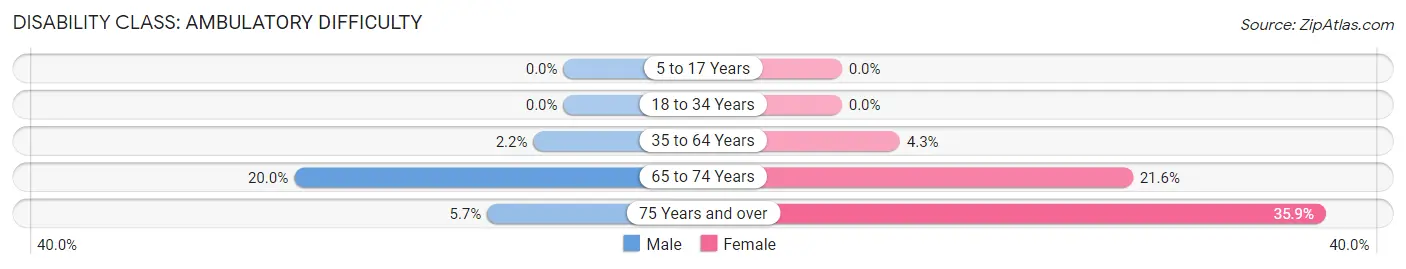
| Age Bracket | Male | Female |
| 5 to 17 Years | 0 (0.0%) | 0 (0.0%) |
| 18 to 34 Years | 0 (0.0%) | 0 (0.0%) |
| 35 to 64 Years | 16 (2.2%) | 35 (4.3%) |
| 65 to 74 Years | 15 (20.0%) | 46 (21.6%) |
| 75 Years and over | 9 (5.7%) | 60 (35.9%) |
Disability Class: Self-Care Difficulty
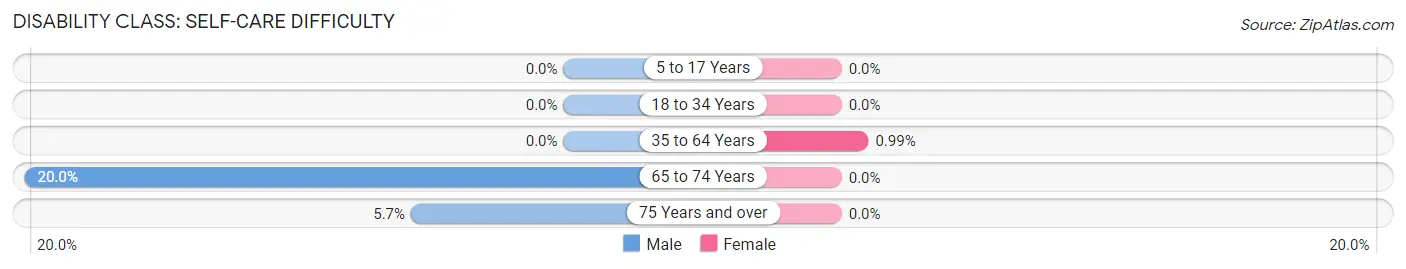
| Age Bracket | Male | Female |
| 5 to 17 Years | 0 (0.0%) | 0 (0.0%) |
| 18 to 34 Years | 0 (0.0%) | 0 (0.0%) |
| 35 to 64 Years | 0 (0.0%) | 8 (1.0%) |
| 65 to 74 Years | 15 (20.0%) | 0 (0.0%) |
| 75 Years and over | 9 (5.7%) | 0 (0.0%) |
Technology Access in Williamston
Computing Device Access in Williamston
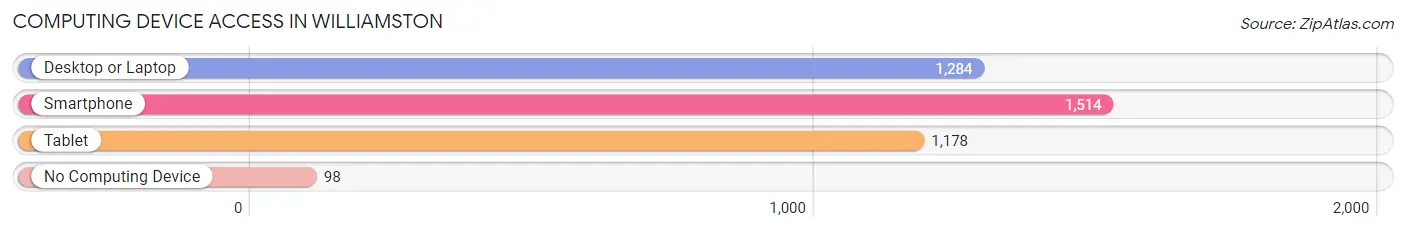
| Device Type | # Households | % Households |
| Desktop or Laptop | 1,284 | 73.3% |
| Smartphone | 1,514 | 86.4% |
| Tablet | 1,178 | 67.2% |
| No Computing Device | 98 | 5.6% |
| Total | 1,753 | 100.0% |
Internet Access in Williamston
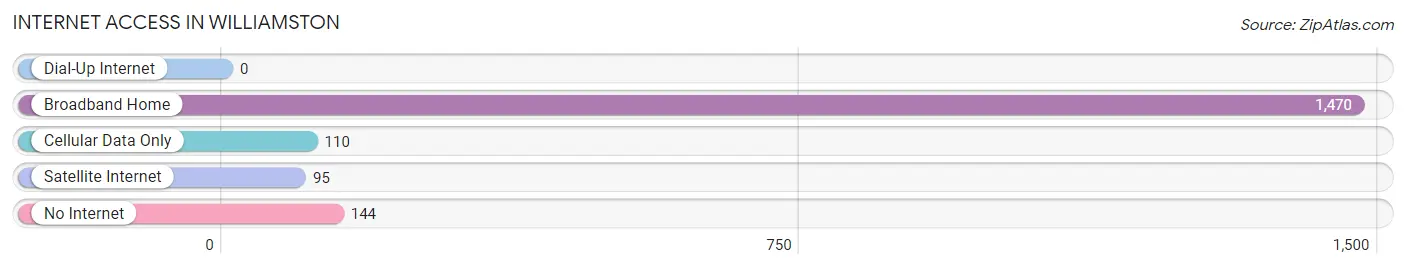
| Internet Type | # Households | % Households |
| Dial-Up Internet | 0 | 0.0% |
| Broadband Home | 1,470 | 83.9% |
| Cellular Data Only | 110 | 6.3% |
| Satellite Internet | 95 | 5.4% |
| No Internet | 144 | 8.2% |
| Total | 1,753 | 100.0% |
Williamston Summary
Williamston, Michigan is a small city located in Ingham County, Michigan. It is situated on the banks of the Red Cedar River, about 10 miles east of Lansing, the state capital. The city has a population of 3,854, according to the 2010 census.
History
Williamston was founded in 1837 by William White, a settler from New York. He named the town after himself and it was incorporated as a village in 1867. The village was originally a farming community, but it soon developed into a manufacturing center. In the late 19th century, Williamston was home to several factories, including a woolen mill, a sawmill, a grist mill, and a furniture factory.
In the early 20th century, Williamston experienced a period of growth and prosperity. The city was home to several businesses, including a bank, a hotel, a movie theater, and a variety of stores. The city also had a thriving agricultural industry, with several farms located in the area.
Geography
Williamston is located in the central part of Michigan, about 10 miles east of Lansing. The city is situated on the banks of the Red Cedar River, which flows through the city. The city is surrounded by rolling hills and farmland. The city has a total area of 2.2 square miles, all of which is land.
Economy
Williamston’s economy is largely based on agriculture and manufacturing. The city is home to several farms, which produce a variety of crops, including corn, soybeans, and wheat. The city is also home to several factories, which produce a variety of products, including furniture, clothing, and automotive parts.
The city also has a thriving retail sector, with several stores and restaurants located in the downtown area. The city is also home to several small businesses, including a bank, a hotel, and a movie theater.
Demographics
According to the 2010 census, Williamston has a population of 3,854. The population is predominantly white, with 92.3% of the population identifying as white. The city also has a small African American population, with 4.2% of the population identifying as African American. The city also has a small Hispanic population, with 1.7% of the population identifying as Hispanic or Latino.
The median household income in Williamston is $45,813, and the median home value is $127,400. The city has a poverty rate of 11.3%, which is slightly higher than the national average.
Conclusion
Williamston, Michigan is a small city located in Ingham County, Michigan. It is situated on the banks of the Red Cedar River, about 10 miles east of Lansing, the state capital. The city has a population of 3,854, according to the 2010 census. Williamston’s economy is largely based on agriculture and manufacturing, and the city has a thriving retail sector. The city also has a small African American population, with 4.2% of the population identifying as African American. The median household income in Williamston is $45,813, and the median home value is $127,400.
Common Questions
What is Per Capita Income in Williamston?
Per Capita income in Williamston is $51,635.
What is the Median Family Income in Williamston?
Median Family Income in Williamston is $120,028.
What is the Median Household income in Williamston?
Median Household Income in Williamston is $76,086.
What is Income or Wage Gap in Williamston?
Income or Wage Gap in Williamston is 14.6%.
Women in Williamston earn 85.4 cents for every dollar earned by a man.
What is Inequality or Gini Index in Williamston?
Inequality or Gini Index in Williamston is 0.52.
What is the Total Population of Williamston?
Total Population of Williamston is 3,810.
What is the Total Male Population of Williamston?
Total Male Population of Williamston is 1,738.
What is the Total Female Population of Williamston?
Total Female Population of Williamston is 2,072.
What is the Ratio of Males per 100 Females in Williamston?
There are 83.88 Males per 100 Females in Williamston.
What is the Ratio of Females per 100 Males in Williamston?
There are 119.22 Females per 100 Males in Williamston.
What is the Median Population Age in Williamston?
Median Population Age in Williamston is 40.2 Years.
What is the Average Family Size in Williamston
Average Family Size in Williamston is 2.9 People.
What is the Average Household Size in Williamston
Average Household Size in Williamston is 2.2 People.
How Large is the Labor Force in Williamston?
There are 2,048 People in the Labor Forcein in Williamston.
What is the Percentage of People in the Labor Force in Williamston?
70.0% of People are in the Labor Force in Williamston.
What is the Unemployment Rate in Williamston?
Unemployment Rate in Williamston is 4.3%.