Flat Rock, MI Map & Demographics
Flat Rock Map
Flat Rock Overview
$32,566
PER CAPITA INCOME
$81,053
AVG FAMILY INCOME
$65,374
AVG HOUSEHOLD INCOME
19.3%
WAGE / INCOME GAP [ % ]
80.7¢/ $1
WAGE / INCOME GAP [ $ ]
$11,880
FAMILY INCOME DEFICIT
0.47
INEQUALITY / GINI INDEX
10,448
TOTAL POPULATION
5,208
MALE POPULATION
5,240
FEMALE POPULATION
99.39
MALES / 100 FEMALES
100.61
FEMALES / 100 MALES
35.7
MEDIAN AGE
3.2
AVG FAMILY SIZE
2.8
AVG HOUSEHOLD SIZE
5,234
LABOR FORCE [ PEOPLE ]
64.9%
PERCENT IN LABOR FORCE
7.6%
UNEMPLOYMENT RATE
Flat Rock Zip Codes
Flat Rock Area Codes
Income in Flat Rock
Income Overview in Flat Rock
Per Capita Income in Flat Rock is $32,566, while median incomes of families and households are $81,053 and $65,374 respectively.
| Characteristic | Number | Measure |
| Per Capita Income | 10,448 | $32,566 |
| Median Family Income | 2,773 | $81,053 |
| Mean Family Income | 2,773 | $104,366 |
| Median Household Income | 3,788 | $65,374 |
| Mean Household Income | 3,788 | $88,524 |
| Income Deficit | 2,773 | $11,880 |
| Wage / Income Gap (%) | 10,448 | 19.29% |
| Wage / Income Gap ($) | 10,448 | 80.71¢ per $1 |
| Gini / Inequality Index | 10,448 | 0.47 |
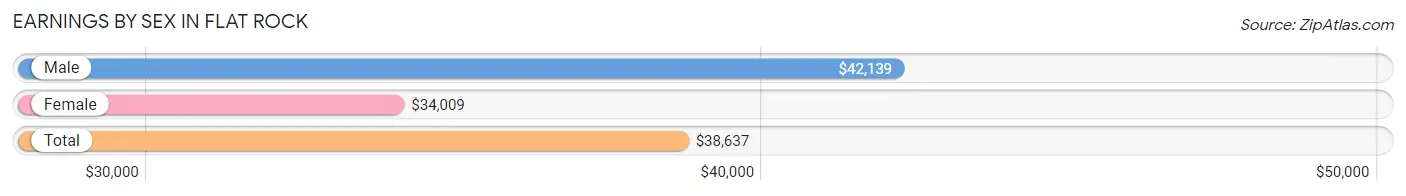
Earnings by Sex in Flat Rock
Average Earnings in Flat Rock are $38,637, $42,139 for men and $34,009 for women, a difference of 19.3%.
| Sex | Number | Average Earnings |
| Male | 2,723 (52.7%) | $42,139 |
| Female | 2,443 (47.3%) | $34,009 |
| Total | 5,166 (100.0%) | $38,637 |
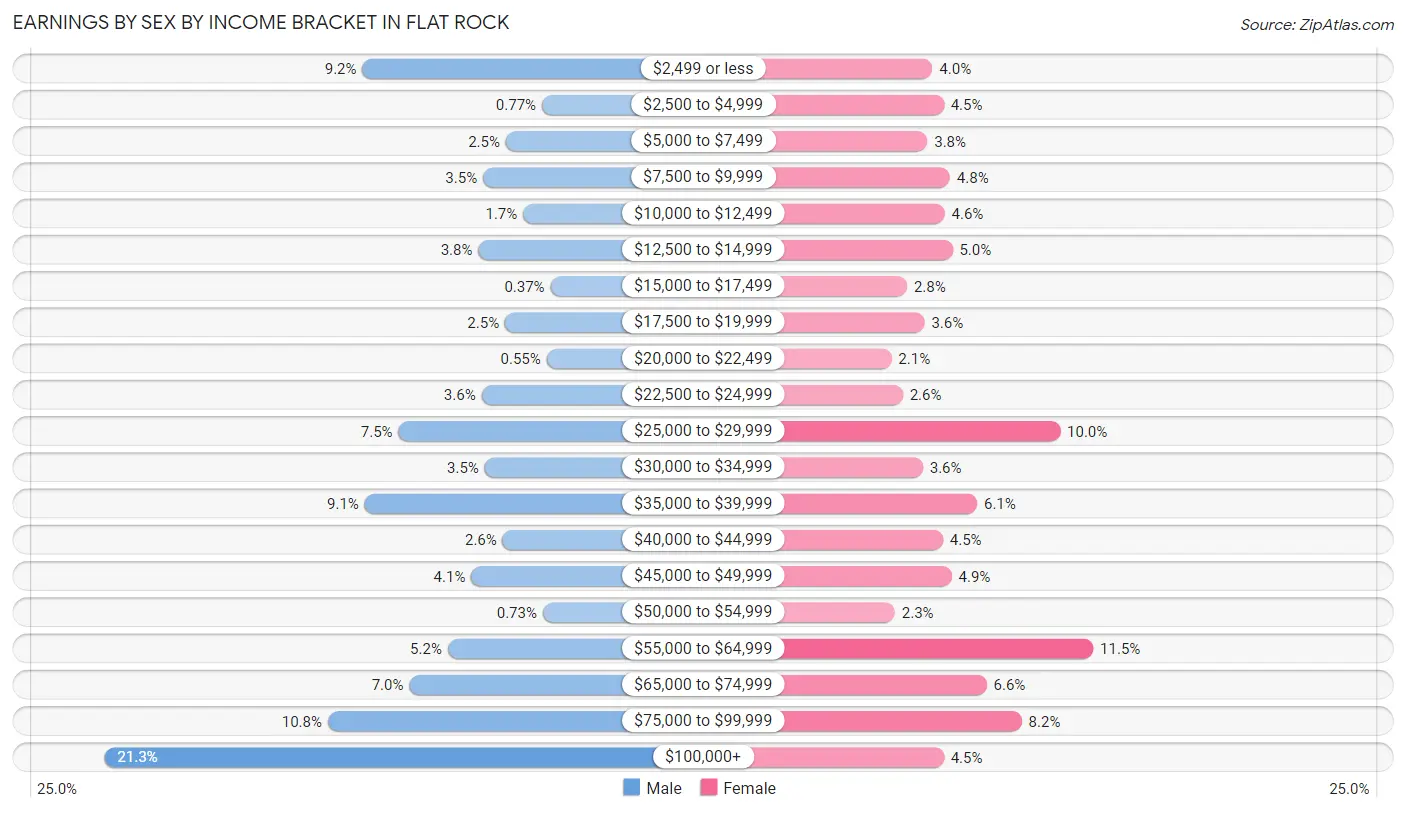
Earnings by Sex by Income Bracket in Flat Rock
The most common earnings brackets in Flat Rock are $100,000+ for men (579 | 21.3%) and $55,000 to $64,999 for women (282 | 11.5%).
| Income | Male | Female |
| $2,499 or less | 250 (9.2%) | 98 (4.0%) |
| $2,500 to $4,999 | 21 (0.8%) | 111 (4.5%) |
| $5,000 to $7,499 | 67 (2.5%) | 92 (3.8%) |
| $7,500 to $9,999 | 96 (3.5%) | 118 (4.8%) |
| $10,000 to $12,499 | 45 (1.7%) | 112 (4.6%) |
| $12,500 to $14,999 | 102 (3.7%) | 121 (5.0%) |
| $15,000 to $17,499 | 10 (0.4%) | 69 (2.8%) |
| $17,500 to $19,999 | 68 (2.5%) | 89 (3.6%) |
| $20,000 to $22,499 | 15 (0.5%) | 51 (2.1%) |
| $22,500 to $24,999 | 98 (3.6%) | 64 (2.6%) |
| $25,000 to $29,999 | 204 (7.5%) | 244 (10.0%) |
| $30,000 to $34,999 | 94 (3.5%) | 87 (3.6%) |
| $35,000 to $39,999 | 247 (9.1%) | 149 (6.1%) |
| $40,000 to $44,999 | 71 (2.6%) | 110 (4.5%) |
| $45,000 to $49,999 | 111 (4.1%) | 120 (4.9%) |
| $50,000 to $54,999 | 20 (0.7%) | 55 (2.2%) |
| $55,000 to $64,999 | 141 (5.2%) | 282 (11.5%) |
| $65,000 to $74,999 | 190 (7.0%) | 160 (6.6%) |
| $75,000 to $99,999 | 294 (10.8%) | 200 (8.2%) |
| $100,000+ | 579 (21.3%) | 111 (4.5%) |
| Total | 2,723 (100.0%) | 2,443 (100.0%) |
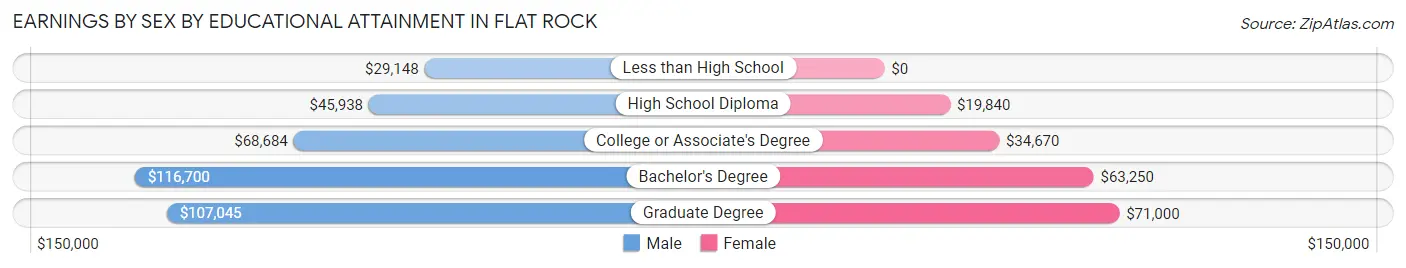
Earnings by Sex by Educational Attainment in Flat Rock
Average earnings in Flat Rock are $66,089 for men and $37,235 for women, a difference of 43.7%. Men with an educational attainment of bachelor's degree enjoy the highest average annual earnings of $116,700, while those with less than high school education earn the least with $29,148. Women with an educational attainment of graduate degree earn the most with the average annual earnings of $71,000, while those with high school diploma education have the smallest earnings of $19,840.
| Educational Attainment | Male Income | Female Income |
| Less than High School | $29,148 | $0 |
| High School Diploma | $45,938 | $19,840 |
| College or Associate's Degree | $68,684 | $34,670 |
| Bachelor's Degree | $116,700 | $63,250 |
| Graduate Degree | $107,045 | $71,000 |
| Total | $66,089 | $37,235 |
Family Income in Flat Rock
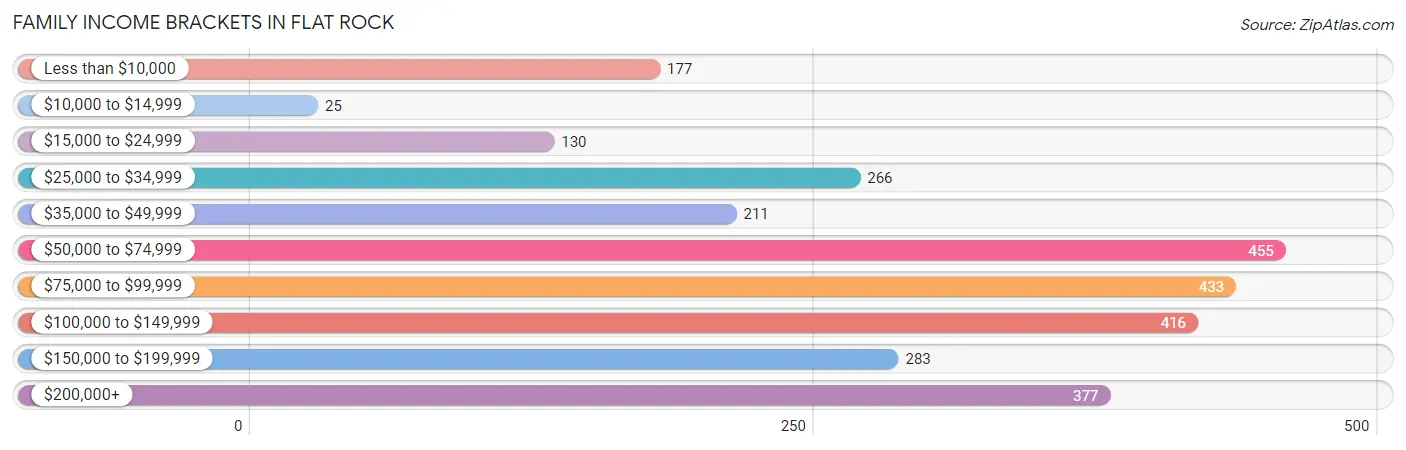
Family Income Brackets in Flat Rock
According to the Flat Rock family income data, there are 455 families falling into the $50,000 to $74,999 income range, which is the most common income bracket and makes up 16.4% of all families. Conversely, the $10,000 to $14,999 income bracket is the least frequent group with only 25 families (0.9%) belonging to this category.
| Income Bracket | # Families | % Families |
| Less than $10,000 | 177 | 6.4% |
| $10,000 to $14,999 | 25 | 0.9% |
| $15,000 to $24,999 | 130 | 4.7% |
| $25,000 to $34,999 | 266 | 9.6% |
| $35,000 to $49,999 | 211 | 7.6% |
| $50,000 to $74,999 | 455 | 16.4% |
| $75,000 to $99,999 | 433 | 15.6% |
| $100,000 to $149,999 | 416 | 15.0% |
| $150,000 to $199,999 | 283 | 10.2% |
| $200,000+ | 377 | 13.6% |
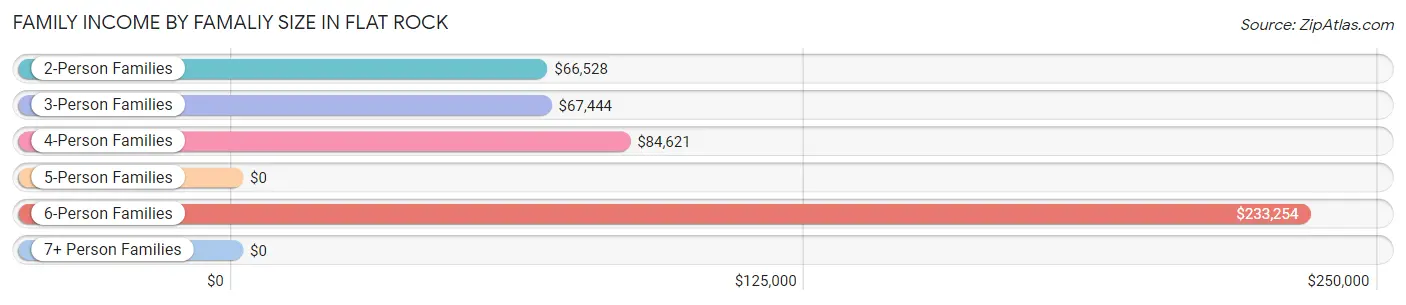
Family Income by Famaliy Size in Flat Rock
6-person families (175 | 6.3%) account for the highest median family income in Flat Rock with $233,254 per family, while 6-person families (175 | 6.3%) have the highest median income of $38,876 per family member.
| Income Bracket | # Families | Median Income |
| 2-Person Families | 1,196 (43.1%) | $66,528 |
| 3-Person Families | 784 (28.3%) | $67,444 |
| 4-Person Families | 395 (14.2%) | $84,621 |
| 5-Person Families | 198 (7.1%) | $0 |
| 6-Person Families | 175 (6.3%) | $233,254 |
| 7+ Person Families | 25 (0.9%) | $0 |
| Total | 2,773 (100.0%) | $81,053 |
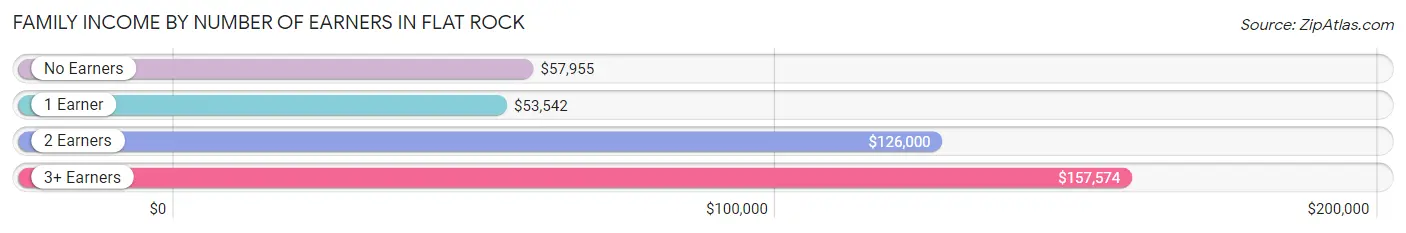
Family Income by Number of Earners in Flat Rock
The median family income in Flat Rock is $81,053, with families comprising 3+ earners (401) having the highest median family income of $157,574, while families with 1 earner (1,052) have the lowest median family income of $53,542, accounting for 14.5% and 37.9% of families, respectively.
| Number of Earners | # Families | Median Income |
| No Earners | 400 (14.4%) | $57,955 |
| 1 Earner | 1,052 (37.9%) | $53,542 |
| 2 Earners | 920 (33.2%) | $126,000 |
| 3+ Earners | 401 (14.5%) | $157,574 |
| Total | 2,773 (100.0%) | $81,053 |
Household Income in Flat Rock
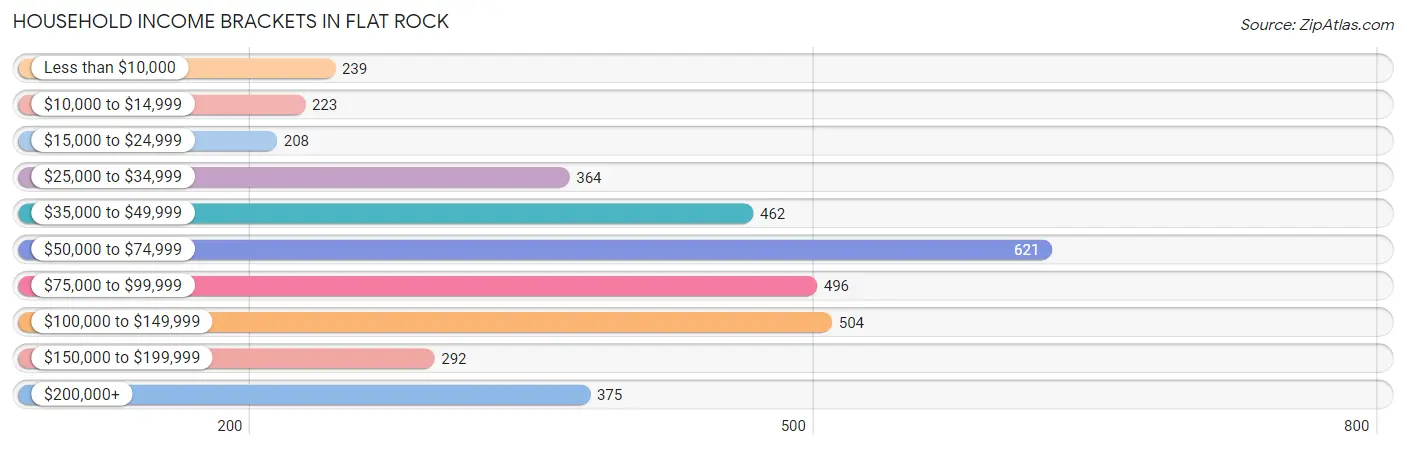
Household Income Brackets in Flat Rock
With 621 households falling in the category, the $50,000 to $74,999 income range is the most frequent in Flat Rock, accounting for 16.4% of all households. In contrast, only 208 households (5.5%) fall into the $15,000 to $24,999 income bracket, making it the least populous group.
| Income Bracket | # Households | % Households |
| Less than $10,000 | 239 | 6.3% |
| $10,000 to $14,999 | 223 | 5.9% |
| $15,000 to $24,999 | 208 | 5.5% |
| $25,000 to $34,999 | 364 | 9.6% |
| $35,000 to $49,999 | 462 | 12.2% |
| $50,000 to $74,999 | 621 | 16.4% |
| $75,000 to $99,999 | 496 | 13.1% |
| $100,000 to $149,999 | 504 | 13.3% |
| $150,000 to $199,999 | 292 | 7.7% |
| $200,000+ | 375 | 9.9% |
Household Income by Householder Age in Flat Rock
The median household income in Flat Rock is $65,374, with the highest median household income of $84,293 found in the 45 to 64 years age bracket for the primary householder. A total of 1,500 households (39.6%) fall into this category. Meanwhile, the 15 to 24 years age bracket for the primary householder has the lowest median household income of $30,556, with 70 households (1.8%) in this group.
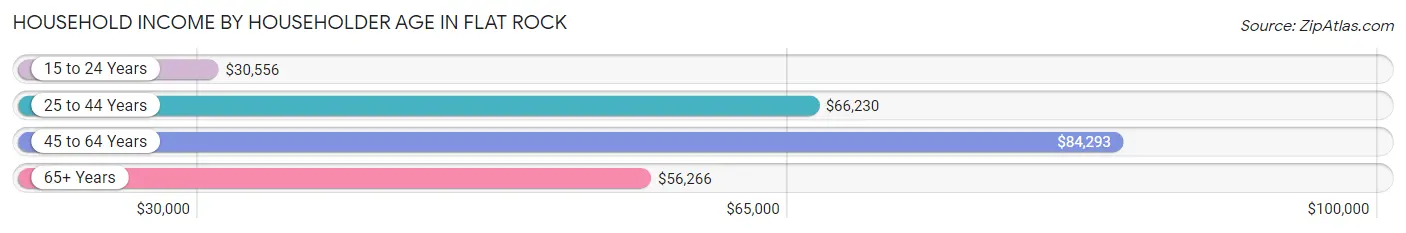
| Income Bracket | # Households | Median Income |
| 15 to 24 Years | 70 (1.8%) | $30,556 |
| 25 to 44 Years | 1,245 (32.9%) | $66,230 |
| 45 to 64 Years | 1,500 (39.6%) | $84,293 |
| 65+ Years | 973 (25.7%) | $56,266 |
| Total | 3,788 (100.0%) | $65,374 |
Poverty in Flat Rock
Income Below Poverty by Sex and Age in Flat Rock
With 14.9% poverty level for males and 17.8% for females among the residents of Flat Rock, 5 year old males and 6 to 11 year old females are the most vulnerable to poverty, with 56 males (62.2%) and 169 females (35.6%) in their respective age groups living below the poverty level.
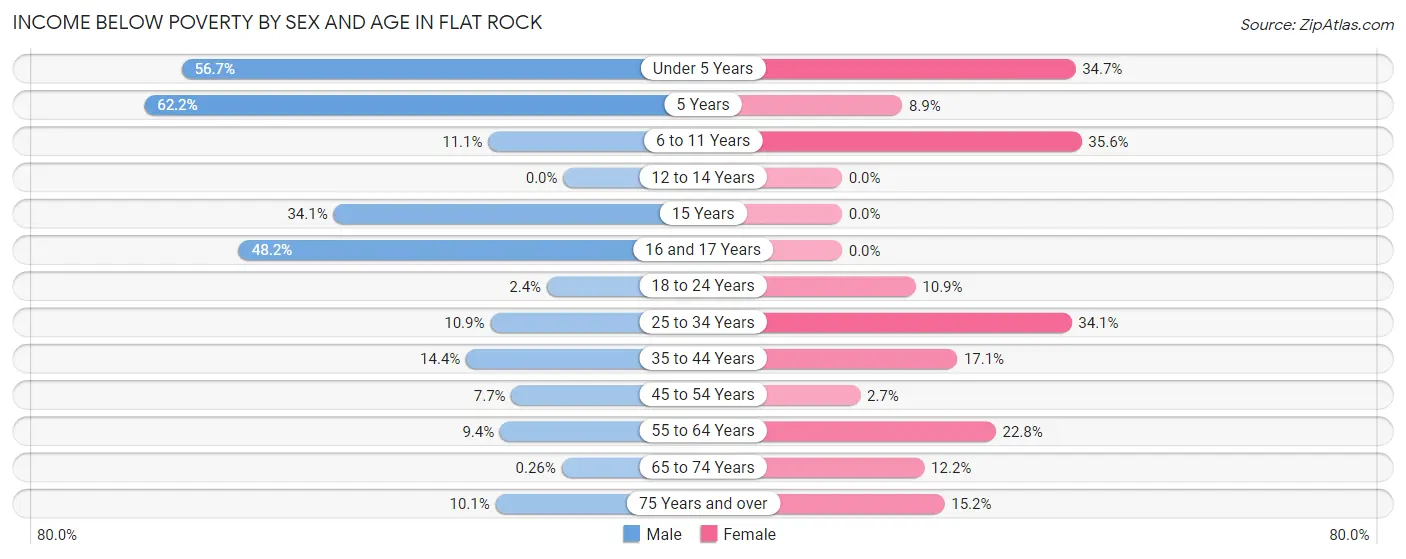
| Age Bracket | Male | Female |
| Under 5 Years | 246 (56.7%) | 61 (34.7%) |
| 5 Years | 56 (62.2%) | 11 (8.9%) |
| 6 to 11 Years | 48 (11.1%) | 169 (35.6%) |
| 12 to 14 Years | 0 (0.0%) | 0 (0.0%) |
| 15 Years | 43 (34.1%) | 0 (0.0%) |
| 16 and 17 Years | 92 (48.2%) | 0 (0.0%) |
| 18 to 24 Years | 17 (2.4%) | 38 (10.9%) |
| 25 to 34 Years | 61 (10.8%) | 239 (34.1%) |
| 35 to 44 Years | 83 (14.4%) | 151 (17.1%) |
| 45 to 54 Years | 42 (7.7%) | 18 (2.7%) |
| 55 to 64 Years | 72 (9.4%) | 134 (22.8%) |
| 65 to 74 Years | 1 (0.3%) | 79 (12.2%) |
| 75 Years and over | 15 (10.1%) | 28 (15.2%) |
| Total | 776 (14.9%) | 928 (17.8%) |
Income Above Poverty by Sex and Age in Flat Rock
According to the poverty statistics in Flat Rock, males aged 12 to 14 years and females aged 12 to 14 years are the age groups that are most secure financially, with 100.0% of males and 100.0% of females in these age groups living above the poverty line.
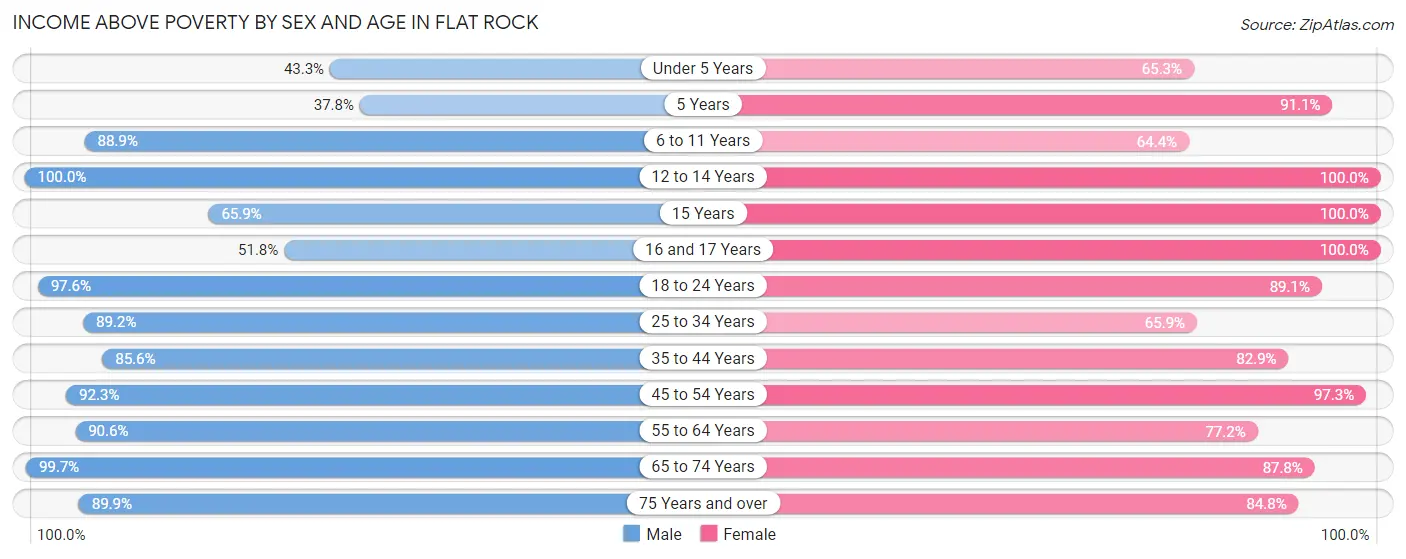
| Age Bracket | Male | Female |
| Under 5 Years | 188 (43.3%) | 115 (65.3%) |
| 5 Years | 34 (37.8%) | 112 (91.1%) |
| 6 to 11 Years | 383 (88.9%) | 306 (64.4%) |
| 12 to 14 Years | 253 (100.0%) | 149 (100.0%) |
| 15 Years | 83 (65.9%) | 113 (100.0%) |
| 16 and 17 Years | 99 (51.8%) | 175 (100.0%) |
| 18 to 24 Years | 680 (97.6%) | 310 (89.1%) |
| 25 to 34 Years | 501 (89.1%) | 462 (65.9%) |
| 35 to 44 Years | 492 (85.6%) | 732 (82.9%) |
| 45 to 54 Years | 503 (92.3%) | 646 (97.3%) |
| 55 to 64 Years | 694 (90.6%) | 453 (77.2%) |
| 65 to 74 Years | 383 (99.7%) | 567 (87.8%) |
| 75 Years and over | 134 (89.9%) | 156 (84.8%) |
| Total | 4,427 (85.1%) | 4,296 (82.2%) |
Income Below Poverty Among Married-Couple Families in Flat Rock
The poverty statistics for married-couple families in Flat Rock show that 3.4% or 59 of the total 1,749 families live below the poverty line. Families with 3 or 4 children have the highest poverty rate of 20.5%, comprising of 32 families. On the other hand, families with no children have the lowest poverty rate of 0.0%, which includes 0 families.
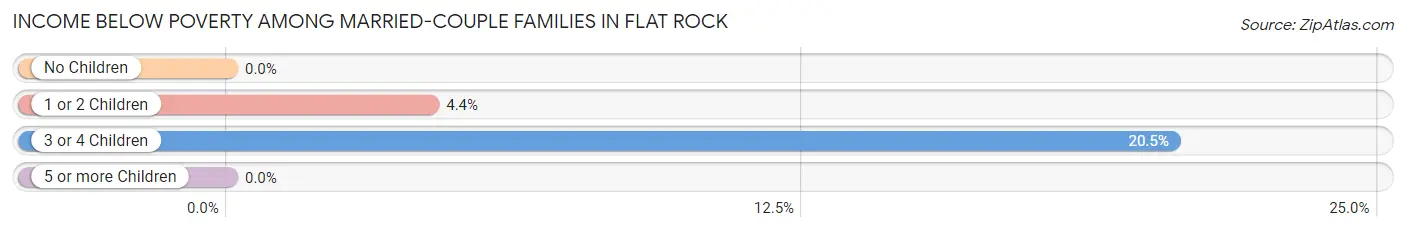
| Children | Above Poverty | Below Poverty |
| No Children | 976 (100.0%) | 0 (0.0%) |
| 1 or 2 Children | 590 (95.6%) | 27 (4.4%) |
| 3 or 4 Children | 124 (79.5%) | 32 (20.5%) |
| 5 or more Children | 0 (0.0%) | 0 (0.0%) |
| Total | 1,690 (96.6%) | 59 (3.4%) |
Income Below Poverty Among Single-Parent Households in Flat Rock
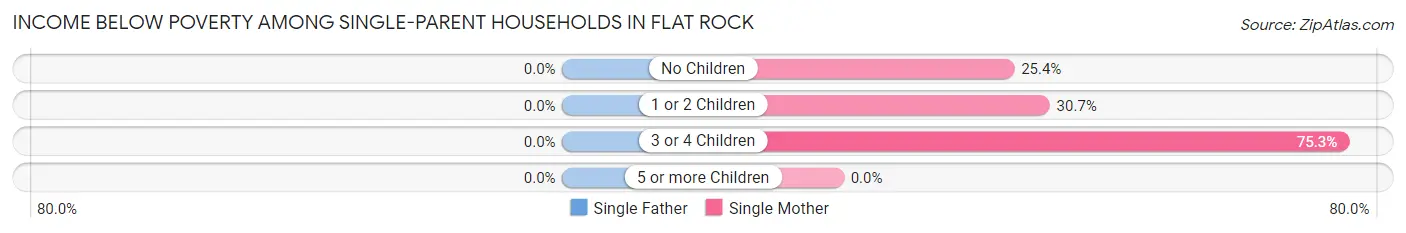
| Children | Single Father | Single Mother |
| No Children | 0 (0.0%) | 62 (25.4%) |
| 1 or 2 Children | 0 (0.0%) | 155 (30.7%) |
| 3 or 4 Children | 0 (0.0%) | 64 (75.3%) |
| 5 or more Children | 0 (0.0%) | 0 (0.0%) |
| Total | 0 (0.0%) | 281 (33.7%) |
Income Below Poverty Among Married-Couple vs Single-Parent Households in Flat Rock
The poverty data for Flat Rock shows that 59 of the married-couple family households (3.4%) and 281 of the single-parent households (27.4%) are living below the poverty level. Within the married-couple family households, those with 3 or 4 children have the highest poverty rate, with 32 households (20.5%) falling below the poverty line. Among the single-parent households, those with 3 or 4 children have the highest poverty rate, with 64 household (71.1%) living below poverty.
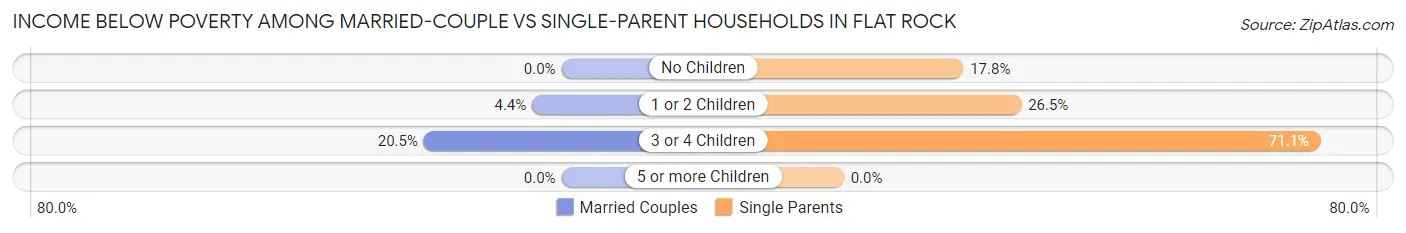
| Children | Married-Couple Families | Single-Parent Households |
| No Children | 0 (0.0%) | 62 (17.8%) |
| 1 or 2 Children | 27 (4.4%) | 155 (26.5%) |
| 3 or 4 Children | 32 (20.5%) | 64 (71.1%) |
| 5 or more Children | 0 (0.0%) | 0 (0.0%) |
| Total | 59 (3.4%) | 281 (27.4%) |
Race in Flat Rock
The most populous races in Flat Rock are White / Caucasian (8,063 | 77.2%), Black / African American (1,167 | 11.2%), and Two or more Races (901 | 8.6%).
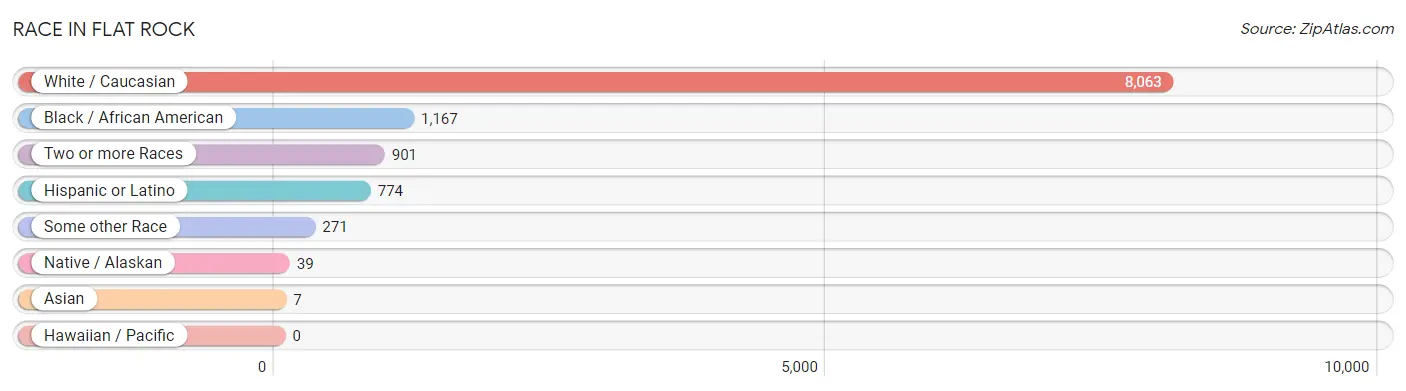
| Race | # Population | % Population |
| Asian | 7 | 0.1% |
| Black / African American | 1,167 | 11.2% |
| Hawaiian / Pacific | 0 | 0.0% |
| Hispanic or Latino | 774 | 7.4% |
| Native / Alaskan | 39 | 0.4% |
| White / Caucasian | 8,063 | 77.2% |
| Two or more Races | 901 | 8.6% |
| Some other Race | 271 | 2.6% |
| Total | 10,448 | 100.0% |
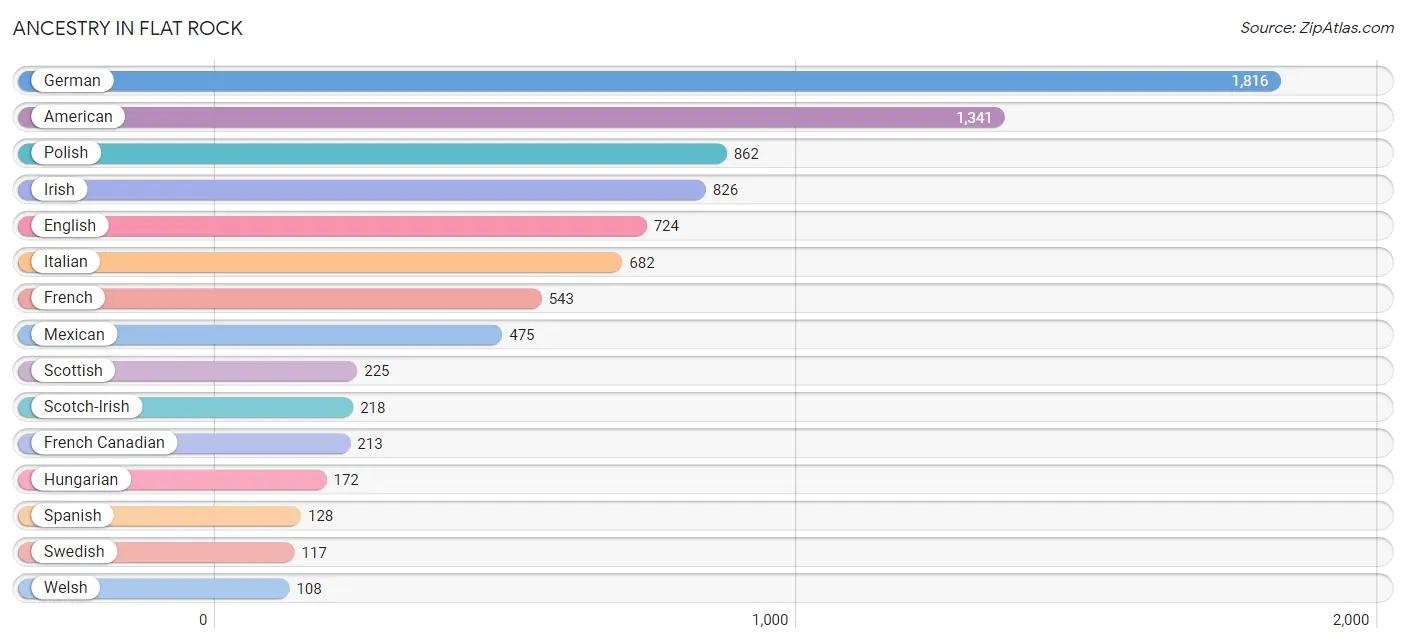
Ancestry in Flat Rock
The most populous ancestries reported in Flat Rock are German (1,816 | 17.4%), American (1,341 | 12.8%), Polish (862 | 8.3%), Irish (826 | 7.9%), and English (724 | 6.9%), together accounting for 53.3% of all Flat Rock residents.
| Ancestry | # Population | % Population |
| African | 2 | 0.0% |
| American | 1,341 | 12.8% |
| Arab | 7 | 0.1% |
| Belgian | 29 | 0.3% |
| Bhutanese | 24 | 0.2% |
| Blackfeet | 17 | 0.2% |
| British | 61 | 0.6% |
| Canadian | 63 | 0.6% |
| Cherokee | 19 | 0.2% |
| Chippewa | 45 | 0.4% |
| Croatian | 50 | 0.5% |
| Czech | 7 | 0.1% |
| Czechoslovakian | 6 | 0.1% |
| Danish | 31 | 0.3% |
| Dutch | 100 | 1.0% |
| Eastern European | 22 | 0.2% |
| English | 724 | 6.9% |
| European | 75 | 0.7% |
| Finnish | 43 | 0.4% |
| French | 543 | 5.2% |
| French Canadian | 213 | 2.0% |
| German | 1,816 | 17.4% |
| German Russian | 6 | 0.1% |
| Greek | 19 | 0.2% |
| Hungarian | 172 | 1.7% |
| Icelander | 29 | 0.3% |
| Irish | 826 | 7.9% |
| Italian | 682 | 6.5% |
| Latvian | 29 | 0.3% |
| Lithuanian | 7 | 0.1% |
| Maltese | 20 | 0.2% |
| Mexican | 475 | 4.5% |
| Norwegian | 35 | 0.3% |
| Polish | 862 | 8.3% |
| Portuguese | 6 | 0.1% |
| Puerto Rican | 75 | 0.7% |
| Romanian | 17 | 0.2% |
| Russian | 54 | 0.5% |
| Scandinavian | 15 | 0.1% |
| Scotch-Irish | 218 | 2.1% |
| Scottish | 225 | 2.1% |
| Serbian | 70 | 0.7% |
| Sioux | 38 | 0.4% |
| Slavic | 8 | 0.1% |
| Slovak | 23 | 0.2% |
| Spaniard | 96 | 0.9% |
| Spanish | 128 | 1.2% |
| Sri Lankan | 20 | 0.2% |
| Subsaharan African | 2 | 0.0% |
| Swedish | 117 | 1.1% |
| Swiss | 16 | 0.2% |
| Syrian | 7 | 0.1% |
| Ukrainian | 80 | 0.8% |
| Welsh | 108 | 1.0% | View All 54 Rows |
Immigrants in Flat Rock
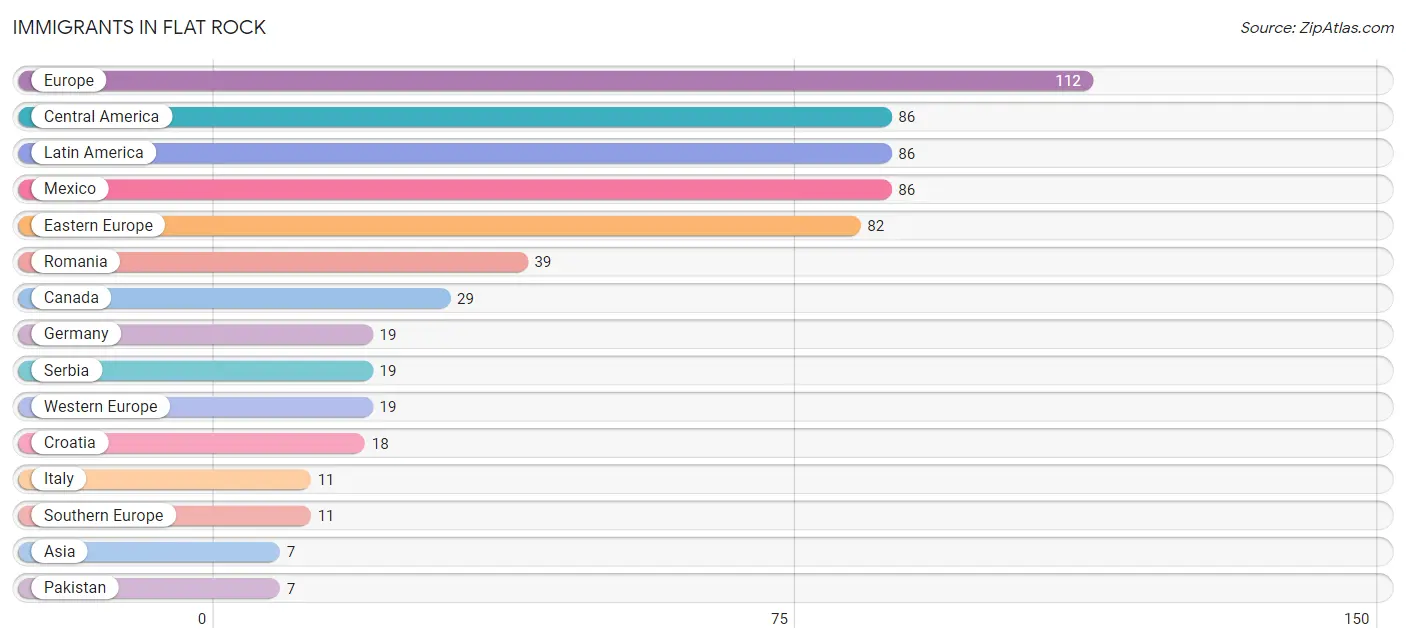
The most numerous immigrant groups reported in Flat Rock came from Europe (112 | 1.1%), Central America (86 | 0.8%), Latin America (86 | 0.8%), Mexico (86 | 0.8%), and Eastern Europe (82 | 0.8%), together accounting for 4.3% of all Flat Rock residents.
| Immigration Origin | # Population | % Population |
| Asia | 7 | 0.1% |
| Canada | 29 | 0.3% |
| Central America | 86 | 0.8% |
| Croatia | 18 | 0.2% |
| Eastern Europe | 82 | 0.8% |
| Europe | 112 | 1.1% |
| Germany | 19 | 0.2% |
| Italy | 11 | 0.1% |
| Latin America | 86 | 0.8% |
| Latvia | 6 | 0.1% |
| Mexico | 86 | 0.8% |
| Pakistan | 7 | 0.1% |
| Romania | 39 | 0.4% |
| Serbia | 19 | 0.2% |
| South Central Asia | 7 | 0.1% |
| Southern Europe | 11 | 0.1% |
| Western Europe | 19 | 0.2% | View All 17 Rows |
Sex and Age in Flat Rock
Sex and Age in Flat Rock
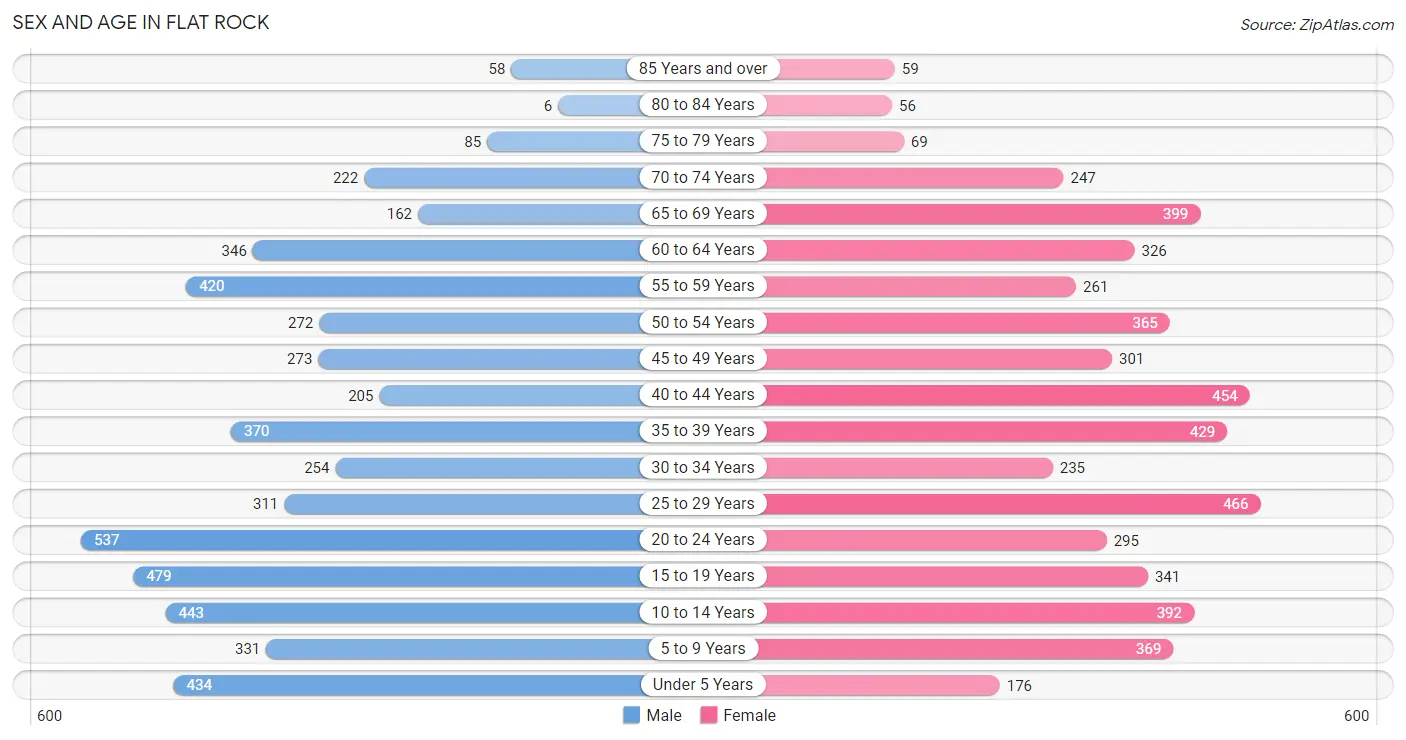
The most populous age groups in Flat Rock are 20 to 24 Years (537 | 10.3%) for men and 25 to 29 Years (466 | 8.9%) for women.
| Age Bracket | Male | Female |
| Under 5 Years | 434 (8.3%) | 176 (3.4%) |
| 5 to 9 Years | 331 (6.4%) | 369 (7.0%) |
| 10 to 14 Years | 443 (8.5%) | 392 (7.5%) |
| 15 to 19 Years | 479 (9.2%) | 341 (6.5%) |
| 20 to 24 Years | 537 (10.3%) | 295 (5.6%) |
| 25 to 29 Years | 311 (6.0%) | 466 (8.9%) |
| 30 to 34 Years | 254 (4.9%) | 235 (4.5%) |
| 35 to 39 Years | 370 (7.1%) | 429 (8.2%) |
| 40 to 44 Years | 205 (3.9%) | 454 (8.7%) |
| 45 to 49 Years | 273 (5.2%) | 301 (5.7%) |
| 50 to 54 Years | 272 (5.2%) | 365 (7.0%) |
| 55 to 59 Years | 420 (8.1%) | 261 (5.0%) |
| 60 to 64 Years | 346 (6.6%) | 326 (6.2%) |
| 65 to 69 Years | 162 (3.1%) | 399 (7.6%) |
| 70 to 74 Years | 222 (4.3%) | 247 (4.7%) |
| 75 to 79 Years | 85 (1.6%) | 69 (1.3%) |
| 80 to 84 Years | 6 (0.1%) | 56 (1.1%) |
| 85 Years and over | 58 (1.1%) | 59 (1.1%) |
| Total | 5,208 (100.0%) | 5,240 (100.0%) |
Families and Households in Flat Rock
Median Family Size in Flat Rock
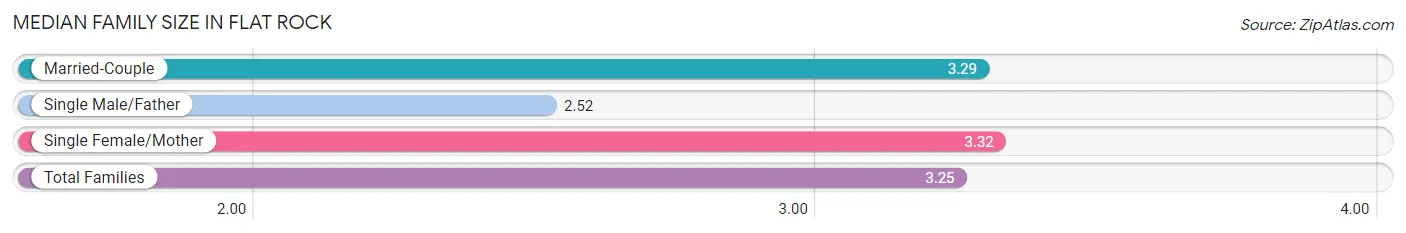
The median family size in Flat Rock is 3.25 persons per family, with single female/mother families (834 | 30.1%) accounting for the largest median family size of 3.32 persons per family. On the other hand, single male/father families (190 | 6.9%) represent the smallest median family size with 2.52 persons per family.
| Family Type | # Families | Family Size |
| Married-Couple | 1,749 (63.1%) | 3.29 |
| Single Male/Father | 190 (6.9%) | 2.52 |
| Single Female/Mother | 834 (30.1%) | 3.32 |
| Total Families | 2,773 (100.0%) | 3.25 |
Median Household Size in Flat Rock
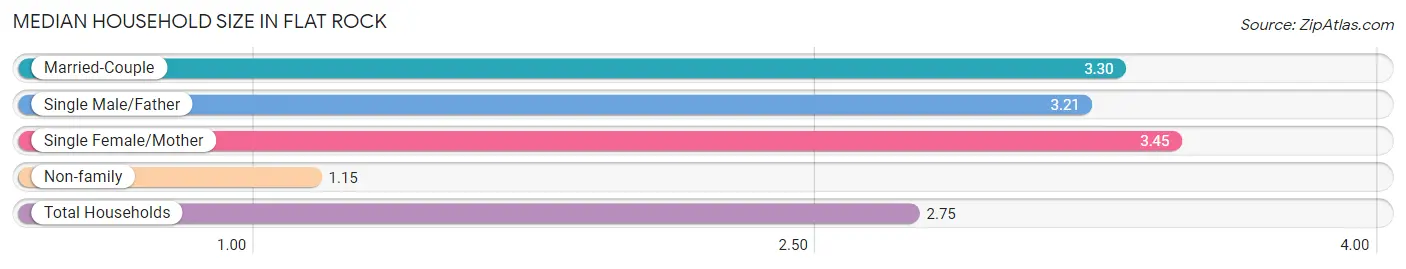
The median household size in Flat Rock is 2.75 persons per household, with single female/mother households (834 | 22.0%) accounting for the largest median household size of 3.45 persons per household. non-family households (1,015 | 26.8%) represent the smallest median household size with 1.15 persons per household.
| Household Type | # Households | Household Size |
| Married-Couple | 1,749 (46.2%) | 3.30 |
| Single Male/Father | 190 (5.0%) | 3.21 |
| Single Female/Mother | 834 (22.0%) | 3.45 |
| Non-family | 1,015 (26.8%) | 1.15 |
| Total Households | 3,788 (100.0%) | 2.75 |
Household Size by Marriage Status in Flat Rock
Out of a total of 3,788 households in Flat Rock, 2,773 (73.2%) are family households, while 1,015 (26.8%) are nonfamily households. The most numerous type of family households are 2-person households, comprising 1,047, and the most common type of nonfamily households are 1-person households, comprising 891.
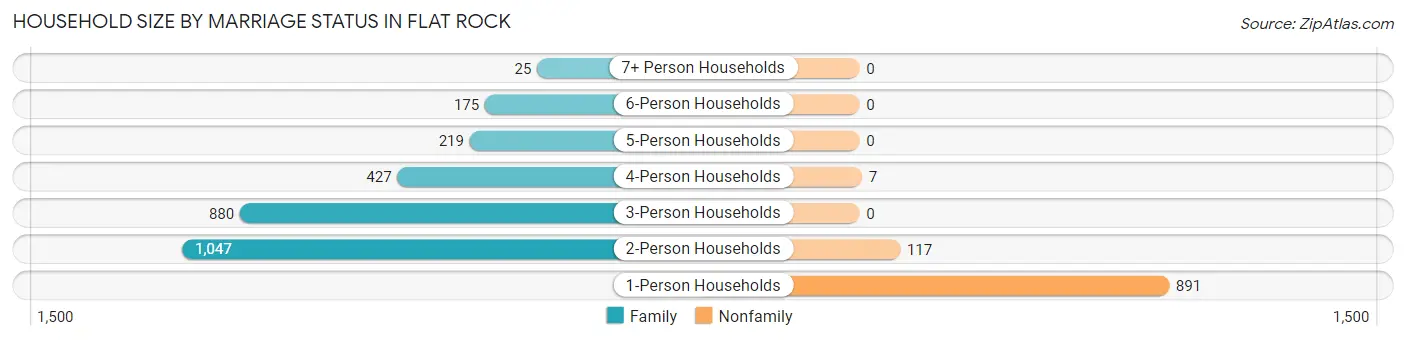
| Household Size | Family Households | Nonfamily Households |
| 1-Person Households | - | 891 (23.5%) |
| 2-Person Households | 1,047 (27.6%) | 117 (3.1%) |
| 3-Person Households | 880 (23.2%) | 0 (0.0%) |
| 4-Person Households | 427 (11.3%) | 7 (0.2%) |
| 5-Person Households | 219 (5.8%) | 0 (0.0%) |
| 6-Person Households | 175 (4.6%) | 0 (0.0%) |
| 7+ Person Households | 25 (0.7%) | 0 (0.0%) |
| Total | 2,773 (73.2%) | 1,015 (26.8%) |
Female Fertility in Flat Rock
Fertility by Age in Flat Rock
Average fertility rate in Flat Rock is 32.0 births per 1,000 women. Women in the age bracket of 20 to 34 years have the highest fertility rate with 67.0 births per 1,000 women. Women in the age bracket of 20 to 34 years acount for 83.8% of all women with births.
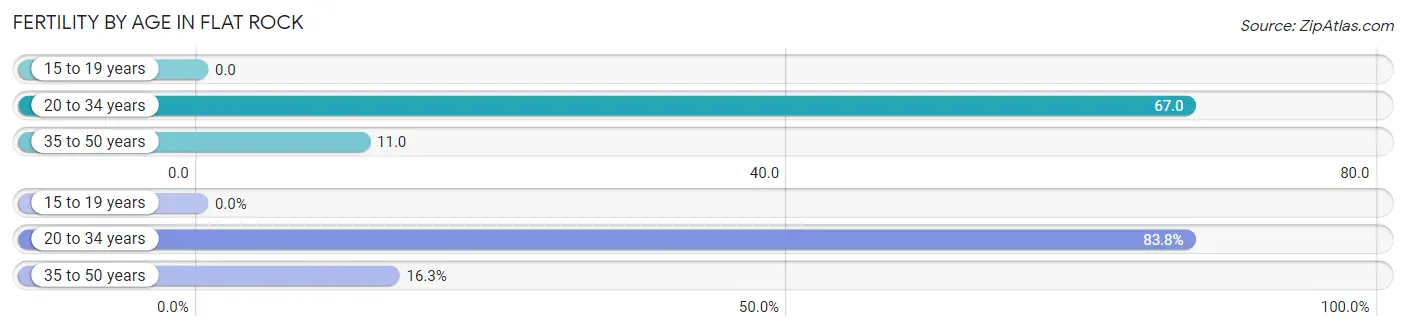
| Age Bracket | Women with Births | Births / 1,000 Women |
| 15 to 19 years | 0 (0.0%) | 0.0 |
| 20 to 34 years | 67 (83.8%) | 67.0 |
| 35 to 50 years | 13 (16.3%) | 11.0 |
| Total | 80 (100.0%) | 32.0 |
Fertility by Age by Marriage Status in Flat Rock
51.2% of women with births (80) in Flat Rock are married. The highest percentage of unmarried women with births falls into 20 to 34 years age bracket with 58.2% of them unmarried at the time of birth, while the lowest percentage of unmarried women with births belong to 35 to 50 years age bracket with 0.0% of them unmarried.
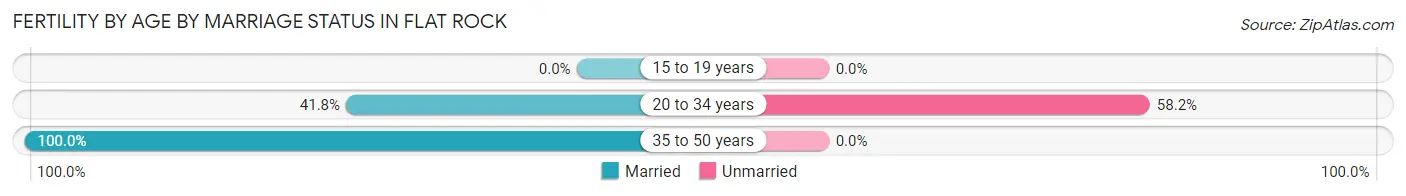
| Age Bracket | Married | Unmarried |
| 15 to 19 years | 0 (0.0%) | 0 (0.0%) |
| 20 to 34 years | 28 (41.8%) | 39 (58.2%) |
| 35 to 50 years | 13 (100.0%) | 0 (0.0%) |
| Total | 41 (51.2%) | 39 (48.7%) |
Fertility by Education in Flat Rock
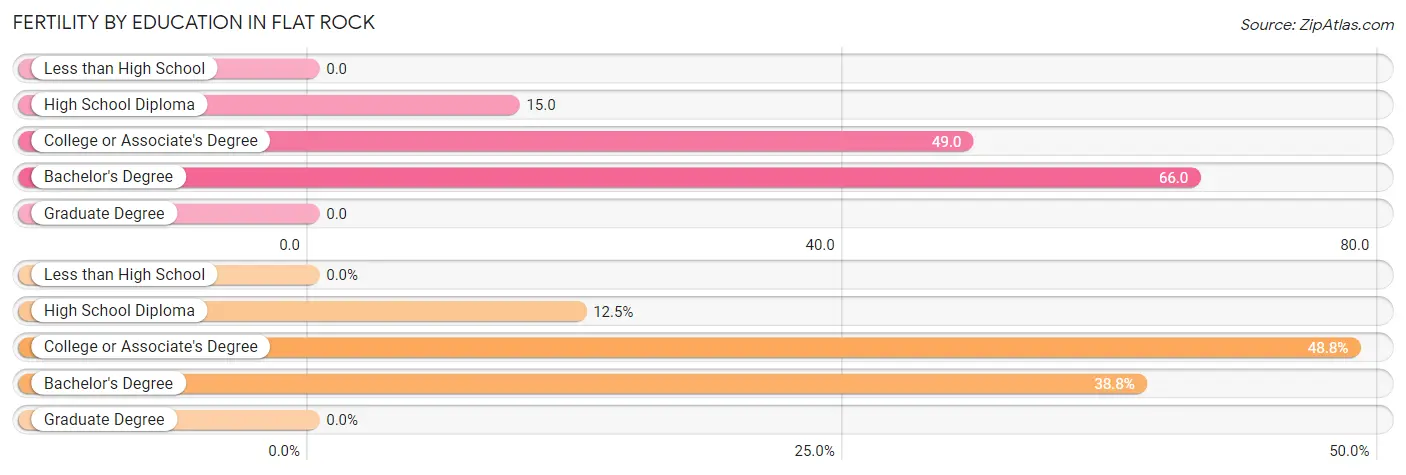
| Educational Attainment | Women with Births | Births / 1,000 Women |
| Less than High School | 0 (0.0%) | 0.0 |
| High School Diploma | 10 (12.5%) | 15.0 |
| College or Associate's Degree | 39 (48.7%) | 49.0 |
| Bachelor's Degree | 31 (38.8%) | 66.0 |
| Graduate Degree | 0 (0.0%) | 0.0 |
| Total | 80 (100.0%) | 32.0 |
Fertility by Education by Marriage Status in Flat Rock
48.7% of women with births in Flat Rock are unmarried. Women with the educational attainment of high school diploma are most likely to be married with 100.0% of them married at childbirth, while women with the educational attainment of college or associate's degree are least likely to be married with 100.0% of them unmarried at childbirth.
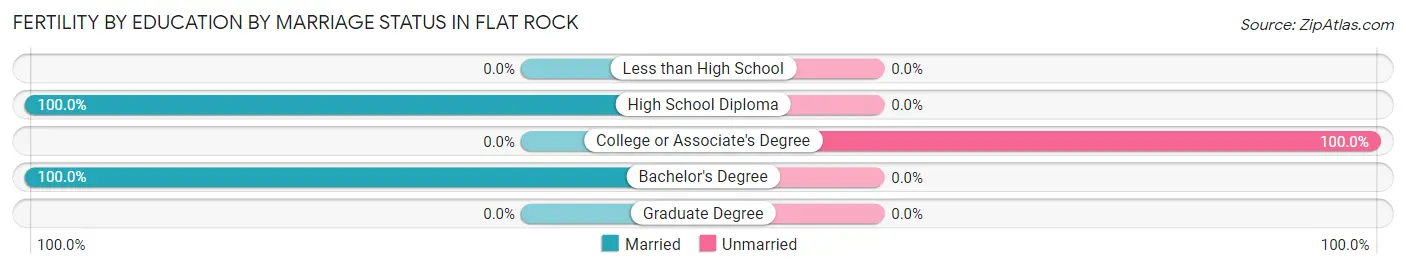
| Educational Attainment | Married | Unmarried |
| Less than High School | 0 (0.0%) | 0 (0.0%) |
| High School Diploma | 10 (100.0%) | 0 (0.0%) |
| College or Associate's Degree | 0 (0.0%) | 39 (100.0%) |
| Bachelor's Degree | 31 (100.0%) | 0 (0.0%) |
| Graduate Degree | 0 (0.0%) | 0 (0.0%) |
| Total | 41 (51.2%) | 39 (48.7%) |
Employment Characteristics in Flat Rock
Employment by Class of Employer in Flat Rock
Among the 4,802 employed individuals in Flat Rock, private company employees (3,767 | 78.4%), not-for-profit organizations (332 | 6.9%), and state government employees (211 | 4.4%) make up the most common classes of employment.
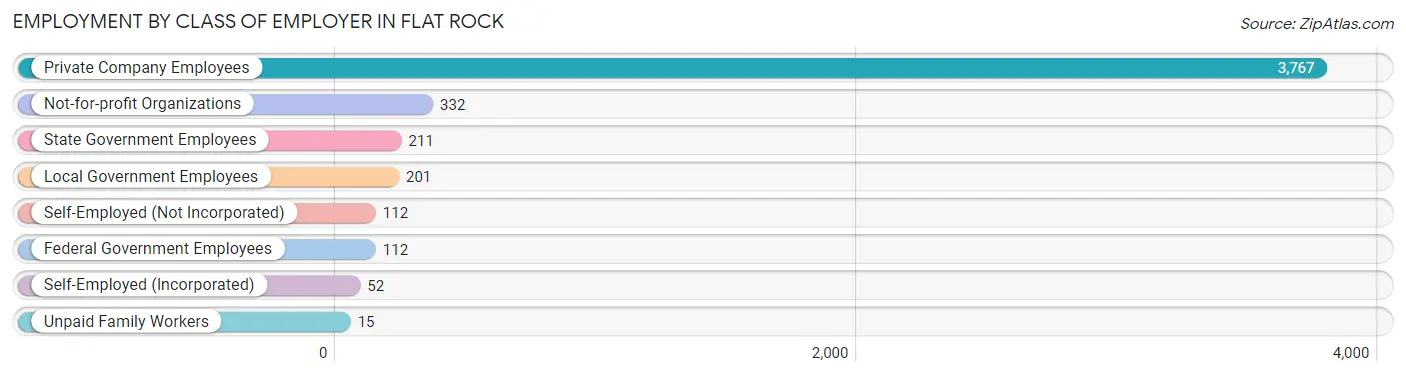
| Employer Class | # Employees | % Employees |
| Private Company Employees | 3,767 | 78.4% |
| Self-Employed (Incorporated) | 52 | 1.1% |
| Self-Employed (Not Incorporated) | 112 | 2.3% |
| Not-for-profit Organizations | 332 | 6.9% |
| Local Government Employees | 201 | 4.2% |
| State Government Employees | 211 | 4.4% |
| Federal Government Employees | 112 | 2.3% |
| Unpaid Family Workers | 15 | 0.3% |
| Total | 4,802 | 100.0% |
Employment Status by Age in Flat Rock
According to the labor force statistics for Flat Rock, out of the total population over 16 years of age (8,064), 64.9% or 5,234 individuals are in the labor force, with 7.6% or 398 of them unemployed. The age group with the highest labor force participation rate is 20 to 24 years, with 94.5% or 786 individuals in the labor force. Within the labor force, the 16 to 19 years age range has the highest percentage of unemployed individuals, with 38.6% or 71 of them being unemployed.
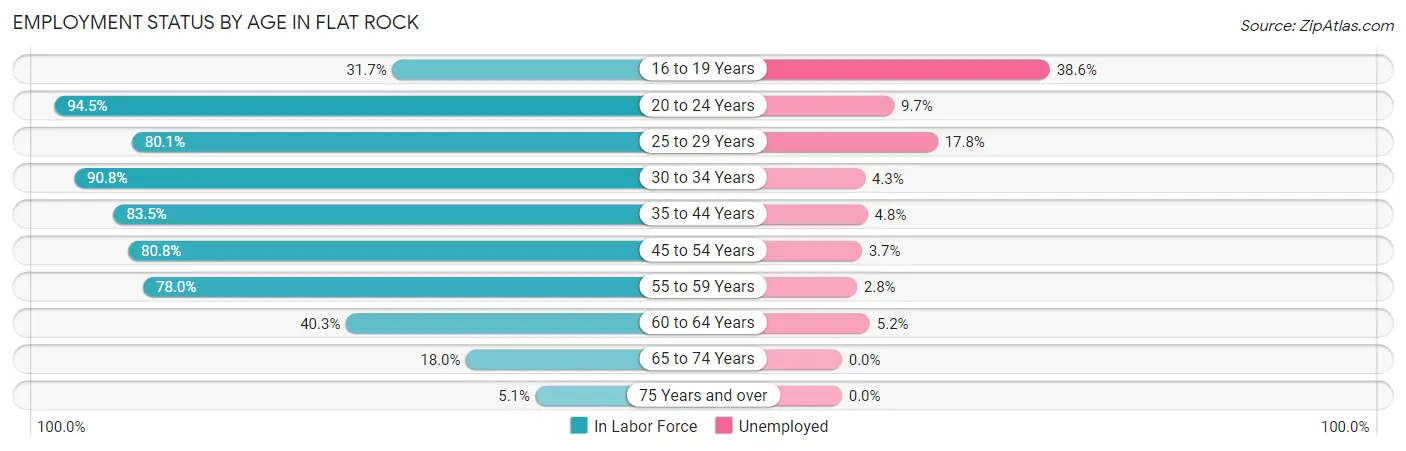
| Age Bracket | In Labor Force | Unemployed |
| 16 to 19 Years | 184 (31.7%) | 71 (38.6%) |
| 20 to 24 Years | 786 (94.5%) | 76 (9.7%) |
| 25 to 29 Years | 622 (80.1%) | 111 (17.8%) |
| 30 to 34 Years | 444 (90.8%) | 19 (4.3%) |
| 35 to 44 Years | 1,217 (83.5%) | 58 (4.8%) |
| 45 to 54 Years | 978 (80.8%) | 36 (3.7%) |
| 55 to 59 Years | 531 (78.0%) | 15 (2.8%) |
| 60 to 64 Years | 271 (40.3%) | 14 (5.2%) |
| 65 to 74 Years | 185 (18.0%) | 0 (0.0%) |
| 75 Years and over | 17 (5.1%) | 0 (0.0%) |
| Total | 5,234 (64.9%) | 398 (7.6%) |
Employment Status by Educational Attainment in Flat Rock
According to labor force statistics for Flat Rock, 76.8% of individuals (4,061) out of the total population between 25 and 64 years of age (5,288) are in the labor force, with 6.2% or 252 of them being unemployed. The group with the highest labor force participation rate are those with the educational attainment of bachelor's degree or higher, with 93.7% or 1,047 individuals in the labor force. Within the labor force, individuals with less than high school education have the highest percentage of unemployment, with 28.5% or 82 of them being unemployed.
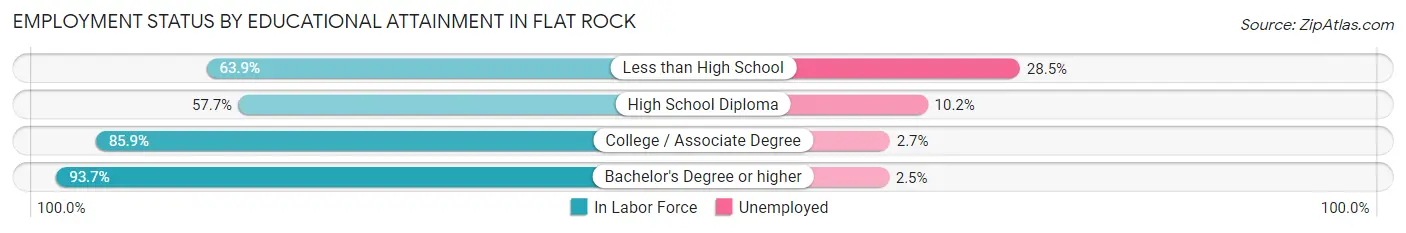
| Educational Attainment | In Labor Force | Unemployed |
| Less than High School | 288 (63.9%) | 129 (28.5%) |
| High School Diploma | 956 (57.7%) | 169 (10.2%) |
| College / Associate Degree | 1,773 (85.9%) | 56 (2.7%) |
| Bachelor's Degree or higher | 1,047 (93.7%) | 28 (2.5%) |
| Total | 4,061 (76.8%) | 328 (6.2%) |
Employment Occupations by Sex in Flat Rock
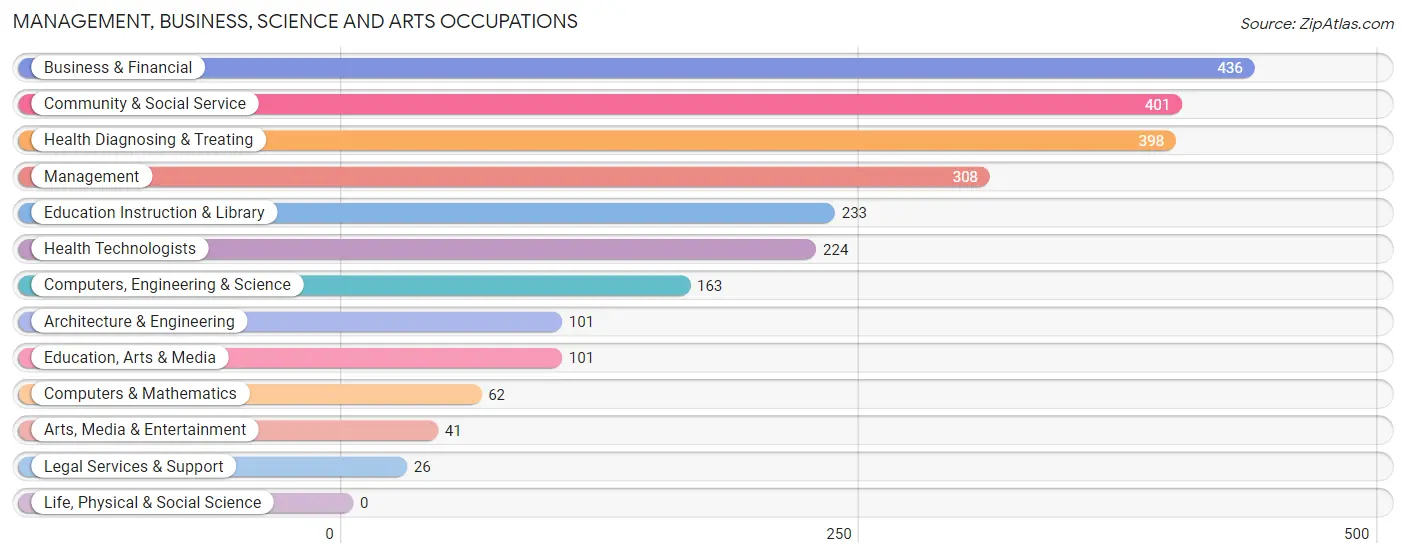
Management, Business, Science and Arts Occupations
The most common Management, Business, Science and Arts occupations in Flat Rock are Business & Financial (436 | 9.0%), Community & Social Service (401 | 8.3%), Health Diagnosing & Treating (398 | 8.2%), Management (308 | 6.4%), and Education Instruction & Library (233 | 4.8%).
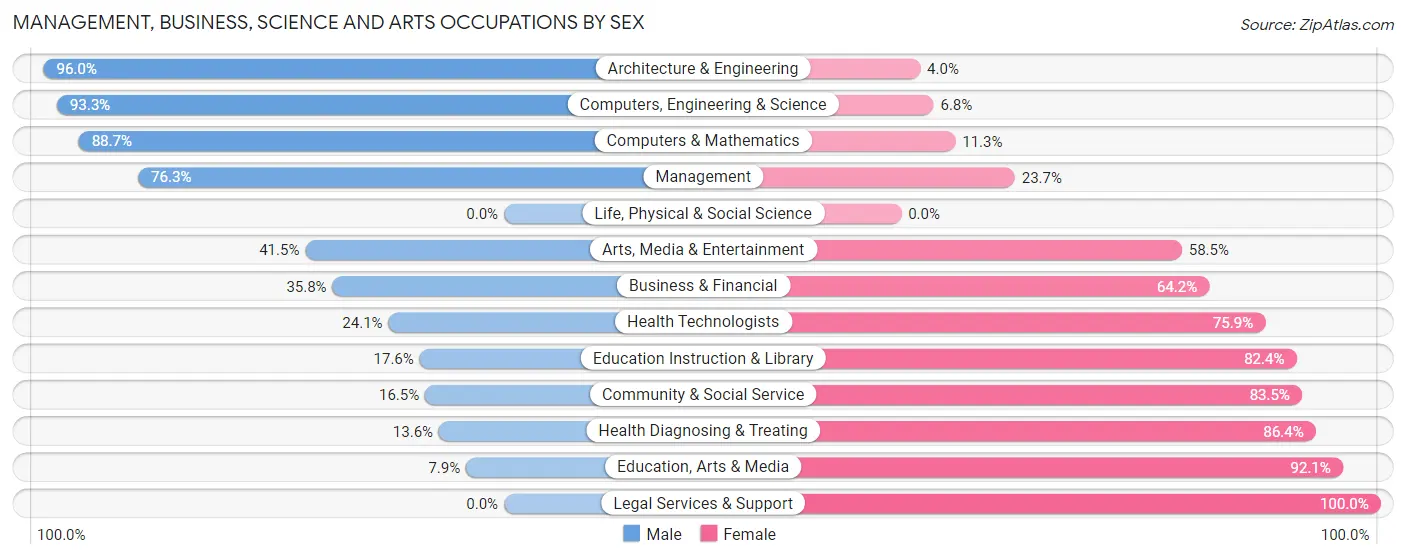
Management, Business, Science and Arts Occupations by Sex
Within the Management, Business, Science and Arts occupations in Flat Rock, the most male-oriented occupations are Architecture & Engineering (96.0%), Computers, Engineering & Science (93.2%), and Computers & Mathematics (88.7%), while the most female-oriented occupations are Legal Services & Support (100.0%), Education, Arts & Media (92.1%), and Health Diagnosing & Treating (86.4%).
| Occupation | Male | Female |
| Management | 235 (76.3%) | 73 (23.7%) |
| Business & Financial | 156 (35.8%) | 280 (64.2%) |
| Computers, Engineering & Science | 152 (93.2%) | 11 (6.8%) |
| Computers & Mathematics | 55 (88.7%) | 7 (11.3%) |
| Architecture & Engineering | 97 (96.0%) | 4 (4.0%) |
| Life, Physical & Social Science | 0 (0.0%) | 0 (0.0%) |
| Community & Social Service | 66 (16.5%) | 335 (83.5%) |
| Education, Arts & Media | 8 (7.9%) | 93 (92.1%) |
| Legal Services & Support | 0 (0.0%) | 26 (100.0%) |
| Education Instruction & Library | 41 (17.6%) | 192 (82.4%) |
| Arts, Media & Entertainment | 17 (41.5%) | 24 (58.5%) |
| Health Diagnosing & Treating | 54 (13.6%) | 344 (86.4%) |
| Health Technologists | 54 (24.1%) | 170 (75.9%) |
| Total (Category) | 663 (38.9%) | 1,043 (61.1%) |
| Total (Overall) | 2,502 (51.7%) | 2,333 (48.2%) |
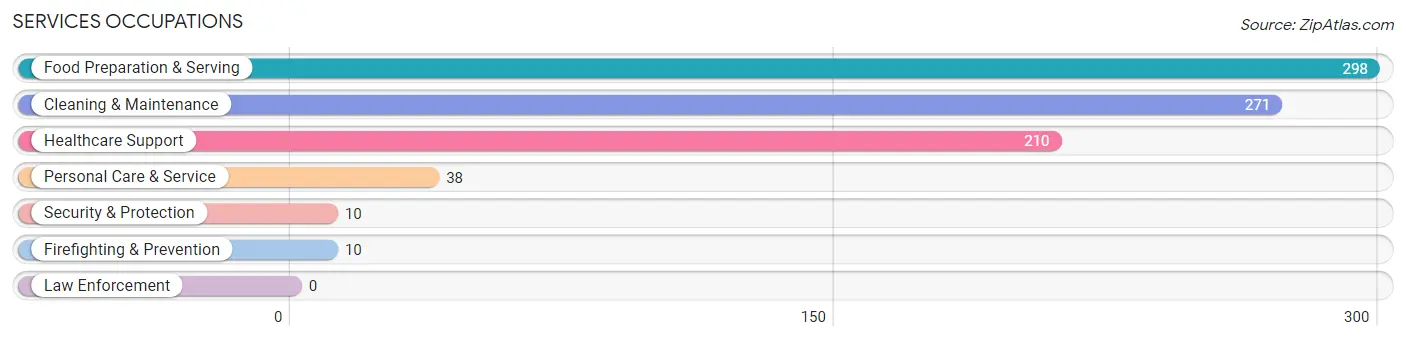
Services Occupations
The most common Services occupations in Flat Rock are Food Preparation & Serving (298 | 6.2%), Cleaning & Maintenance (271 | 5.6%), Healthcare Support (210 | 4.3%), Personal Care & Service (38 | 0.8%), and Security & Protection (10 | 0.2%).
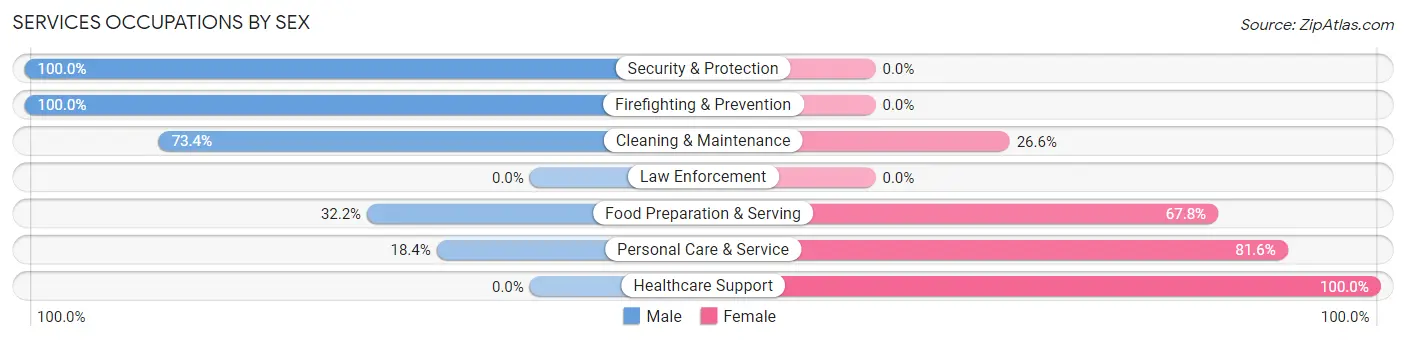
Services Occupations by Sex
Within the Services occupations in Flat Rock, the most male-oriented occupations are Security & Protection (100.0%), Firefighting & Prevention (100.0%), and Cleaning & Maintenance (73.4%), while the most female-oriented occupations are Healthcare Support (100.0%), Personal Care & Service (81.6%), and Food Preparation & Serving (67.8%).
| Occupation | Male | Female |
| Healthcare Support | 0 (0.0%) | 210 (100.0%) |
| Security & Protection | 10 (100.0%) | 0 (0.0%) |
| Firefighting & Prevention | 10 (100.0%) | 0 (0.0%) |
| Law Enforcement | 0 (0.0%) | 0 (0.0%) |
| Food Preparation & Serving | 96 (32.2%) | 202 (67.8%) |
| Cleaning & Maintenance | 199 (73.4%) | 72 (26.6%) |
| Personal Care & Service | 7 (18.4%) | 31 (81.6%) |
| Total (Category) | 312 (37.7%) | 515 (62.3%) |
| Total (Overall) | 2,502 (51.7%) | 2,333 (48.2%) |
Sales and Office Occupations
The most common Sales and Office occupations in Flat Rock are Sales & Related (567 | 11.7%), and Office & Administration (437 | 9.0%).
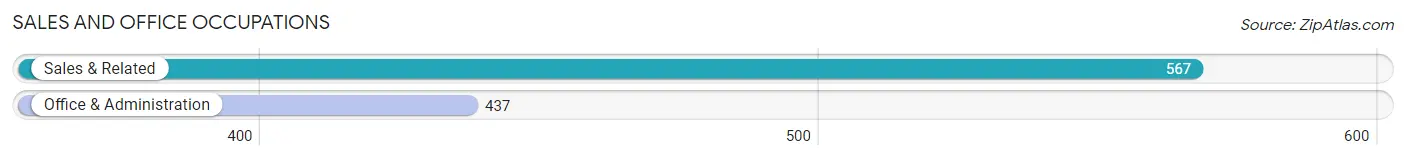
Sales and Office Occupations by Sex
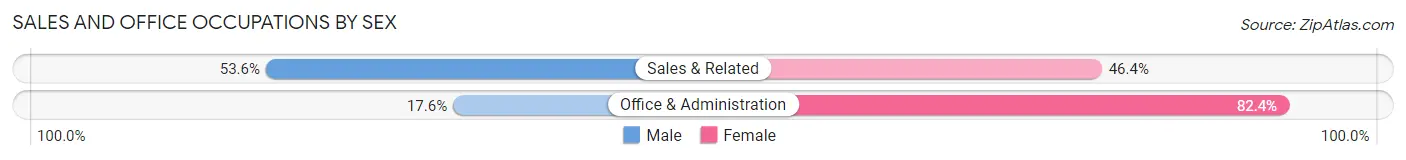
| Occupation | Male | Female |
| Sales & Related | 304 (53.6%) | 263 (46.4%) |
| Office & Administration | 77 (17.6%) | 360 (82.4%) |
| Total (Category) | 381 (38.0%) | 623 (62.1%) |
| Total (Overall) | 2,502 (51.7%) | 2,333 (48.2%) |
Natural Resources, Construction and Maintenance Occupations
The most common Natural Resources, Construction and Maintenance occupations in Flat Rock are Installation, Maintenance & Repair (169 | 3.5%), and Construction & Extraction (132 | 2.7%).
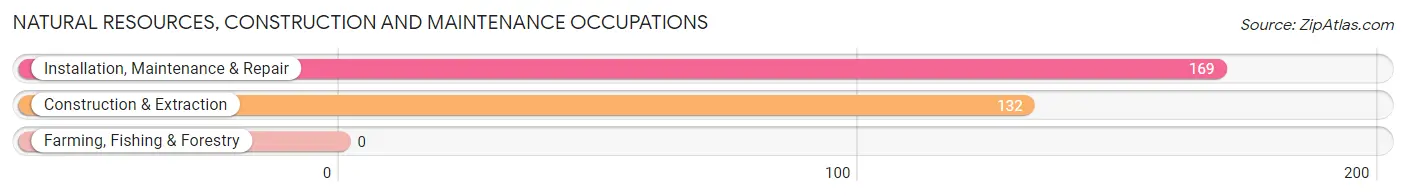
Natural Resources, Construction and Maintenance Occupations by Sex
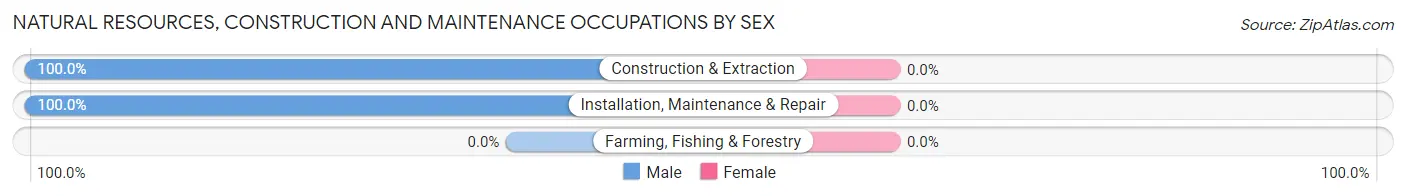
| Occupation | Male | Female |
| Farming, Fishing & Forestry | 0 (0.0%) | 0 (0.0%) |
| Construction & Extraction | 132 (100.0%) | 0 (0.0%) |
| Installation, Maintenance & Repair | 169 (100.0%) | 0 (0.0%) |
| Total (Category) | 301 (100.0%) | 0 (0.0%) |
| Total (Overall) | 2,502 (51.7%) | 2,333 (48.2%) |
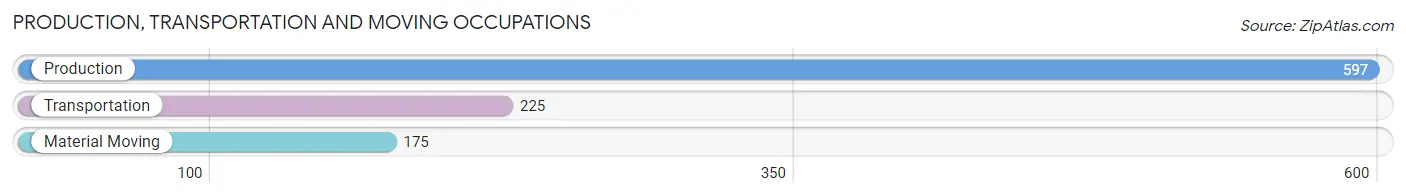
Production, Transportation and Moving Occupations
The most common Production, Transportation and Moving occupations in Flat Rock are Production (597 | 12.3%), Transportation (225 | 4.6%), and Material Moving (175 | 3.6%).
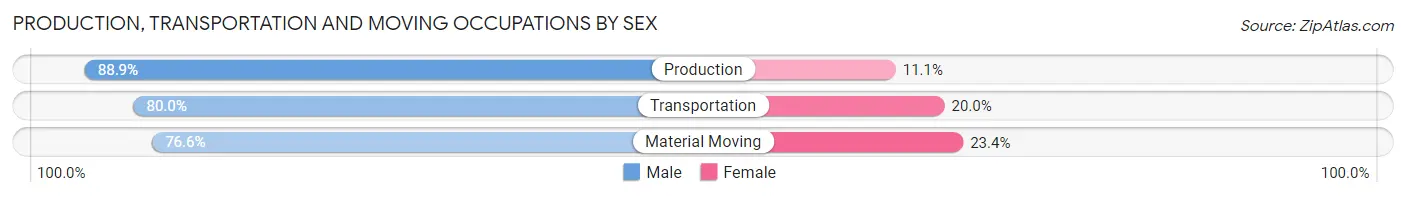
Production, Transportation and Moving Occupations by Sex
| Occupation | Male | Female |
| Production | 531 (88.9%) | 66 (11.1%) |
| Transportation | 180 (80.0%) | 45 (20.0%) |
| Material Moving | 134 (76.6%) | 41 (23.4%) |
| Total (Category) | 845 (84.8%) | 152 (15.2%) |
| Total (Overall) | 2,502 (51.7%) | 2,333 (48.2%) |
Employment Industries by Sex in Flat Rock
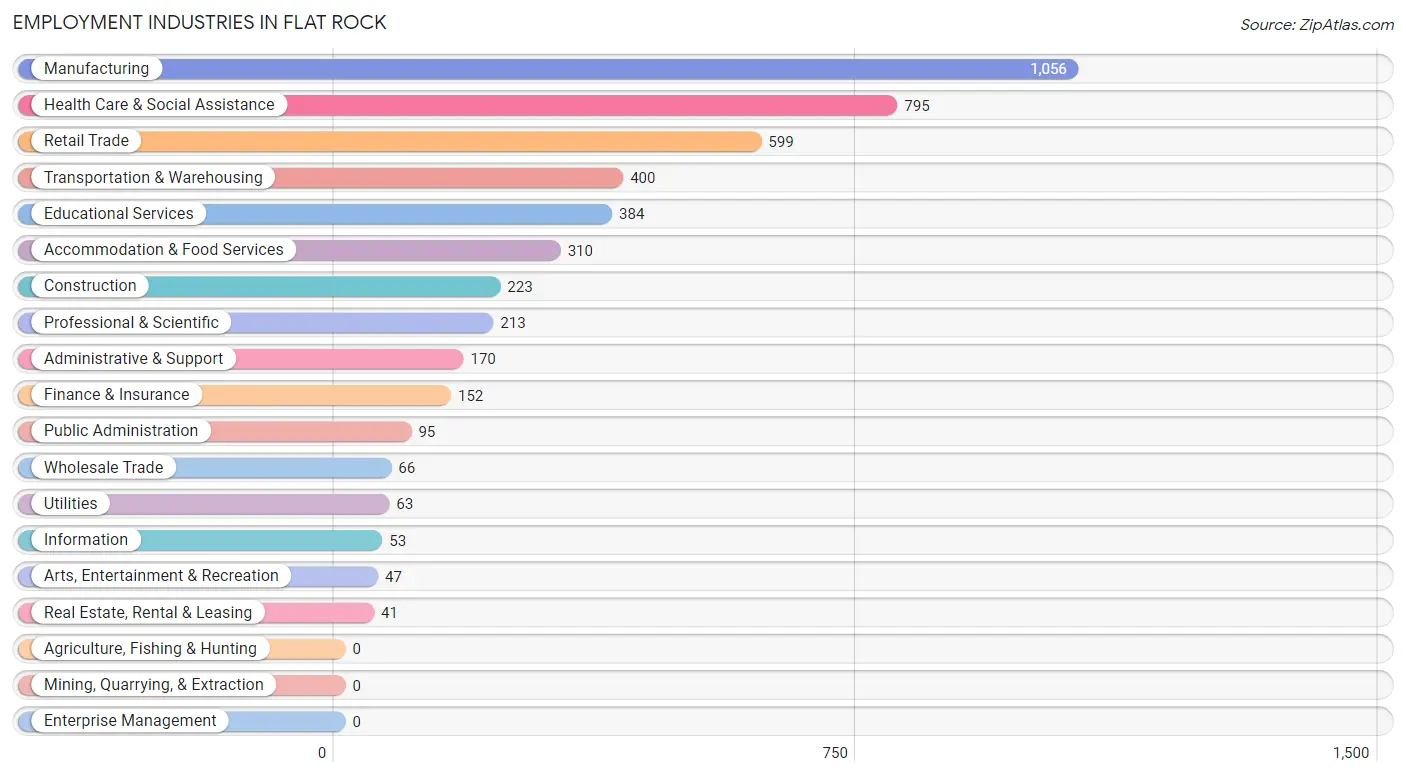
Employment Industries in Flat Rock
The major employment industries in Flat Rock include Manufacturing (1,056 | 21.8%), Health Care & Social Assistance (795 | 16.4%), Retail Trade (599 | 12.4%), Transportation & Warehousing (400 | 8.3%), and Educational Services (384 | 7.9%).
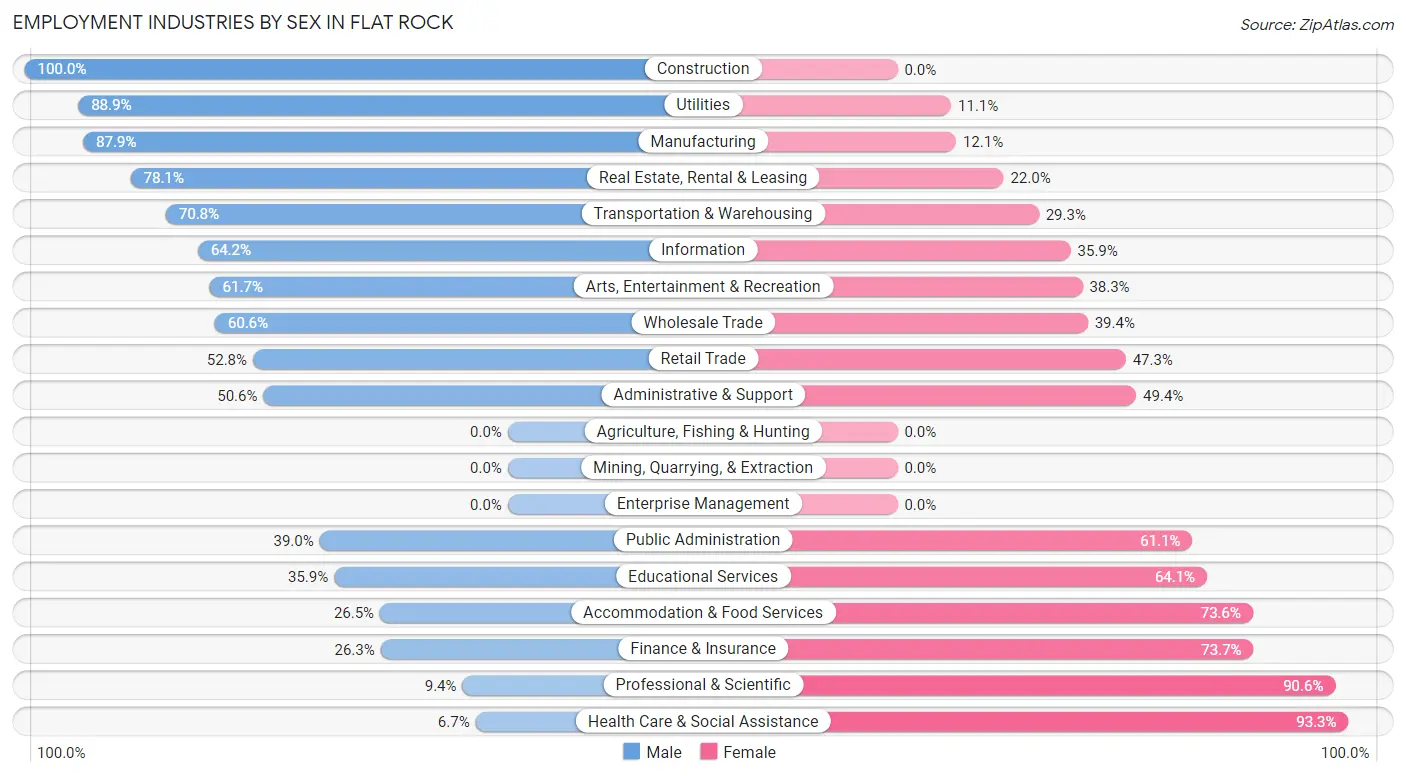
Employment Industries by Sex in Flat Rock
The Flat Rock industries that see more men than women are Construction (100.0%), Utilities (88.9%), and Manufacturing (87.9%), whereas the industries that tend to have a higher number of women are Health Care & Social Assistance (93.3%), Professional & Scientific (90.6%), and Finance & Insurance (73.7%).
| Industry | Male | Female |
| Agriculture, Fishing & Hunting | 0 (0.0%) | 0 (0.0%) |
| Mining, Quarrying, & Extraction | 0 (0.0%) | 0 (0.0%) |
| Construction | 223 (100.0%) | 0 (0.0%) |
| Manufacturing | 928 (87.9%) | 128 (12.1%) |
| Wholesale Trade | 40 (60.6%) | 26 (39.4%) |
| Retail Trade | 316 (52.7%) | 283 (47.2%) |
| Transportation & Warehousing | 283 (70.8%) | 117 (29.2%) |
| Utilities | 56 (88.9%) | 7 (11.1%) |
| Information | 34 (64.1%) | 19 (35.8%) |
| Finance & Insurance | 40 (26.3%) | 112 (73.7%) |
| Real Estate, Rental & Leasing | 32 (78.0%) | 9 (22.0%) |
| Professional & Scientific | 20 (9.4%) | 193 (90.6%) |
| Enterprise Management | 0 (0.0%) | 0 (0.0%) |
| Administrative & Support | 86 (50.6%) | 84 (49.4%) |
| Educational Services | 138 (35.9%) | 246 (64.1%) |
| Health Care & Social Assistance | 53 (6.7%) | 742 (93.3%) |
| Arts, Entertainment & Recreation | 29 (61.7%) | 18 (38.3%) |
| Accommodation & Food Services | 82 (26.5%) | 228 (73.6%) |
| Public Administration | 37 (39.0%) | 58 (61.1%) |
| Total | 2,502 (51.7%) | 2,333 (48.2%) |
Education in Flat Rock
School Enrollment in Flat Rock
The most common levels of schooling among the 2,921 students in Flat Rock are high school (741 | 25.4%), middle school (703 | 24.1%), and college / undergraduate (635 | 21.7%).
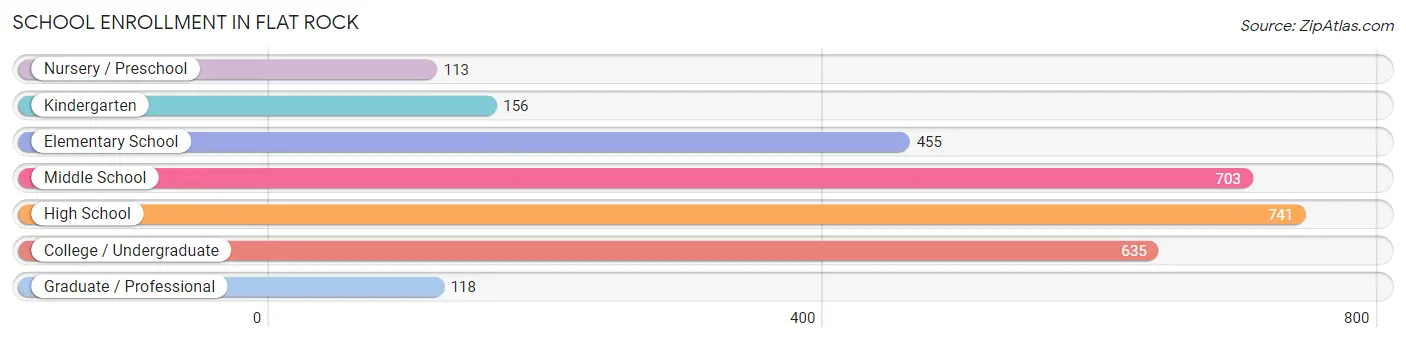
| School Level | # Students | % Students |
| Nursery / Preschool | 113 | 3.9% |
| Kindergarten | 156 | 5.3% |
| Elementary School | 455 | 15.6% |
| Middle School | 703 | 24.1% |
| High School | 741 | 25.4% |
| College / Undergraduate | 635 | 21.7% |
| Graduate / Professional | 118 | 4.0% |
| Total | 2,921 | 100.0% |
School Enrollment by Age by Funding Source in Flat Rock
Out of a total of 2,921 students who are enrolled in schools in Flat Rock, 318 (10.9%) attend a private institution, while the remaining 2,603 (89.1%) are enrolled in public schools. The age group of 3 to 4 year olds has the highest likelihood of being enrolled in private schools, with 29 (59.2% in the age bracket) enrolled. Conversely, the age group of 10 to 14 year olds has the lowest likelihood of being enrolled in a private school, with 825 (98.8% in the age bracket) attending a public institution.
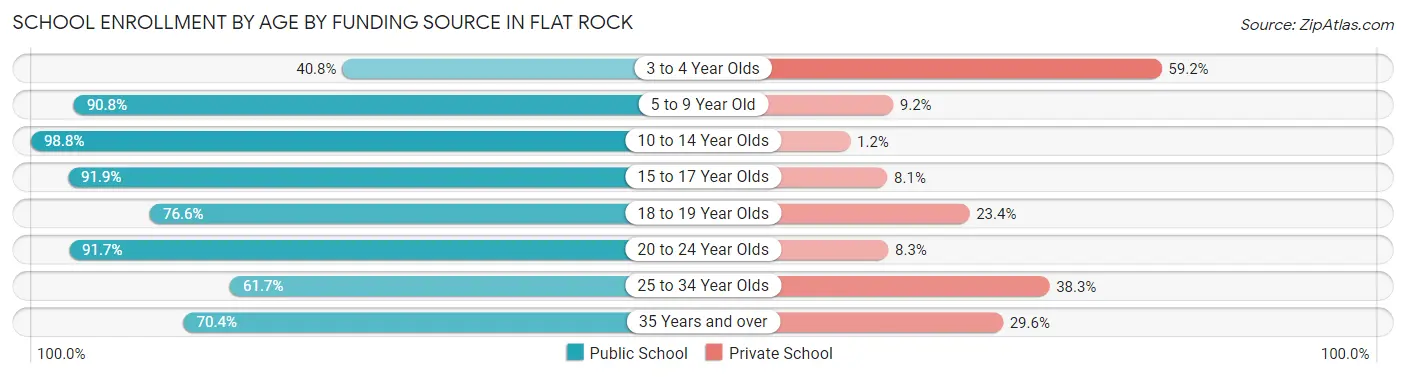
| Age Bracket | Public School | Private School |
| 3 to 4 Year Olds | 20 (40.8%) | 29 (59.2%) |
| 5 to 9 Year Old | 575 (90.8%) | 58 (9.2%) |
| 10 to 14 Year Olds | 825 (98.8%) | 10 (1.2%) |
| 15 to 17 Year Olds | 556 (91.9%) | 49 (8.1%) |
| 18 to 19 Year Olds | 131 (76.6%) | 40 (23.4%) |
| 20 to 24 Year Olds | 310 (91.7%) | 28 (8.3%) |
| 25 to 34 Year Olds | 129 (61.7%) | 80 (38.3%) |
| 35 Years and over | 57 (70.4%) | 24 (29.6%) |
| Total | 2,603 (89.1%) | 318 (10.9%) |
Educational Attainment by Field of Study in Flat Rock
Business (311 | 22.5%), science & technology (200 | 14.4%), education (176 | 12.7%), literature & languages (139 | 10.0%), and engineering (118 | 8.5%) are the most common fields of study among 1,384 individuals in Flat Rock who have obtained a bachelor's degree or higher.
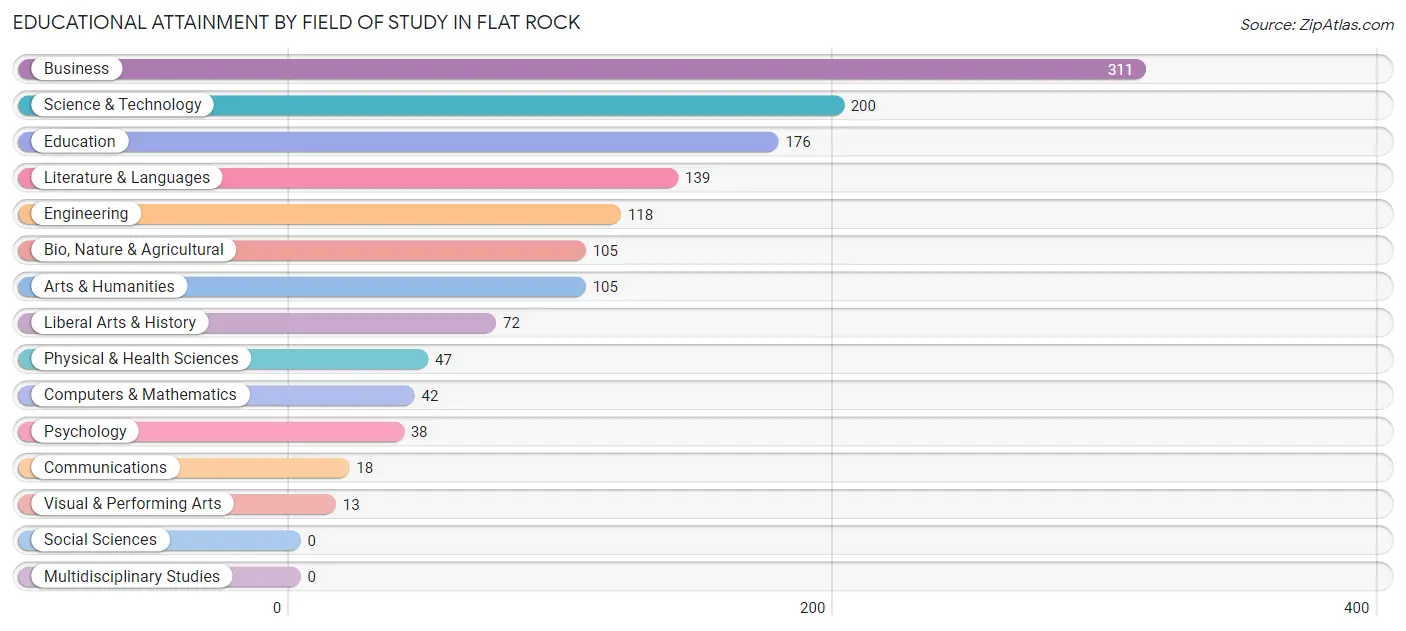
| Field of Study | # Graduates | % Graduates |
| Computers & Mathematics | 42 | 3.0% |
| Bio, Nature & Agricultural | 105 | 7.6% |
| Physical & Health Sciences | 47 | 3.4% |
| Psychology | 38 | 2.8% |
| Social Sciences | 0 | 0.0% |
| Engineering | 118 | 8.5% |
| Multidisciplinary Studies | 0 | 0.0% |
| Science & Technology | 200 | 14.4% |
| Business | 311 | 22.5% |
| Education | 176 | 12.7% |
| Literature & Languages | 139 | 10.0% |
| Liberal Arts & History | 72 | 5.2% |
| Visual & Performing Arts | 13 | 0.9% |
| Communications | 18 | 1.3% |
| Arts & Humanities | 105 | 7.6% |
| Total | 1,384 | 100.0% |
Transportation & Commute in Flat Rock
Vehicle Availability by Sex in Flat Rock
The most prevalent vehicle ownership categories in Flat Rock are males with 2 vehicles (849, accounting for 33.9%) and females with 2 vehicles (917, making up 36.9%).
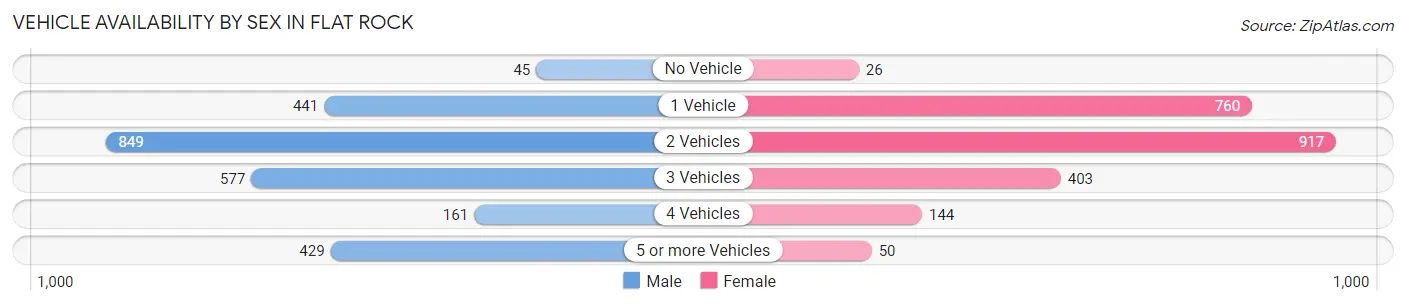
| Vehicles Available | Male | Female |
| No Vehicle | 45 (1.8%) | 26 (1.1%) |
| 1 Vehicle | 441 (17.6%) | 760 (33.0%) |
| 2 Vehicles | 849 (33.9%) | 917 (39.9%) |
| 3 Vehicles | 577 (23.1%) | 403 (17.5%) |
| 4 Vehicles | 161 (6.4%) | 144 (6.3%) |
| 5 or more Vehicles | 429 (17.2%) | 50 (2.2%) |
| Total | 2,502 (100.0%) | 2,300 (100.0%) |
Commute Time in Flat Rock
The most frequently occuring commute durations in Flat Rock are 20 to 24 minutes (607 commuters, 13.7%), 30 to 34 minutes (593 commuters, 13.4%), and 25 to 29 minutes (532 commuters, 12.0%).
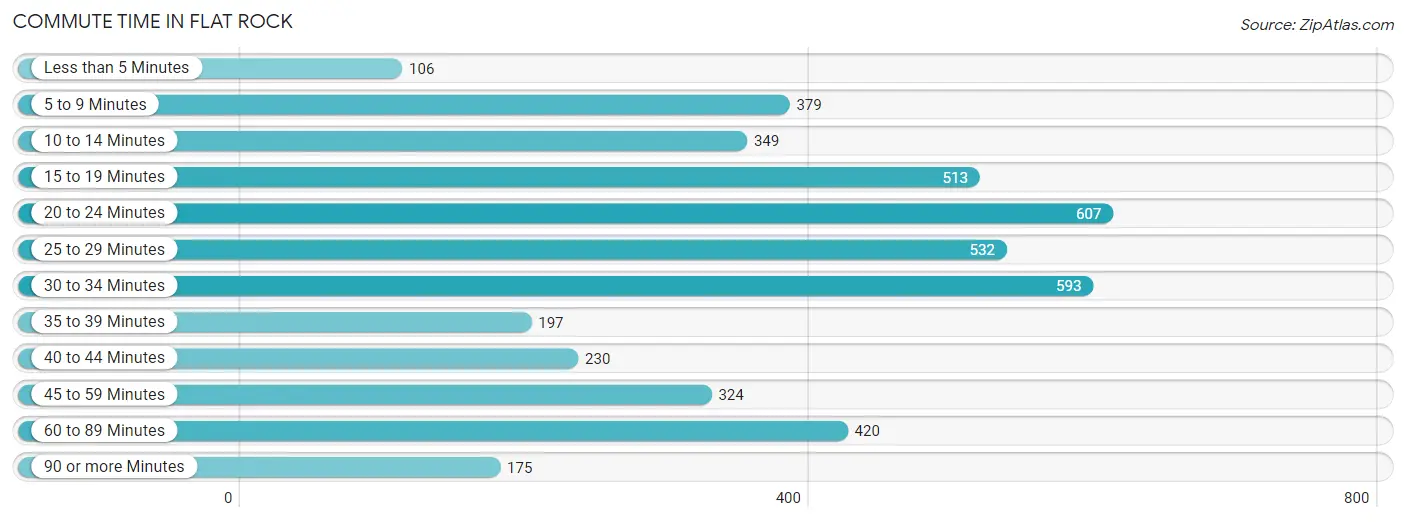
| Commute Time | # Commuters | % Commuters |
| Less than 5 Minutes | 106 | 2.4% |
| 5 to 9 Minutes | 379 | 8.6% |
| 10 to 14 Minutes | 349 | 7.9% |
| 15 to 19 Minutes | 513 | 11.6% |
| 20 to 24 Minutes | 607 | 13.7% |
| 25 to 29 Minutes | 532 | 12.0% |
| 30 to 34 Minutes | 593 | 13.4% |
| 35 to 39 Minutes | 197 | 4.4% |
| 40 to 44 Minutes | 230 | 5.2% |
| 45 to 59 Minutes | 324 | 7.3% |
| 60 to 89 Minutes | 420 | 9.5% |
| 90 or more Minutes | 175 | 4.0% |
Commute Time by Sex in Flat Rock
The most common commute times in Flat Rock are 25 to 29 minutes (350 commuters, 15.5%) for males and 15 to 19 minutes (315 commuters, 14.5%) for females.
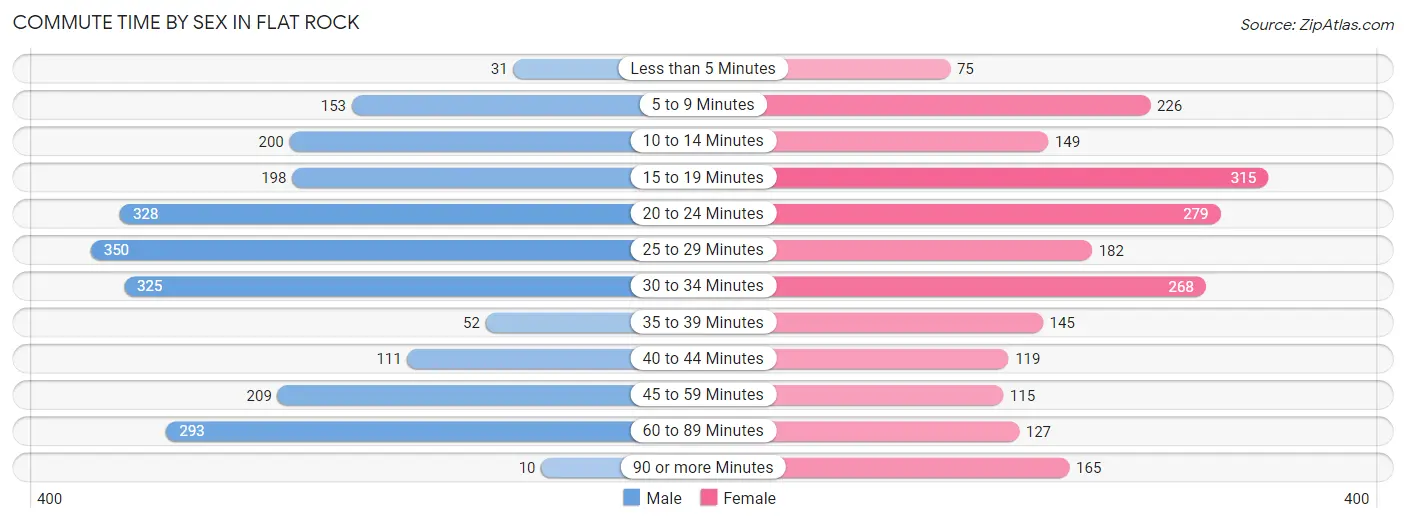
| Commute Time | Male | Female |
| Less than 5 Minutes | 31 (1.4%) | 75 (3.5%) |
| 5 to 9 Minutes | 153 (6.8%) | 226 (10.4%) |
| 10 to 14 Minutes | 200 (8.8%) | 149 (6.9%) |
| 15 to 19 Minutes | 198 (8.8%) | 315 (14.5%) |
| 20 to 24 Minutes | 328 (14.5%) | 279 (12.9%) |
| 25 to 29 Minutes | 350 (15.5%) | 182 (8.4%) |
| 30 to 34 Minutes | 325 (14.4%) | 268 (12.4%) |
| 35 to 39 Minutes | 52 (2.3%) | 145 (6.7%) |
| 40 to 44 Minutes | 111 (4.9%) | 119 (5.5%) |
| 45 to 59 Minutes | 209 (9.2%) | 115 (5.3%) |
| 60 to 89 Minutes | 293 (13.0%) | 127 (5.9%) |
| 90 or more Minutes | 10 (0.4%) | 165 (7.6%) |
Time of Departure to Work by Sex in Flat Rock
The most frequent times of departure to work in Flat Rock are 7:00 AM to 7:29 AM (465, 20.6%) for males and 7:00 AM to 7:29 AM (362, 16.7%) for females.
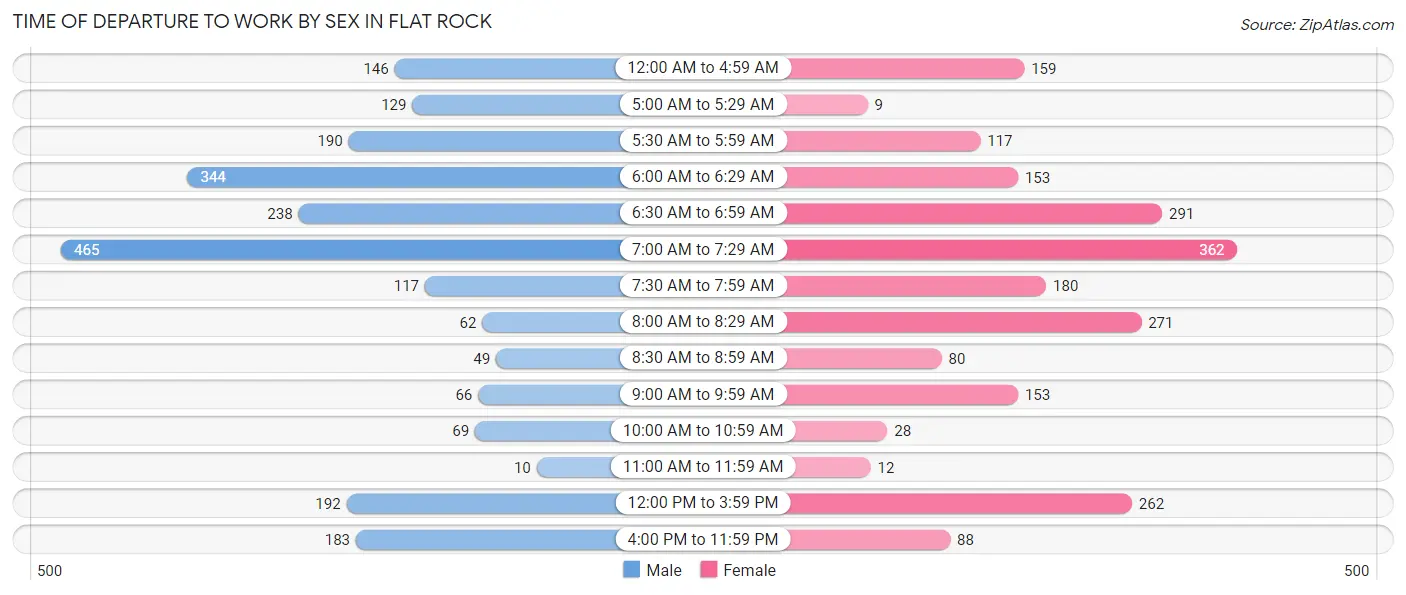
| Time of Departure | Male | Female |
| 12:00 AM to 4:59 AM | 146 (6.5%) | 159 (7.3%) |
| 5:00 AM to 5:29 AM | 129 (5.7%) | 9 (0.4%) |
| 5:30 AM to 5:59 AM | 190 (8.4%) | 117 (5.4%) |
| 6:00 AM to 6:29 AM | 344 (15.2%) | 153 (7.1%) |
| 6:30 AM to 6:59 AM | 238 (10.5%) | 291 (13.4%) |
| 7:00 AM to 7:29 AM | 465 (20.6%) | 362 (16.7%) |
| 7:30 AM to 7:59 AM | 117 (5.2%) | 180 (8.3%) |
| 8:00 AM to 8:29 AM | 62 (2.7%) | 271 (12.5%) |
| 8:30 AM to 8:59 AM | 49 (2.2%) | 80 (3.7%) |
| 9:00 AM to 9:59 AM | 66 (2.9%) | 153 (7.1%) |
| 10:00 AM to 10:59 AM | 69 (3.0%) | 28 (1.3%) |
| 11:00 AM to 11:59 AM | 10 (0.4%) | 12 (0.5%) |
| 12:00 PM to 3:59 PM | 192 (8.5%) | 262 (12.1%) |
| 4:00 PM to 11:59 PM | 183 (8.1%) | 88 (4.1%) |
| Total | 2,260 (100.0%) | 2,165 (100.0%) |
Housing Occupancy in Flat Rock
Occupancy by Ownership in Flat Rock
Of the total 3,788 dwellings in Flat Rock, owner-occupied units account for 2,830 (74.7%), while renter-occupied units make up 958 (25.3%).
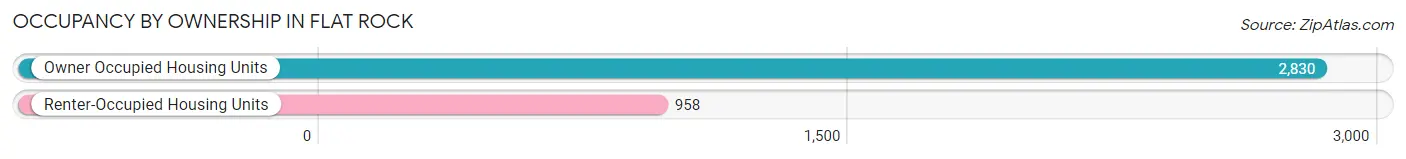
| Occupancy | # Housing Units | % Housing Units |
| Owner Occupied Housing Units | 2,830 | 74.7% |
| Renter-Occupied Housing Units | 958 | 25.3% |
| Total Occupied Housing Units | 3,788 | 100.0% |
Occupancy by Household Size in Flat Rock
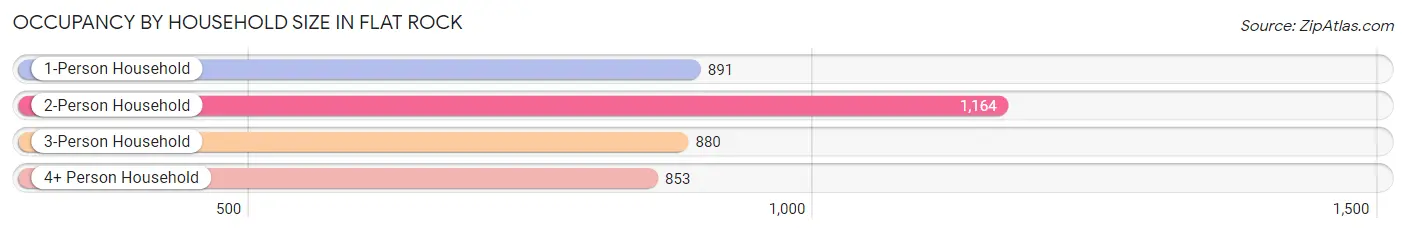
| Household Size | # Housing Units | % Housing Units |
| 1-Person Household | 891 | 23.5% |
| 2-Person Household | 1,164 | 30.7% |
| 3-Person Household | 880 | 23.2% |
| 4+ Person Household | 853 | 22.5% |
| Total Housing Units | 3,788 | 100.0% |
Occupancy by Ownership by Household Size in Flat Rock
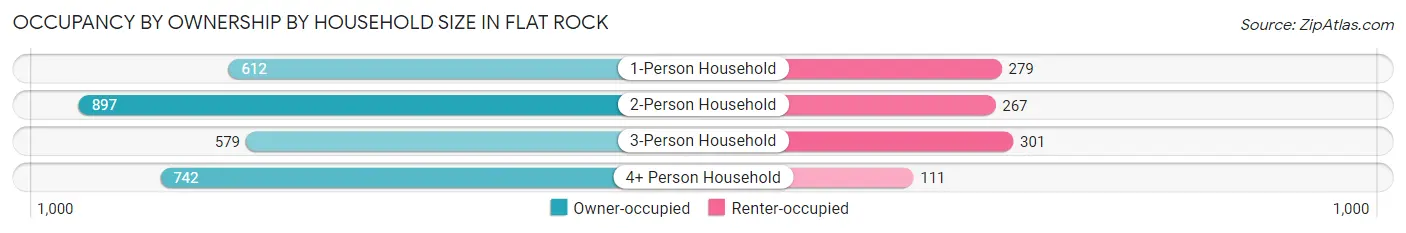
| Household Size | Owner-occupied | Renter-occupied |
| 1-Person Household | 612 (68.7%) | 279 (31.3%) |
| 2-Person Household | 897 (77.1%) | 267 (22.9%) |
| 3-Person Household | 579 (65.8%) | 301 (34.2%) |
| 4+ Person Household | 742 (87.0%) | 111 (13.0%) |
| Total Housing Units | 2,830 (74.7%) | 958 (25.3%) |
Occupancy by Educational Attainment in Flat Rock
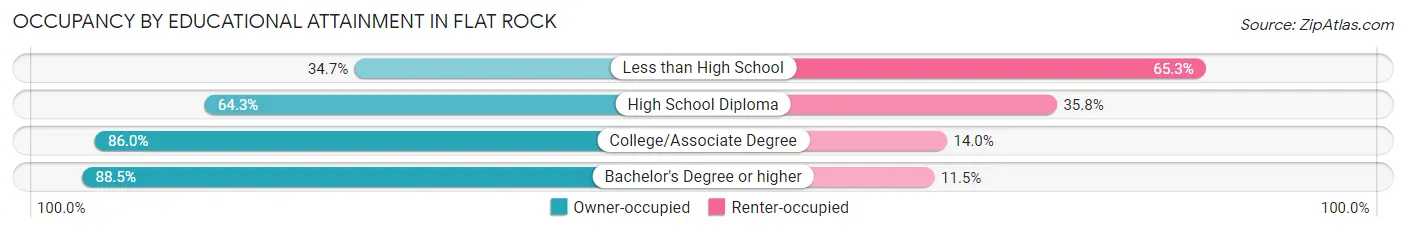
| Household Size | Owner-occupied | Renter-occupied |
| Less than High School | 135 (34.7%) | 254 (65.3%) |
| High School Diploma | 737 (64.2%) | 410 (35.7%) |
| College/Associate Degree | 1,219 (86.0%) | 198 (14.0%) |
| Bachelor's Degree or higher | 739 (88.5%) | 96 (11.5%) |
Occupancy by Age of Householder in Flat Rock
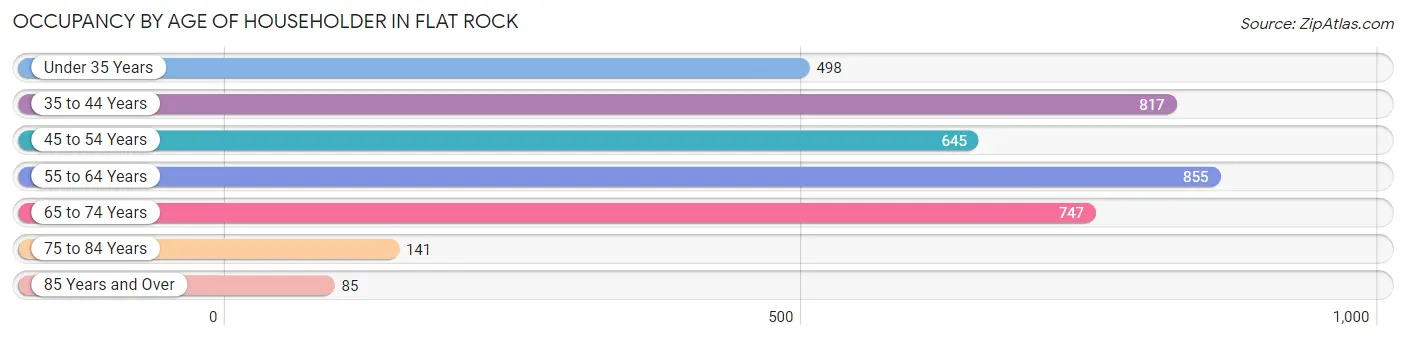
| Age Bracket | # Households | % Households |
| Under 35 Years | 498 | 13.2% |
| 35 to 44 Years | 817 | 21.6% |
| 45 to 54 Years | 645 | 17.0% |
| 55 to 64 Years | 855 | 22.6% |
| 65 to 74 Years | 747 | 19.7% |
| 75 to 84 Years | 141 | 3.7% |
| 85 Years and Over | 85 | 2.2% |
| Total | 3,788 | 100.0% |
Housing Finances in Flat Rock
Median Income by Occupancy in Flat Rock
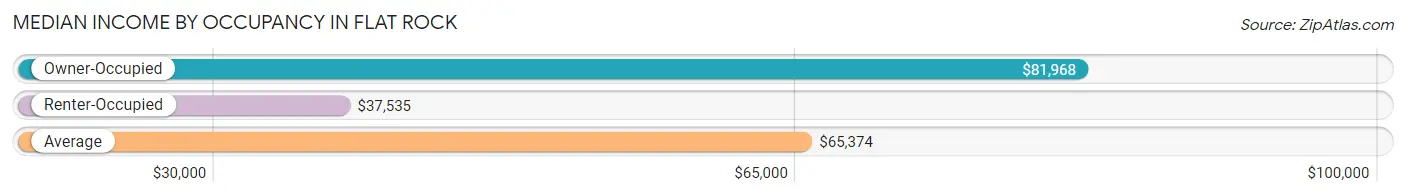
| Occupancy Type | # Households | Median Income |
| Owner-Occupied | 2,830 (74.7%) | $81,968 |
| Renter-Occupied | 958 (25.3%) | $37,535 |
| Average | 3,788 (100.0%) | $65,374 |
Occupancy by Householder Income Bracket in Flat Rock
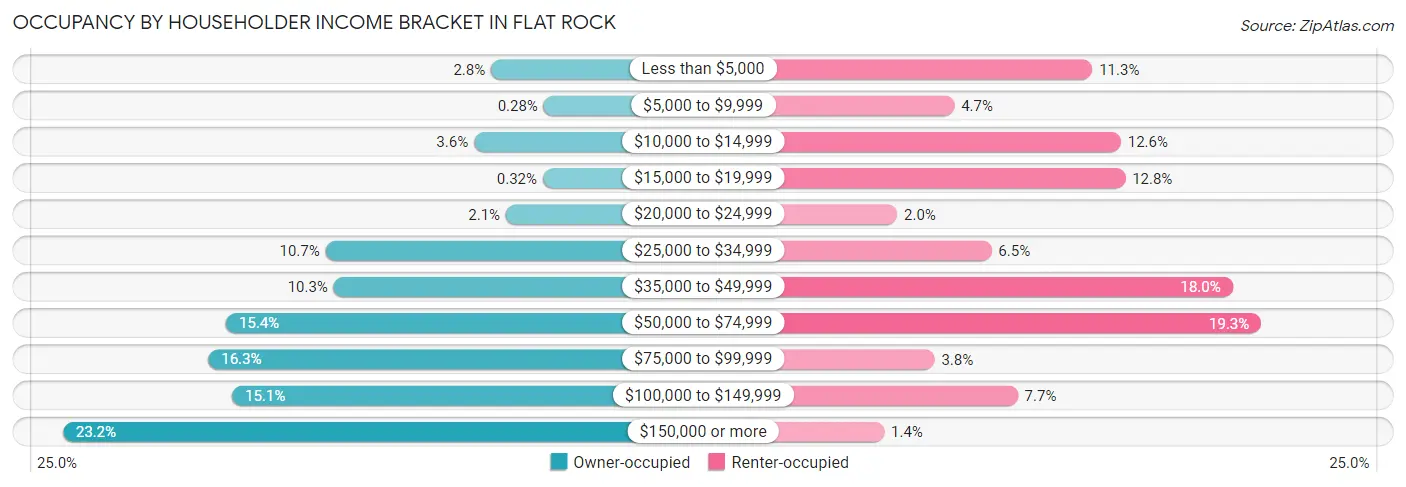
| Income Bracket | Owner-occupied | Renter-occupied |
| Less than $5,000 | 79 (2.8%) | 108 (11.3%) |
| $5,000 to $9,999 | 8 (0.3%) | 45 (4.7%) |
| $10,000 to $14,999 | 102 (3.6%) | 121 (12.6%) |
| $15,000 to $19,999 | 9 (0.3%) | 123 (12.8%) |
| $20,000 to $24,999 | 59 (2.1%) | 19 (2.0%) |
| $25,000 to $34,999 | 302 (10.7%) | 62 (6.5%) |
| $35,000 to $49,999 | 291 (10.3%) | 172 (17.9%) |
| $50,000 to $74,999 | 436 (15.4%) | 185 (19.3%) |
| $75,000 to $99,999 | 460 (16.3%) | 36 (3.8%) |
| $100,000 to $149,999 | 428 (15.1%) | 74 (7.7%) |
| $150,000 or more | 656 (23.2%) | 13 (1.4%) |
| Total | 2,830 (100.0%) | 958 (100.0%) |
Monthly Housing Cost Tiers in Flat Rock
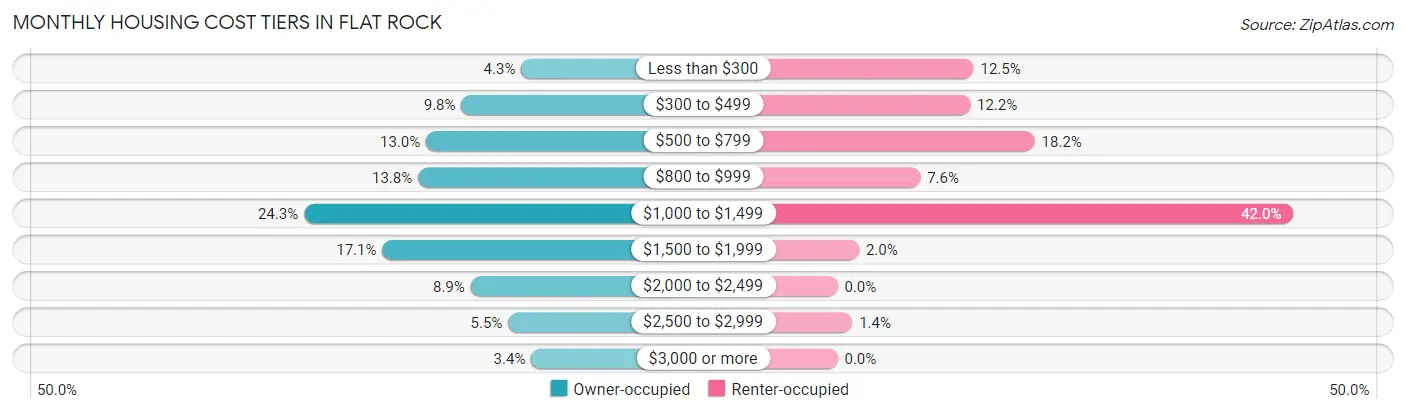
| Monthly Cost | Owner-occupied | Renter-occupied |
| Less than $300 | 121 (4.3%) | 120 (12.5%) |
| $300 to $499 | 277 (9.8%) | 117 (12.2%) |
| $500 to $799 | 369 (13.0%) | 174 (18.2%) |
| $800 to $999 | 390 (13.8%) | 73 (7.6%) |
| $1,000 to $1,499 | 687 (24.3%) | 402 (42.0%) |
| $1,500 to $1,999 | 483 (17.1%) | 19 (2.0%) |
| $2,000 to $2,499 | 253 (8.9%) | 0 (0.0%) |
| $2,500 to $2,999 | 155 (5.5%) | 13 (1.4%) |
| $3,000 or more | 95 (3.4%) | 0 (0.0%) |
| Total | 2,830 (100.0%) | 958 (100.0%) |
Physical Housing Characteristics in Flat Rock
Housing Structures in Flat Rock
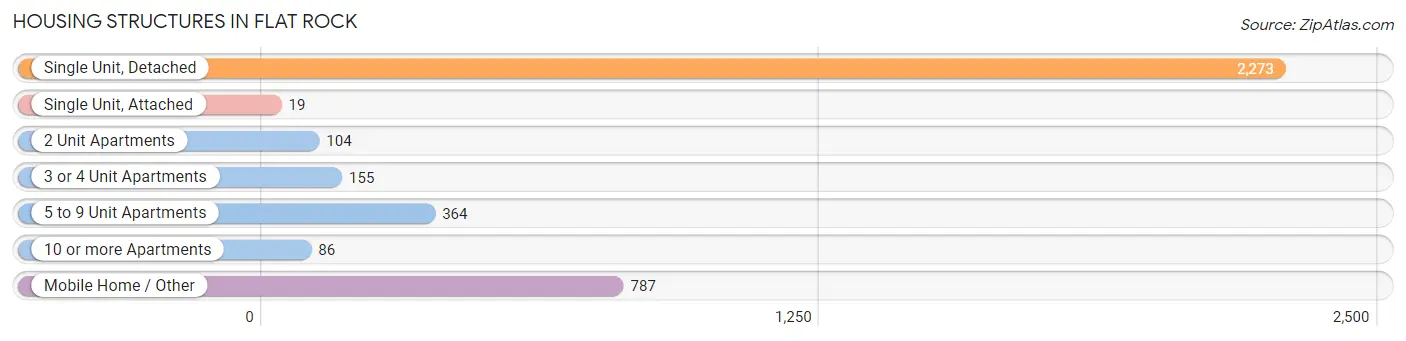
| Structure Type | # Housing Units | % Housing Units |
| Single Unit, Detached | 2,273 | 60.0% |
| Single Unit, Attached | 19 | 0.5% |
| 2 Unit Apartments | 104 | 2.8% |
| 3 or 4 Unit Apartments | 155 | 4.1% |
| 5 to 9 Unit Apartments | 364 | 9.6% |
| 10 or more Apartments | 86 | 2.3% |
| Mobile Home / Other | 787 | 20.8% |
| Total | 3,788 | 100.0% |
Housing Structures by Occupancy in Flat Rock
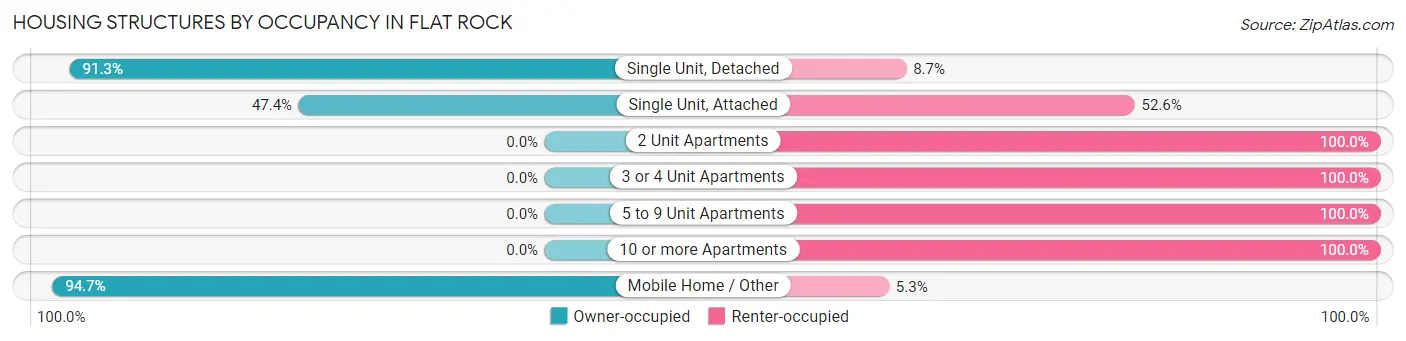
| Structure Type | Owner-occupied | Renter-occupied |
| Single Unit, Detached | 2,076 (91.3%) | 197 (8.7%) |
| Single Unit, Attached | 9 (47.4%) | 10 (52.6%) |
| 2 Unit Apartments | 0 (0.0%) | 104 (100.0%) |
| 3 or 4 Unit Apartments | 0 (0.0%) | 155 (100.0%) |
| 5 to 9 Unit Apartments | 0 (0.0%) | 364 (100.0%) |
| 10 or more Apartments | 0 (0.0%) | 86 (100.0%) |
| Mobile Home / Other | 745 (94.7%) | 42 (5.3%) |
| Total | 2,830 (74.7%) | 958 (25.3%) |
Housing Structures by Number of Rooms in Flat Rock
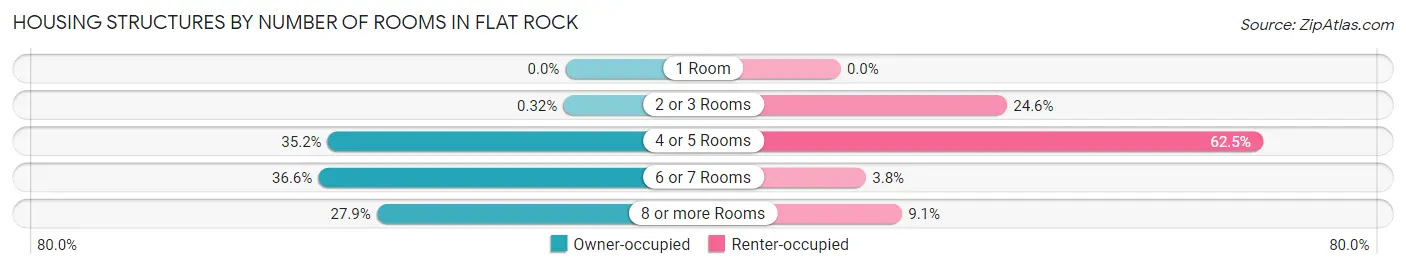
| Number of Rooms | Owner-occupied | Renter-occupied |
| 1 Room | 0 (0.0%) | 0 (0.0%) |
| 2 or 3 Rooms | 9 (0.3%) | 236 (24.6%) |
| 4 or 5 Rooms | 996 (35.2%) | 599 (62.5%) |
| 6 or 7 Rooms | 1,035 (36.6%) | 36 (3.8%) |
| 8 or more Rooms | 790 (27.9%) | 87 (9.1%) |
| Total | 2,830 (100.0%) | 958 (100.0%) |
Housing Structure by Heating Type in Flat Rock
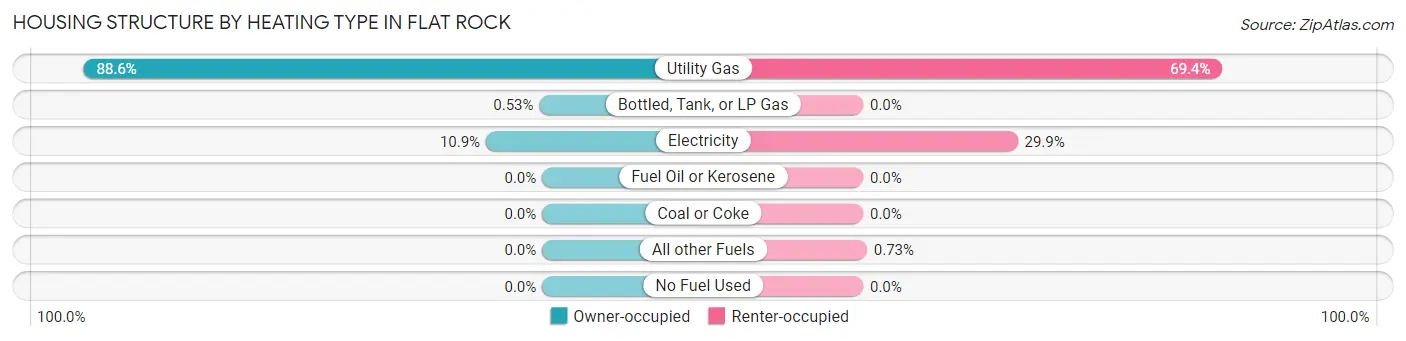
| Heating Type | Owner-occupied | Renter-occupied |
| Utility Gas | 2,508 (88.6%) | 665 (69.4%) |
| Bottled, Tank, or LP Gas | 15 (0.5%) | 0 (0.0%) |
| Electricity | 307 (10.8%) | 286 (29.8%) |
| Fuel Oil or Kerosene | 0 (0.0%) | 0 (0.0%) |
| Coal or Coke | 0 (0.0%) | 0 (0.0%) |
| All other Fuels | 0 (0.0%) | 7 (0.7%) |
| No Fuel Used | 0 (0.0%) | 0 (0.0%) |
| Total | 2,830 (100.0%) | 958 (100.0%) |
Household Vehicle Usage in Flat Rock
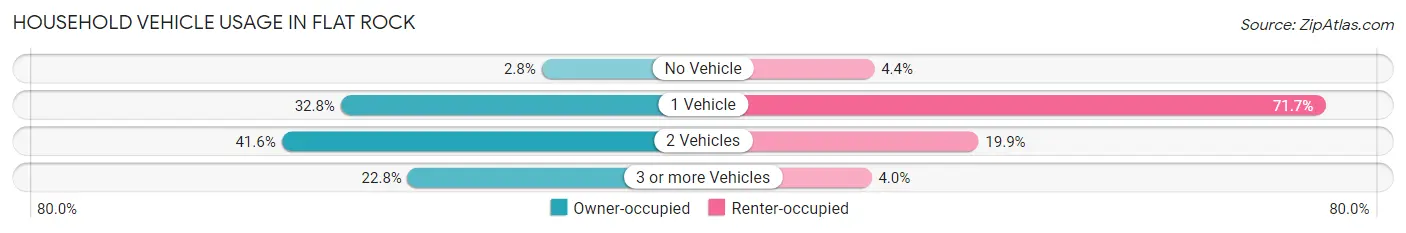
| Vehicles per Household | Owner-occupied | Renter-occupied |
| No Vehicle | 79 (2.8%) | 42 (4.4%) |
| 1 Vehicle | 928 (32.8%) | 687 (71.7%) |
| 2 Vehicles | 1,178 (41.6%) | 191 (19.9%) |
| 3 or more Vehicles | 645 (22.8%) | 38 (4.0%) |
| Total | 2,830 (100.0%) | 958 (100.0%) |
Real Estate & Mortgages in Flat Rock
Real Estate and Mortgage Overview in Flat Rock
| Characteristic | Without Mortgage | With Mortgage |
| Housing Units | 1,031 | 1,799 |
| Median Property Value | $160,000 | $192,500 |
| Median Household Income | $55,391 | $594 |
| Monthly Housing Costs | $683 | $95 |
| Real Estate Taxes | $3,793 | $385 |
Property Value by Mortgage Status in Flat Rock
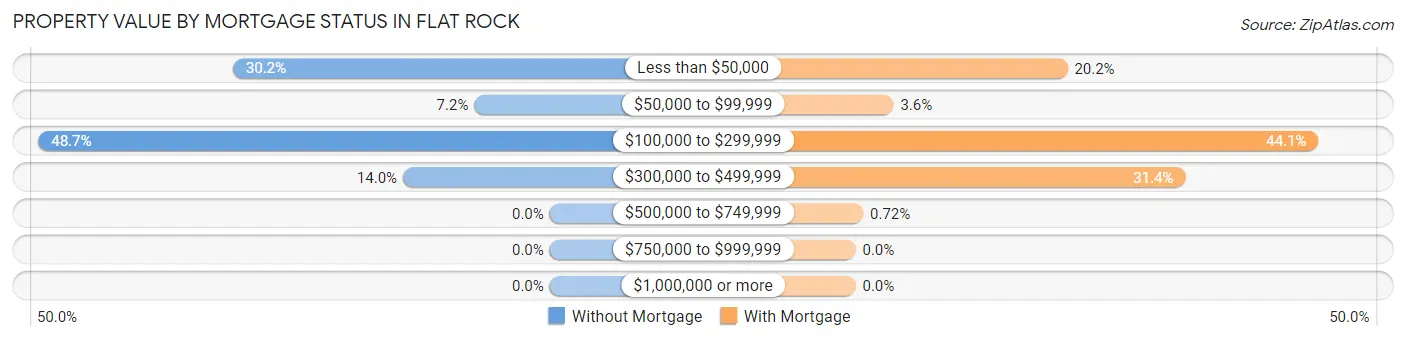
| Property Value | Without Mortgage | With Mortgage |
| Less than $50,000 | 311 (30.2%) | 363 (20.2%) |
| $50,000 to $99,999 | 74 (7.2%) | 65 (3.6%) |
| $100,000 to $299,999 | 502 (48.7%) | 793 (44.1%) |
| $300,000 to $499,999 | 144 (14.0%) | 565 (31.4%) |
| $500,000 to $749,999 | 0 (0.0%) | 13 (0.7%) |
| $750,000 to $999,999 | 0 (0.0%) | 0 (0.0%) |
| $1,000,000 or more | 0 (0.0%) | 0 (0.0%) |
| Total | 1,031 (100.0%) | 1,799 (100.0%) |
Household Income by Mortgage Status in Flat Rock
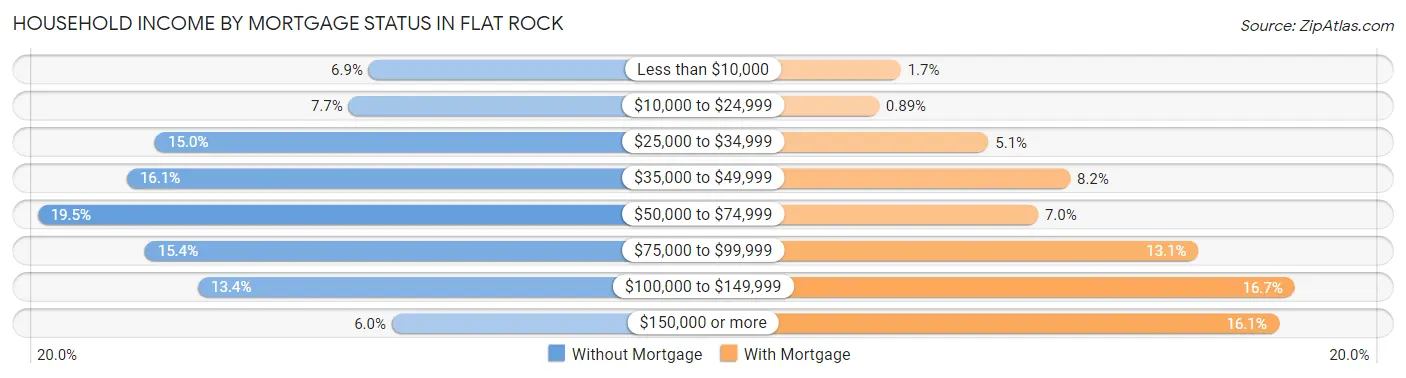
| Household Income | Without Mortgage | With Mortgage |
| Less than $10,000 | 71 (6.9%) | 31 (1.7%) |
| $10,000 to $24,999 | 79 (7.7%) | 16 (0.9%) |
| $25,000 to $34,999 | 155 (15.0%) | 91 (5.1%) |
| $35,000 to $49,999 | 166 (16.1%) | 147 (8.2%) |
| $50,000 to $74,999 | 201 (19.5%) | 125 (7.0%) |
| $75,000 to $99,999 | 159 (15.4%) | 235 (13.1%) |
| $100,000 to $149,999 | 138 (13.4%) | 301 (16.7%) |
| $150,000 or more | 62 (6.0%) | 290 (16.1%) |
| Total | 1,031 (100.0%) | 1,799 (100.0%) |
Property Value to Household Income Ratio in Flat Rock
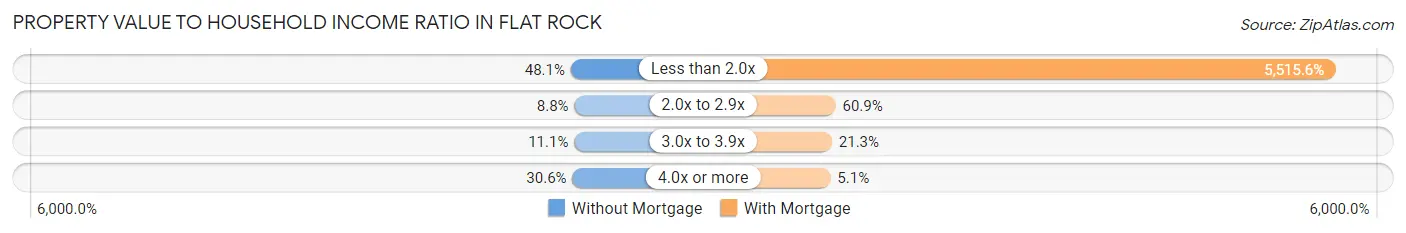
| Value-to-Income Ratio | Without Mortgage | With Mortgage |
| Less than 2.0x | 496 (48.1%) | 99,225 (5,515.6%) |
| 2.0x to 2.9x | 91 (8.8%) | 1,096 (60.9%) |
| 3.0x to 3.9x | 114 (11.1%) | 383 (21.3%) |
| 4.0x or more | 315 (30.5%) | 92 (5.1%) |
| Total | 1,031 (100.0%) | 1,799 (100.0%) |
Real Estate Taxes by Mortgage Status in Flat Rock
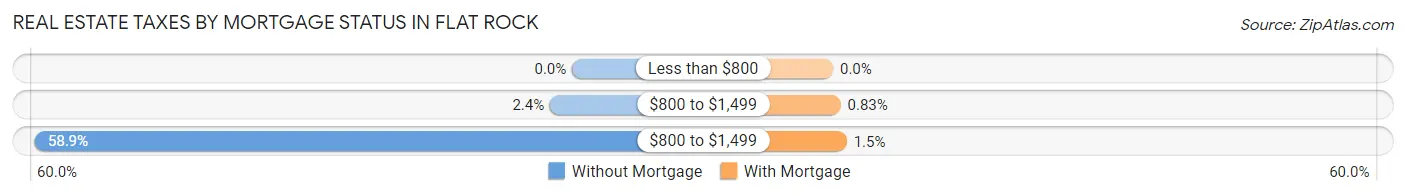
| Property Taxes | Without Mortgage | With Mortgage |
| Less than $800 | 0 (0.0%) | 0 (0.0%) |
| $800 to $1,499 | 25 (2.4%) | 15 (0.8%) |
| $800 to $1,499 | 607 (58.9%) | 27 (1.5%) |
| Total | 1,031 (100.0%) | 1,799 (100.0%) |
Health & Disability in Flat Rock
Health Insurance Coverage by Age in Flat Rock
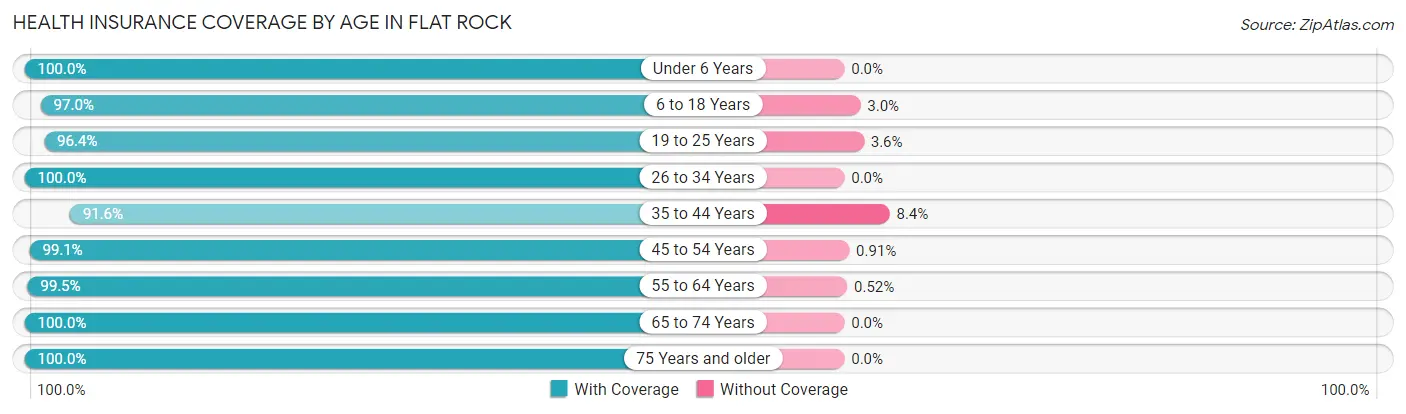
| Age Bracket | With Coverage | Without Coverage |
| Under 6 Years | 823 (100.0%) | 0 (0.0%) |
| 6 to 18 Years | 2,007 (97.0%) | 62 (3.0%) |
| 19 to 25 Years | 1,008 (96.4%) | 38 (3.6%) |
| 26 to 34 Years | 1,120 (100.0%) | 0 (0.0%) |
| 35 to 44 Years | 1,335 (91.6%) | 123 (8.4%) |
| 45 to 54 Years | 1,198 (99.1%) | 11 (0.9%) |
| 55 to 64 Years | 1,346 (99.5%) | 7 (0.5%) |
| 65 to 74 Years | 1,030 (100.0%) | 0 (0.0%) |
| 75 Years and older | 333 (100.0%) | 0 (0.0%) |
| Total | 10,200 (97.7%) | 241 (2.3%) |
Health Insurance Coverage by Citizenship Status in Flat Rock
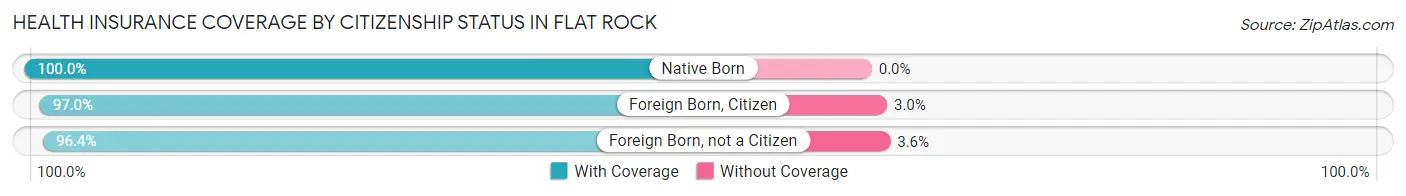
| Citizenship Status | With Coverage | Without Coverage |
| Native Born | 823 (100.0%) | 0 (0.0%) |
| Foreign Born, Citizen | 2,007 (97.0%) | 62 (3.0%) |
| Foreign Born, not a Citizen | 1,008 (96.4%) | 38 (3.6%) |
Health Insurance Coverage by Household Income in Flat Rock
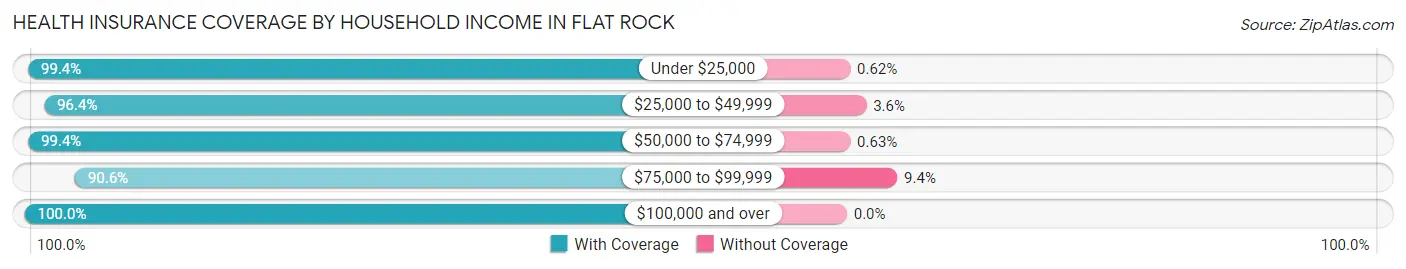
| Household Income | With Coverage | Without Coverage |
| Under $25,000 | 1,433 (99.4%) | 9 (0.6%) |
| $25,000 to $49,999 | 1,799 (96.4%) | 68 (3.6%) |
| $50,000 to $74,999 | 1,411 (99.4%) | 9 (0.6%) |
| $75,000 to $99,999 | 1,489 (90.6%) | 155 (9.4%) |
| $100,000 and over | 4,049 (100.0%) | 0 (0.0%) |
Public vs Private Health Insurance Coverage by Age in Flat Rock
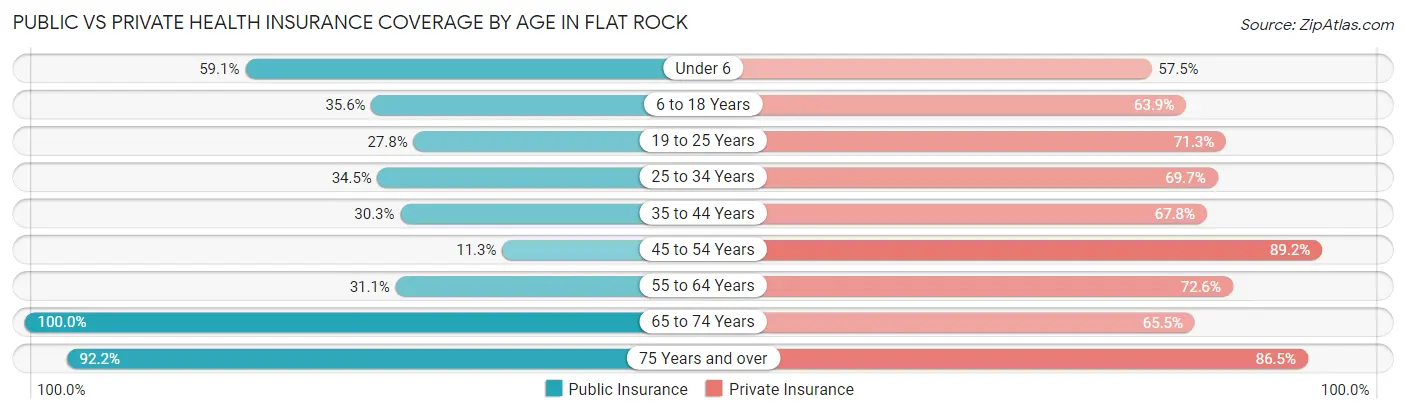
| Age Bracket | Public Insurance | Private Insurance |
| Under 6 | 486 (59.1%) | 473 (57.5%) |
| 6 to 18 Years | 737 (35.6%) | 1,322 (63.9%) |
| 19 to 25 Years | 291 (27.8%) | 746 (71.3%) |
| 25 to 34 Years | 386 (34.5%) | 781 (69.7%) |
| 35 to 44 Years | 441 (30.2%) | 988 (67.8%) |
| 45 to 54 Years | 137 (11.3%) | 1,078 (89.2%) |
| 55 to 64 Years | 421 (31.1%) | 982 (72.6%) |
| 65 to 74 Years | 1,030 (100.0%) | 675 (65.5%) |
| 75 Years and over | 307 (92.2%) | 288 (86.5%) |
| Total | 4,236 (40.6%) | 7,333 (70.2%) |
Disability Status by Sex by Age in Flat Rock
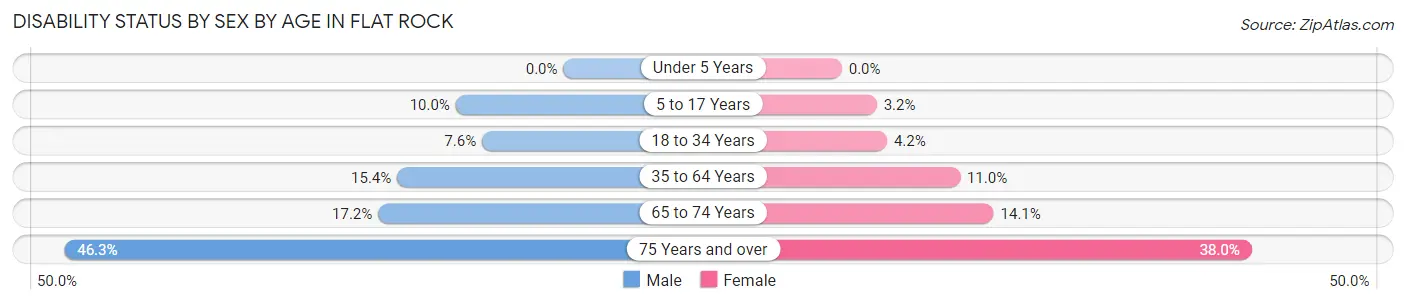
| Age Bracket | Male | Female |
| Under 5 Years | 0 (0.0%) | 0 (0.0%) |
| 5 to 17 Years | 109 (10.0%) | 34 (3.2%) |
| 18 to 34 Years | 95 (7.5%) | 44 (4.2%) |
| 35 to 64 Years | 291 (15.4%) | 234 (11.0%) |
| 65 to 74 Years | 66 (17.2%) | 91 (14.1%) |
| 75 Years and over | 69 (46.3%) | 70 (38.0%) |
Disability Class by Sex by Age in Flat Rock
Disability Class: Hearing Difficulty
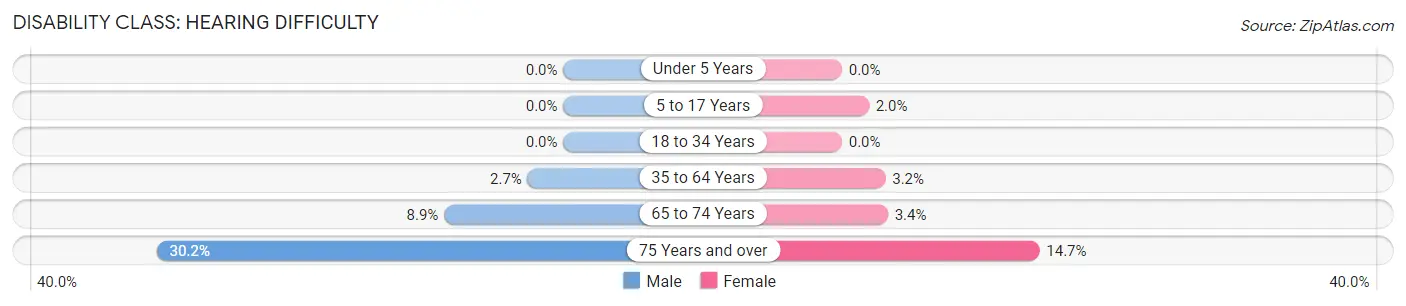
| Age Bracket | Male | Female |
| Under 5 Years | 0 (0.0%) | 0 (0.0%) |
| 5 to 17 Years | 0 (0.0%) | 21 (2.0%) |
| 18 to 34 Years | 0 (0.0%) | 0 (0.0%) |
| 35 to 64 Years | 50 (2.6%) | 69 (3.2%) |
| 65 to 74 Years | 34 (8.8%) | 22 (3.4%) |
| 75 Years and over | 45 (30.2%) | 27 (14.7%) |
Disability Class: Vision Difficulty
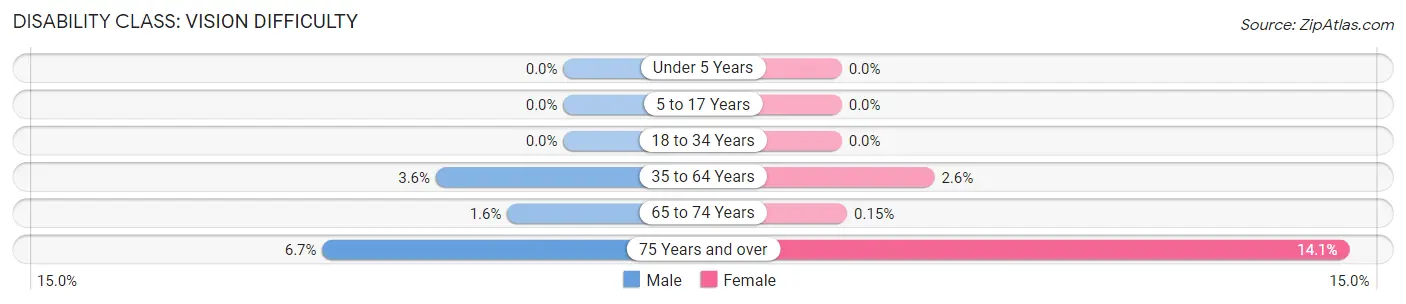
| Age Bracket | Male | Female |
| Under 5 Years | 0 (0.0%) | 0 (0.0%) |
| 5 to 17 Years | 0 (0.0%) | 0 (0.0%) |
| 18 to 34 Years | 0 (0.0%) | 0 (0.0%) |
| 35 to 64 Years | 67 (3.5%) | 55 (2.6%) |
| 65 to 74 Years | 6 (1.6%) | 1 (0.2%) |
| 75 Years and over | 10 (6.7%) | 26 (14.1%) |
Disability Class: Cognitive Difficulty
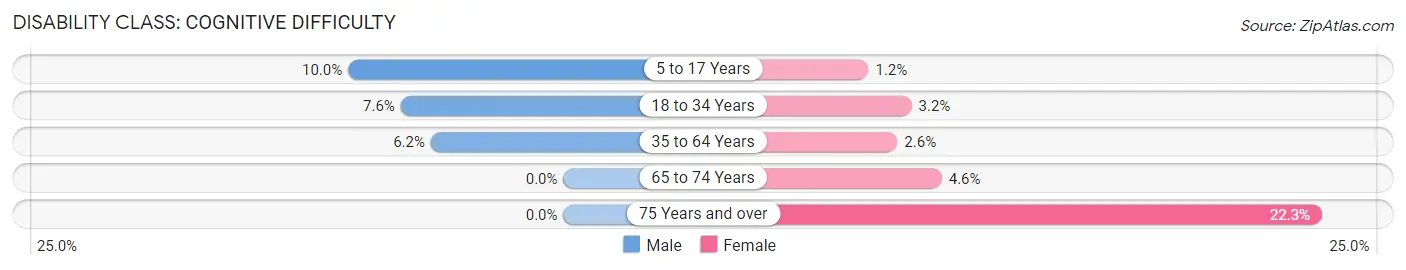
| Age Bracket | Male | Female |
| 5 to 17 Years | 109 (10.0%) | 13 (1.2%) |
| 18 to 34 Years | 95 (7.5%) | 34 (3.2%) |
| 35 to 64 Years | 116 (6.1%) | 55 (2.6%) |
| 65 to 74 Years | 0 (0.0%) | 30 (4.6%) |
| 75 Years and over | 0 (0.0%) | 41 (22.3%) |
Disability Class: Ambulatory Difficulty
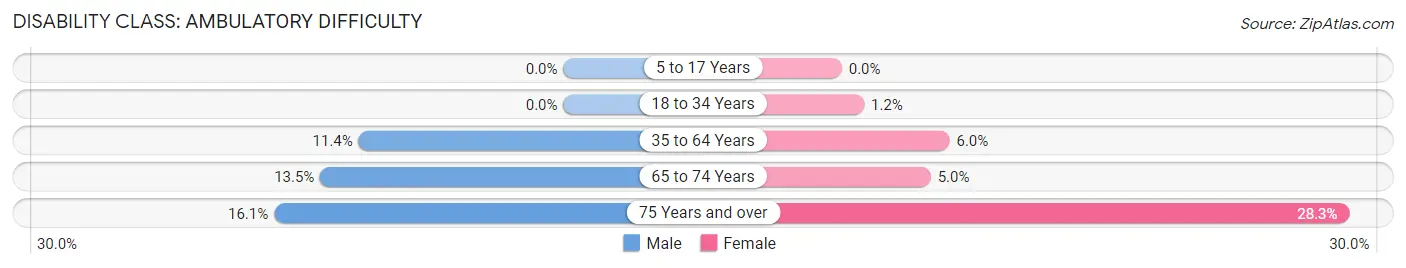
| Age Bracket | Male | Female |
| 5 to 17 Years | 0 (0.0%) | 0 (0.0%) |
| 18 to 34 Years | 0 (0.0%) | 13 (1.2%) |
| 35 to 64 Years | 215 (11.4%) | 128 (6.0%) |
| 65 to 74 Years | 52 (13.5%) | 32 (5.0%) |
| 75 Years and over | 24 (16.1%) | 52 (28.3%) |
Disability Class: Self-Care Difficulty
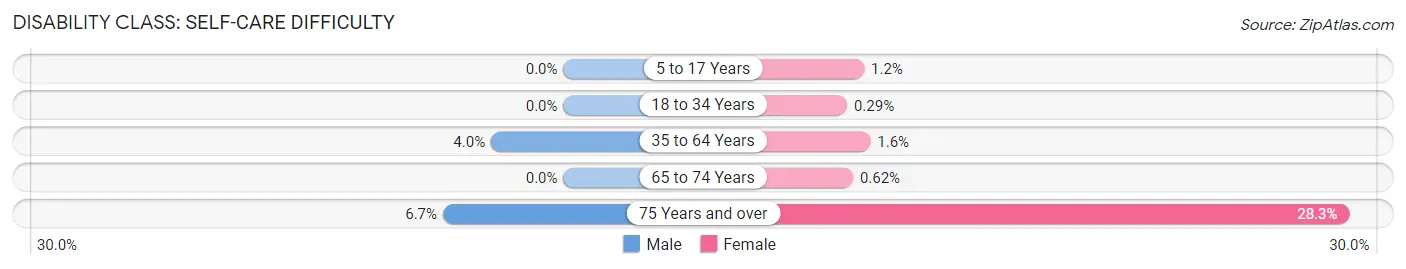
| Age Bracket | Male | Female |
| 5 to 17 Years | 0 (0.0%) | 13 (1.2%) |
| 18 to 34 Years | 0 (0.0%) | 3 (0.3%) |
| 35 to 64 Years | 76 (4.0%) | 34 (1.6%) |
| 65 to 74 Years | 0 (0.0%) | 4 (0.6%) |
| 75 Years and over | 10 (6.7%) | 52 (28.3%) |
Technology Access in Flat Rock
Computing Device Access in Flat Rock
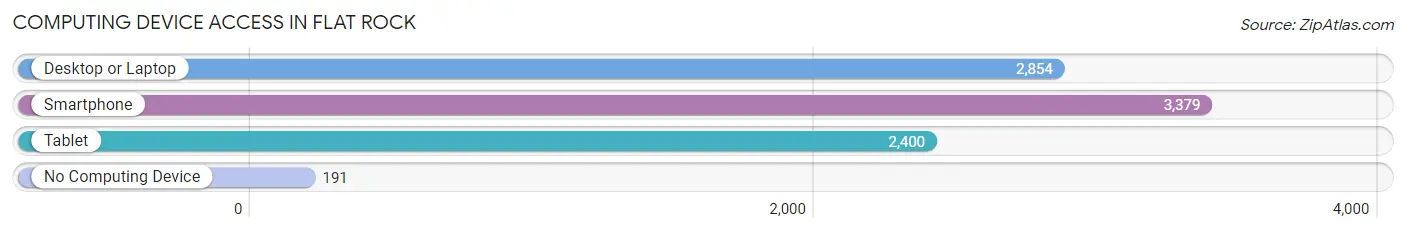
| Device Type | # Households | % Households |
| Desktop or Laptop | 2,854 | 75.3% |
| Smartphone | 3,379 | 89.2% |
| Tablet | 2,400 | 63.4% |
| No Computing Device | 191 | 5.0% |
| Total | 3,788 | 100.0% |
Internet Access in Flat Rock
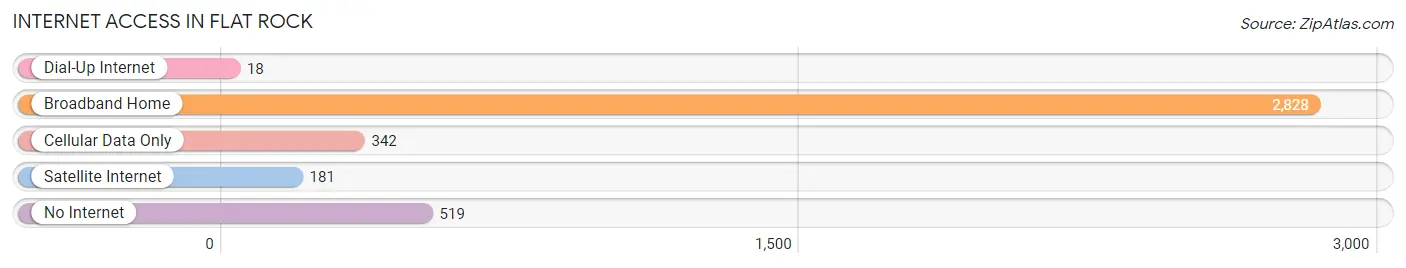
| Internet Type | # Households | % Households |
| Dial-Up Internet | 18 | 0.5% |
| Broadband Home | 2,828 | 74.7% |
| Cellular Data Only | 342 | 9.0% |
| Satellite Internet | 181 | 4.8% |
| No Internet | 519 | 13.7% |
| Total | 3,788 | 100.0% |
Flat Rock Summary
Flat Rock, Michigan is a small city located in Wayne County, Michigan. It is situated on the Detroit River, just south of the city of Detroit. The city has a population of approximately 10,000 people and is part of the Downriver area of Wayne County.
History
Flat Rock was first settled in 1817 by a group of French-Canadian immigrants. The settlement was originally called “Rivière aux Canards”, which translates to “Duck River”. The settlement was later renamed Flat Rock, after the flat rocks that were found in the area.
In 1827, the settlement was incorporated as the Village of Flat Rock. The village was named after the flat rocks that were found in the area. The village was later incorporated as a city in 1837.
In the late 19th century, Flat Rock was a popular summer resort destination for wealthy Detroiters. The city was home to several large resorts, including the Flat Rock Hotel, which was built in 1876.
Geography
Flat Rock is located in Wayne County, Michigan. It is situated on the Detroit River, just south of the city of Detroit. The city has a total area of 4.2 square miles, all of which is land.
The city is located in the Huron River watershed. The Huron River is a major tributary of the Detroit River. The city is also located in the Detroit River watershed.
The city is located in the Detroit metropolitan area. The city is located approximately 20 miles south of the city of Detroit.
Economy
Flat Rock’s economy is largely based on manufacturing. The city is home to several large manufacturing companies, including Ford Motor Company, which has a large assembly plant in the city.
The city is also home to several smaller manufacturing companies, including several automotive parts suppliers.
The city is also home to several retail stores restaurants and other businesses
Demographics
As of the 2010 census, the city had a population of 9,878 people. The racial makeup of the city was 87.3% White, 8.2% African American, 0.3% Native American, 0.7% Asian, 0.1% Pacific Islander, 1.2% from other races, and 2.4% from two or more races. Hispanic or Latino of any race were 3.2% of the population.
The median income for a household in the city was $45,945, and the median income for a family was $54,945. The per capita income for the city was $21,945. About 8.2% of families and 10.2% of the population were below the poverty line, including 14.2% of those under age 18 and 6.2% of those age 65 or over.
Flat Rock is a small city with a rich history and a diverse population. The city is home to several large manufacturing companies, as well as several smaller businesses. The city is also home to several retail stores, restaurants, and other businesses. The city has a median income that is slightly higher than the national average, and the poverty rate is slightly lower than the national average.
Common Questions
What is Per Capita Income in Flat Rock?
Per Capita income in Flat Rock is $32,566.
What is the Median Family Income in Flat Rock?
Median Family Income in Flat Rock is $81,053.
What is the Median Household income in Flat Rock?
Median Household Income in Flat Rock is $65,374.
What is Income or Wage Gap in Flat Rock?
Income or Wage Gap in Flat Rock is 19.3%.
Women in Flat Rock earn 80.7 cents for every dollar earned by a man.
What is Family Income Deficit in Flat Rock?
Family Income Deficit in Flat Rock is $11,880.
Families that are below poverty line in Flat Rock earn $11,880 less on average than the poverty threshold level.
What is Inequality or Gini Index in Flat Rock?
Inequality or Gini Index in Flat Rock is 0.47.
What is the Total Population of Flat Rock?
Total Population of Flat Rock is 10,448.
What is the Total Male Population of Flat Rock?
Total Male Population of Flat Rock is 5,208.
What is the Total Female Population of Flat Rock?
Total Female Population of Flat Rock is 5,240.
What is the Ratio of Males per 100 Females in Flat Rock?
There are 99.39 Males per 100 Females in Flat Rock.
What is the Ratio of Females per 100 Males in Flat Rock?
There are 100.61 Females per 100 Males in Flat Rock.
What is the Median Population Age in Flat Rock?
Median Population Age in Flat Rock is 35.7 Years.
What is the Average Family Size in Flat Rock
Average Family Size in Flat Rock is 3.2 People.
What is the Average Household Size in Flat Rock
Average Household Size in Flat Rock is 2.8 People.
How Large is the Labor Force in Flat Rock?
There are 5,234 People in the Labor Forcein in Flat Rock.
What is the Percentage of People in the Labor Force in Flat Rock?
64.9% of People are in the Labor Force in Flat Rock.
What is the Unemployment Rate in Flat Rock?
Unemployment Rate in Flat Rock is 7.6%.