Armada, MI Map & Demographics
Armada Map
Armada Overview
$38,156
PER CAPITA INCOME
$125,100
AVG FAMILY INCOME
$105,774
AVG HOUSEHOLD INCOME
42.2%
WAGE / INCOME GAP [ % ]
57.8¢/ $1
WAGE / INCOME GAP [ $ ]
0.38
INEQUALITY / GINI INDEX
2,039
TOTAL POPULATION
936
MALE POPULATION
1,103
FEMALE POPULATION
84.86
MALES / 100 FEMALES
117.84
FEMALES / 100 MALES
40.4
MEDIAN AGE
3.5
AVG FAMILY SIZE
3.0
AVG HOUSEHOLD SIZE
927
LABOR FORCE [ PEOPLE ]
59.2%
PERCENT IN LABOR FORCE
3.1%
UNEMPLOYMENT RATE
Armada Zip Codes
Armada Area Codes
Income in Armada
Income Overview in Armada
Per Capita Income in Armada is $38,156, while median incomes of families and households are $125,100 and $105,774 respectively.
| Characteristic | Number | Measure |
| Per Capita Income | 2,039 | $38,156 |
| Median Family Income | 476 | $125,100 |
| Mean Family Income | 476 | $128,480 |
| Median Household Income | 657 | $105,774 |
| Mean Household Income | 657 | $115,221 |
| Income Deficit | 476 | $0 |
| Wage / Income Gap (%) | 2,039 | 42.16% |
| Wage / Income Gap ($) | 2,039 | 57.84¢ per $1 |
| Gini / Inequality Index | 2,039 | 0.38 |
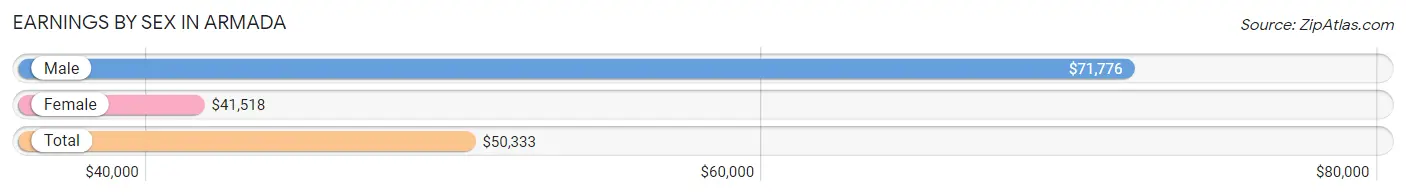
Earnings by Sex in Armada
Average Earnings in Armada are $50,333, $71,776 for men and $41,518 for women, a difference of 42.2%.
| Sex | Number | Average Earnings |
| Male | 537 (54.9%) | $71,776 |
| Female | 441 (45.1%) | $41,518 |
| Total | 978 (100.0%) | $50,333 |
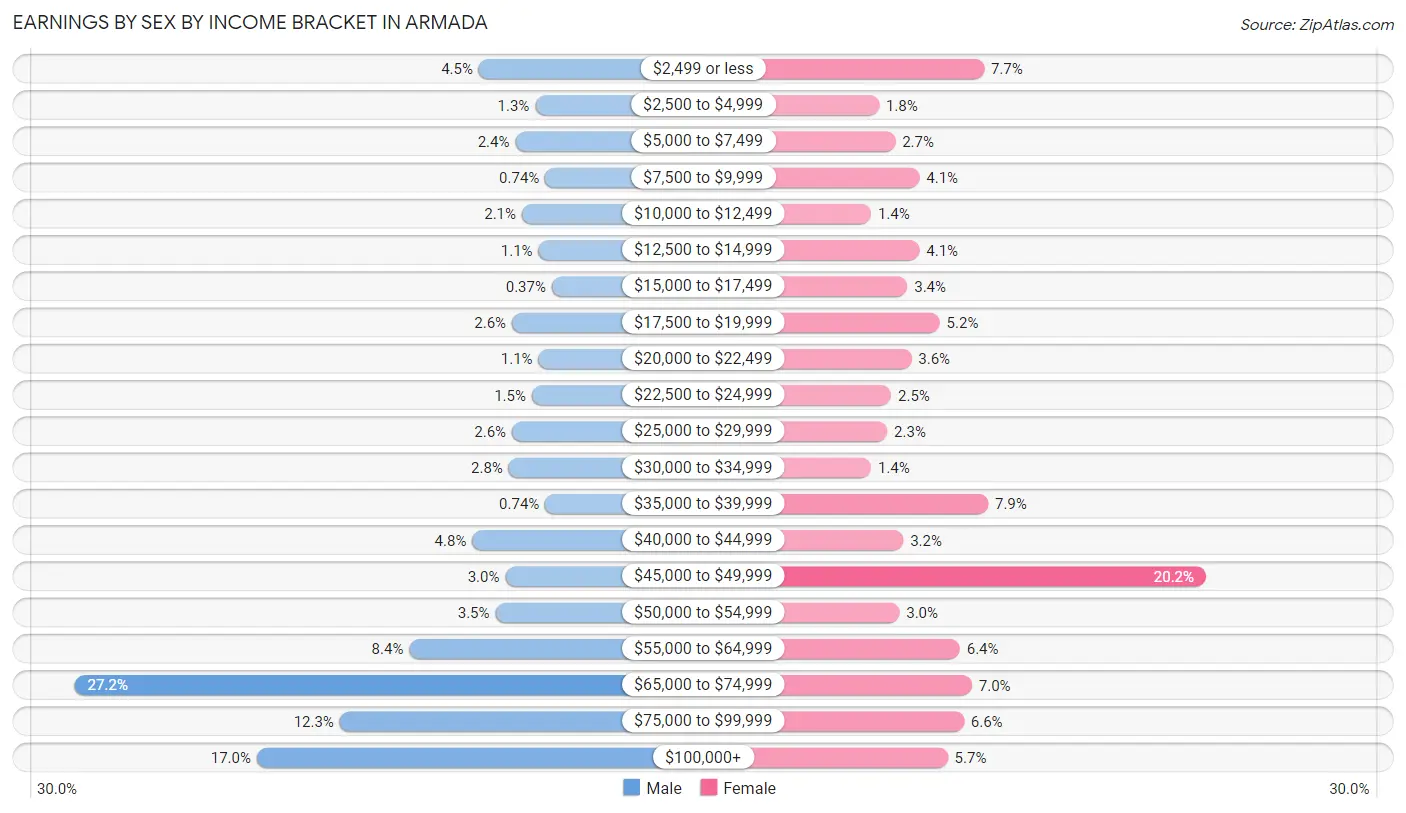
Earnings by Sex by Income Bracket in Armada
The most common earnings brackets in Armada are $65,000 to $74,999 for men (146 | 27.2%) and $45,000 to $49,999 for women (89 | 20.2%).
| Income | Male | Female |
| $2,499 or less | 24 (4.5%) | 34 (7.7%) |
| $2,500 to $4,999 | 7 (1.3%) | 8 (1.8%) |
| $5,000 to $7,499 | 13 (2.4%) | 12 (2.7%) |
| $7,500 to $9,999 | 4 (0.7%) | 18 (4.1%) |
| $10,000 to $12,499 | 11 (2.1%) | 6 (1.4%) |
| $12,500 to $14,999 | 6 (1.1%) | 18 (4.1%) |
| $15,000 to $17,499 | 2 (0.4%) | 15 (3.4%) |
| $17,500 to $19,999 | 14 (2.6%) | 23 (5.2%) |
| $20,000 to $22,499 | 6 (1.1%) | 16 (3.6%) |
| $22,500 to $24,999 | 8 (1.5%) | 11 (2.5%) |
| $25,000 to $29,999 | 14 (2.6%) | 10 (2.3%) |
| $30,000 to $34,999 | 15 (2.8%) | 6 (1.4%) |
| $35,000 to $39,999 | 4 (0.7%) | 35 (7.9%) |
| $40,000 to $44,999 | 26 (4.8%) | 14 (3.2%) |
| $45,000 to $49,999 | 16 (3.0%) | 89 (20.2%) |
| $50,000 to $54,999 | 19 (3.5%) | 13 (2.9%) |
| $55,000 to $64,999 | 45 (8.4%) | 28 (6.4%) |
| $65,000 to $74,999 | 146 (27.2%) | 31 (7.0%) |
| $75,000 to $99,999 | 66 (12.3%) | 29 (6.6%) |
| $100,000+ | 91 (17.0%) | 25 (5.7%) |
| Total | 537 (100.0%) | 441 (100.0%) |
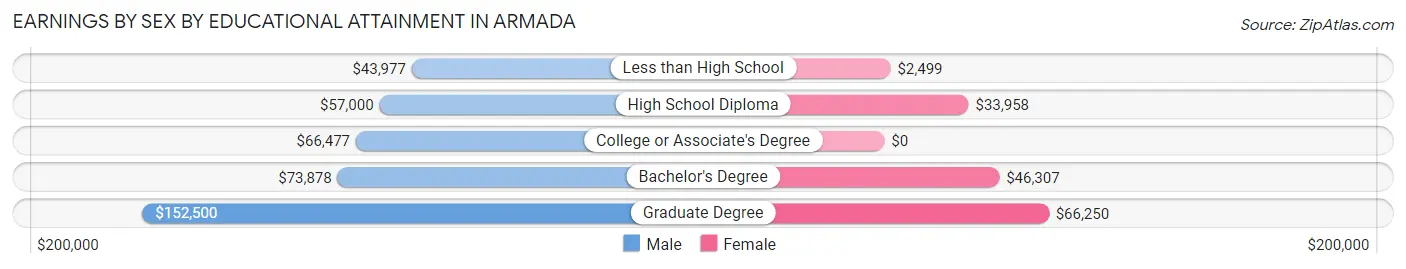
Earnings by Sex by Educational Attainment in Armada
Average earnings in Armada are $73,090 for men and $45,589 for women, a difference of 37.6%. Men with an educational attainment of graduate degree enjoy the highest average annual earnings of $152,500, while those with less than high school education earn the least with $43,977. Women with an educational attainment of graduate degree earn the most with the average annual earnings of $66,250, while those with less than high school education have the smallest earnings of $2,499.
| Educational Attainment | Male Income | Female Income |
| Less than High School | $43,977 | $2,499 |
| High School Diploma | $57,000 | $33,958 |
| College or Associate's Degree | $66,477 | $0 |
| Bachelor's Degree | $73,878 | $46,307 |
| Graduate Degree | $152,500 | $66,250 |
| Total | $73,090 | $45,589 |
Family Income in Armada
Family Income Brackets in Armada
According to the Armada family income data, there are 157 families falling into the $100,000 to $149,999 income range, which is the most common income bracket and makes up 33.0% of all families.
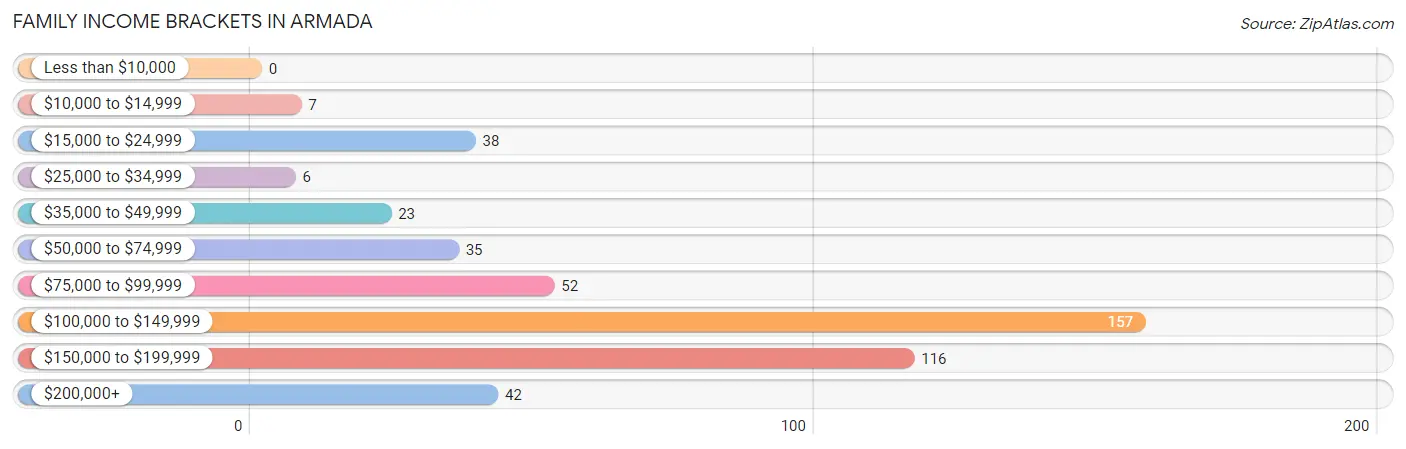
| Income Bracket | # Families | % Families |
| Less than $10,000 | 0 | 0.0% |
| $10,000 to $14,999 | 7 | 1.5% |
| $15,000 to $24,999 | 38 | 8.0% |
| $25,000 to $34,999 | 6 | 1.3% |
| $35,000 to $49,999 | 23 | 4.8% |
| $50,000 to $74,999 | 35 | 7.4% |
| $75,000 to $99,999 | 52 | 10.9% |
| $100,000 to $149,999 | 157 | 33.0% |
| $150,000 to $199,999 | 116 | 24.4% |
| $200,000+ | 42 | 8.8% |
Family Income by Famaliy Size in Armada
5-person families (99 | 20.8%) account for the highest median family income in Armada with $193,650 per family, while 3-person families (87 | 18.3%) have the highest median income of $40,694 per family member.
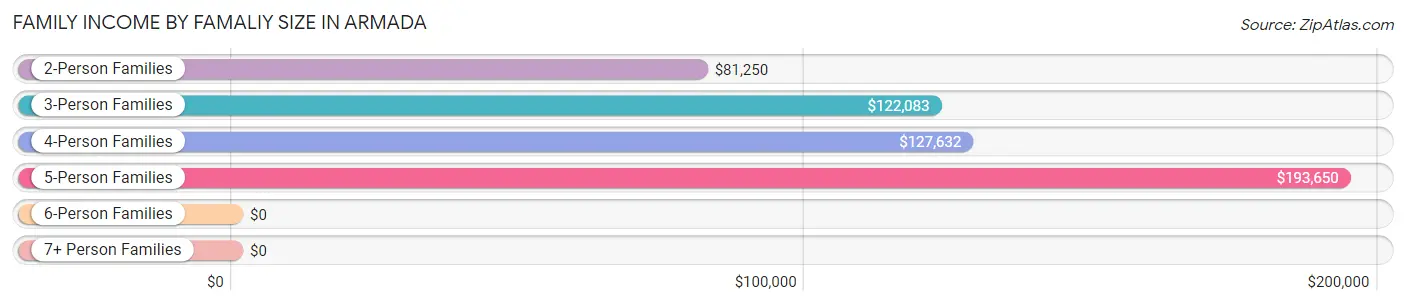
| Income Bracket | # Families | Median Income |
| 2-Person Families | 192 (40.3%) | $81,250 |
| 3-Person Families | 87 (18.3%) | $122,083 |
| 4-Person Families | 86 (18.1%) | $127,632 |
| 5-Person Families | 99 (20.8%) | $193,650 |
| 6-Person Families | 8 (1.7%) | $0 |
| 7+ Person Families | 4 (0.8%) | $0 |
| Total | 476 (100.0%) | $125,100 |
Family Income by Number of Earners in Armada
The median family income in Armada is $125,100, with families comprising 2 earners (229) having the highest median family income of $132,375, while families with no earners (40) have the lowest median family income of $52,222, accounting for 48.1% and 8.4% of families, respectively.
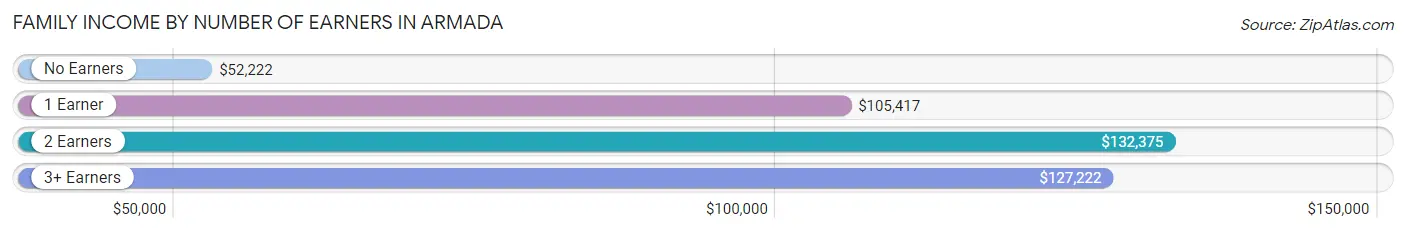
| Number of Earners | # Families | Median Income |
| No Earners | 40 (8.4%) | $52,222 |
| 1 Earner | 145 (30.5%) | $105,417 |
| 2 Earners | 229 (48.1%) | $132,375 |
| 3+ Earners | 62 (13.0%) | $127,222 |
| Total | 476 (100.0%) | $125,100 |
Household Income in Armada
Household Income Brackets in Armada
With 170 households falling in the category, the $100,000 to $149,999 income range is the most frequent in Armada, accounting for 25.9% of all households. In contrast, only 5 households (0.8%) fall into the less than $10,000 income bracket, making it the least populous group.
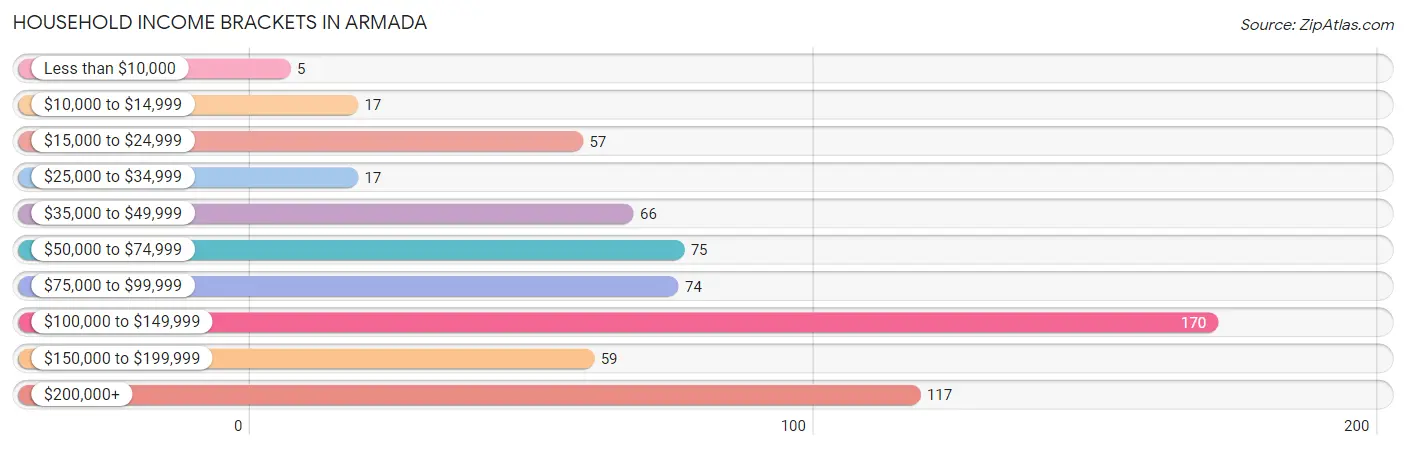
| Income Bracket | # Households | % Households |
| Less than $10,000 | 5 | 0.8% |
| $10,000 to $14,999 | 17 | 2.6% |
| $15,000 to $24,999 | 57 | 8.7% |
| $25,000 to $34,999 | 17 | 2.6% |
| $35,000 to $49,999 | 66 | 10.0% |
| $50,000 to $74,999 | 75 | 11.4% |
| $75,000 to $99,999 | 74 | 11.3% |
| $100,000 to $149,999 | 170 | 25.9% |
| $150,000 to $199,999 | 59 | 9.0% |
| $200,000+ | 117 | 17.8% |
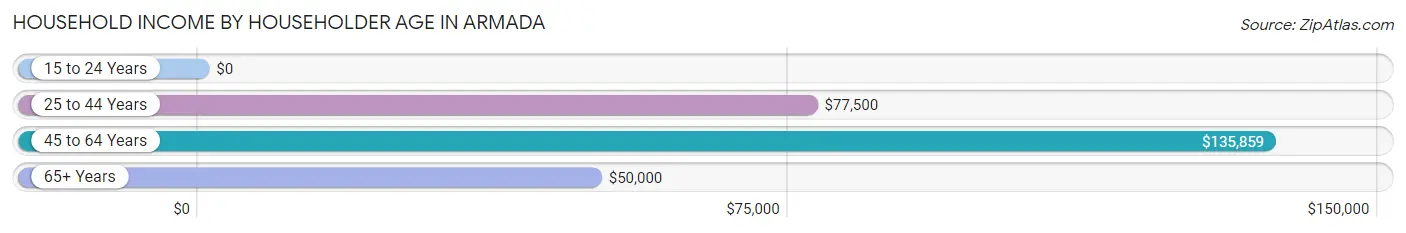
Household Income by Householder Age in Armada
The median household income in Armada is $105,774, with the highest median household income of $135,859 found in the 45 to 64 years age bracket for the primary householder. A total of 335 households (51.0%) fall into this category. Meanwhile, the 15 to 24 years age bracket for the primary householder has the lowest median household income of $0, with 12 households (1.8%) in this group.
| Income Bracket | # Households | Median Income |
| 15 to 24 Years | 12 (1.8%) | $0 |
| 25 to 44 Years | 172 (26.2%) | $77,500 |
| 45 to 64 Years | 335 (51.0%) | $135,859 |
| 65+ Years | 138 (21.0%) | $50,000 |
| Total | 657 (100.0%) | $105,774 |
Poverty in Armada
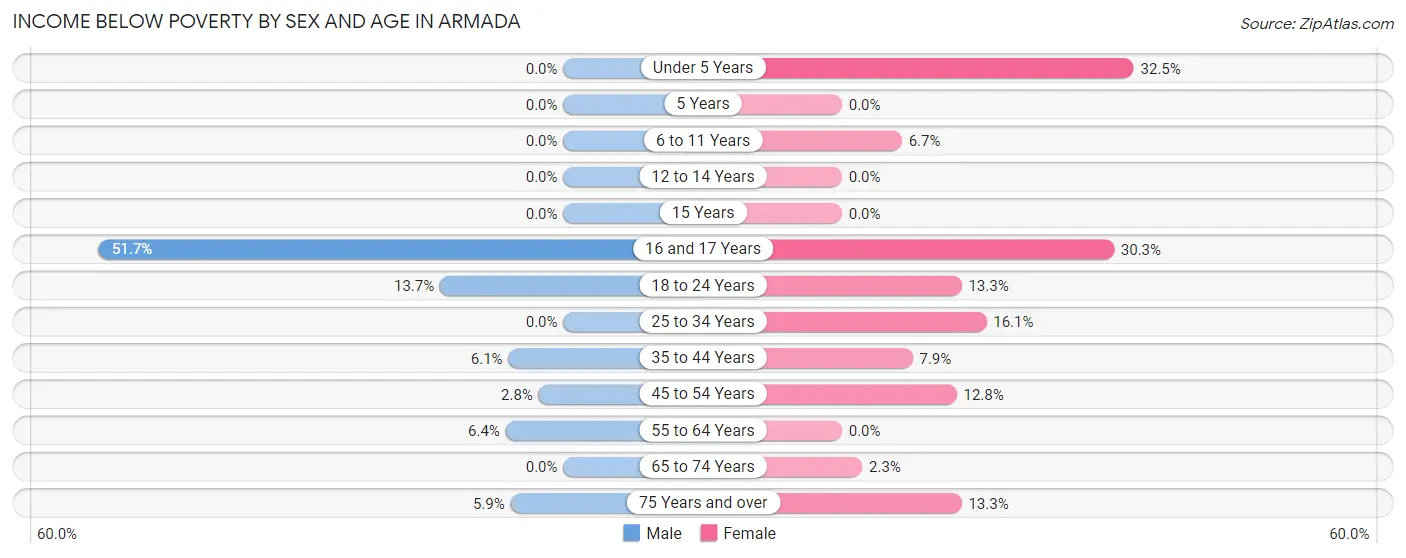
Income Below Poverty by Sex and Age in Armada
With 5.0% poverty level for males and 9.2% for females among the residents of Armada, 16 and 17 year old males and under 5 year old females are the most vulnerable to poverty, with 15 males (51.7%) and 13 females (32.5%) in their respective age groups living below the poverty level.
| Age Bracket | Male | Female |
| Under 5 Years | 0 (0.0%) | 13 (32.5%) |
| 5 Years | 0 (0.0%) | 0 (0.0%) |
| 6 to 11 Years | 0 (0.0%) | 10 (6.7%) |
| 12 to 14 Years | 0 (0.0%) | 0 (0.0%) |
| 15 Years | 0 (0.0%) | 0 (0.0%) |
| 16 and 17 Years | 15 (51.7%) | 10 (30.3%) |
| 18 to 24 Years | 7 (13.7%) | 6 (13.3%) |
| 25 to 34 Years | 0 (0.0%) | 14 (16.1%) |
| 35 to 44 Years | 12 (6.1%) | 13 (7.9%) |
| 45 to 54 Years | 3 (2.8%) | 17 (12.8%) |
| 55 to 64 Years | 7 (6.4%) | 0 (0.0%) |
| 65 to 74 Years | 0 (0.0%) | 3 (2.3%) |
| 75 Years and over | 2 (5.9%) | 10 (13.3%) |
| Total | 46 (5.0%) | 96 (9.2%) |
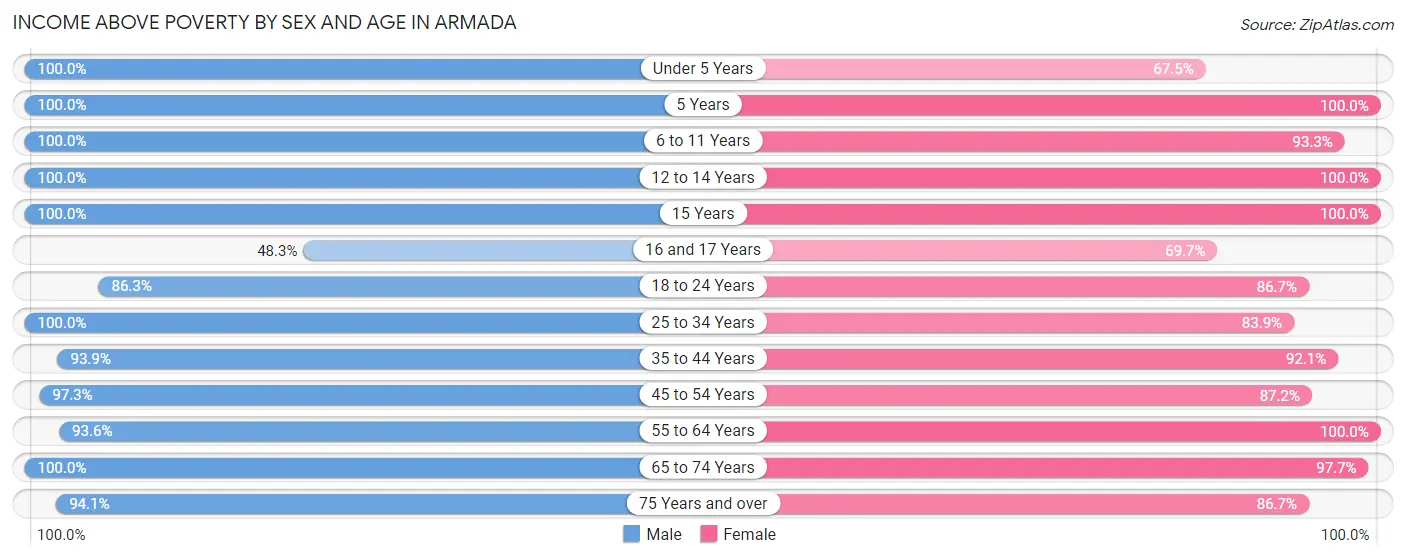
Income Above Poverty by Sex and Age in Armada
According to the poverty statistics in Armada, males aged under 5 years and females aged 5 years are the age groups that are most secure financially, with 100.0% of males and 100.0% of females in these age groups living above the poverty line.
| Age Bracket | Male | Female |
| Under 5 Years | 34 (100.0%) | 27 (67.5%) |
| 5 Years | 5 (100.0%) | 2 (100.0%) |
| 6 to 11 Years | 178 (100.0%) | 140 (93.3%) |
| 12 to 14 Years | 23 (100.0%) | 12 (100.0%) |
| 15 Years | 9 (100.0%) | 16 (100.0%) |
| 16 and 17 Years | 14 (48.3%) | 23 (69.7%) |
| 18 to 24 Years | 44 (86.3%) | 39 (86.7%) |
| 25 to 34 Years | 81 (100.0%) | 73 (83.9%) |
| 35 to 44 Years | 184 (93.9%) | 152 (92.1%) |
| 45 to 54 Years | 106 (97.3%) | 116 (87.2%) |
| 55 to 64 Years | 102 (93.6%) | 152 (100.0%) |
| 65 to 74 Years | 65 (100.0%) | 130 (97.7%) |
| 75 Years and over | 32 (94.1%) | 65 (86.7%) |
| Total | 877 (95.0%) | 947 (90.8%) |
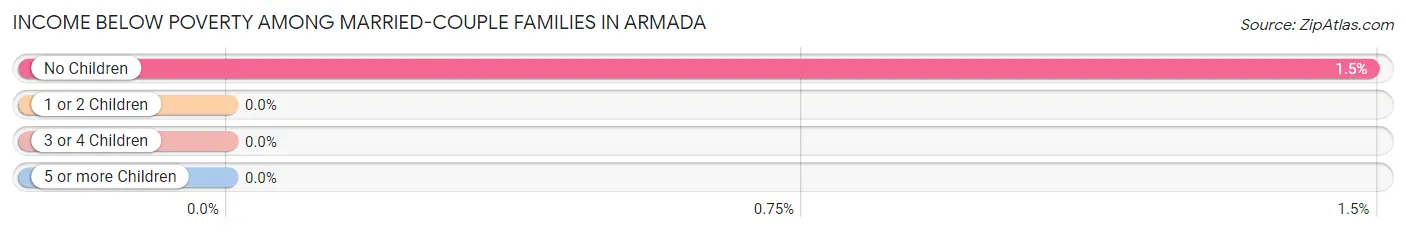
Income Below Poverty Among Married-Couple Families in Armada
The poverty statistics for married-couple families in Armada show that 0.9% or 3 of the total 324 families live below the poverty line. Families with no children have the highest poverty rate of 1.5%, comprising of 3 families. On the other hand, families with 1 or 2 children have the lowest poverty rate of 0.0%, which includes 0 families.
| Children | Above Poverty | Below Poverty |
| No Children | 199 (98.5%) | 3 (1.5%) |
| 1 or 2 Children | 96 (100.0%) | 0 (0.0%) |
| 3 or 4 Children | 26 (100.0%) | 0 (0.0%) |
| 5 or more Children | 0 (0.0%) | 0 (0.0%) |
| Total | 321 (99.1%) | 3 (0.9%) |
Income Below Poverty Among Single-Parent Households in Armada
According to the poverty data in Armada, 38.9% or 7 single-father households and 24.6% or 33 single-mother households are living below the poverty line. Among single-father households, those with 1 or 2 children have the highest poverty rate, with 7 households (100.0%) experiencing poverty. Likewise, among single-mother households, those with 1 or 2 children have the highest poverty rate, with 33 households (29.7%) falling below the poverty line.
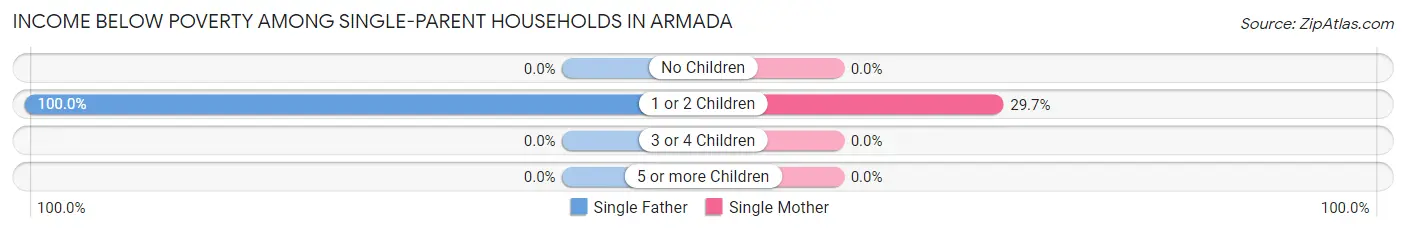
| Children | Single Father | Single Mother |
| No Children | 0 (0.0%) | 0 (0.0%) |
| 1 or 2 Children | 7 (100.0%) | 33 (29.7%) |
| 3 or 4 Children | 0 (0.0%) | 0 (0.0%) |
| 5 or more Children | 0 (0.0%) | 0 (0.0%) |
| Total | 7 (38.9%) | 33 (24.6%) |
Income Below Poverty Among Married-Couple vs Single-Parent Households in Armada
The poverty data for Armada shows that 3 of the married-couple family households (0.9%) and 40 of the single-parent households (26.3%) are living below the poverty level. Within the married-couple family households, those with no children have the highest poverty rate, with 3 households (1.5%) falling below the poverty line. Among the single-parent households, those with 1 or 2 children have the highest poverty rate, with 40 household (33.9%) living below poverty.
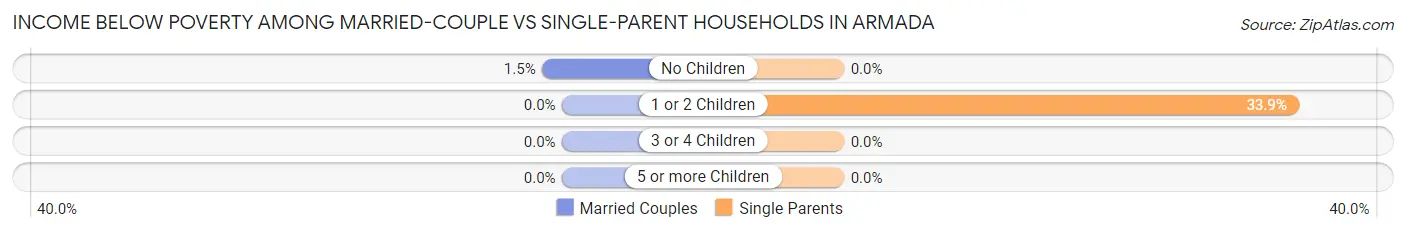
| Children | Married-Couple Families | Single-Parent Households |
| No Children | 3 (1.5%) | 0 (0.0%) |
| 1 or 2 Children | 0 (0.0%) | 40 (33.9%) |
| 3 or 4 Children | 0 (0.0%) | 0 (0.0%) |
| 5 or more Children | 0 (0.0%) | 0 (0.0%) |
| Total | 3 (0.9%) | 40 (26.3%) |
Race in Armada
The most populous races in Armada are White / Caucasian (1,934 | 94.9%), Two or more Races (86 | 4.2%), and Black / African American (10 | 0.5%).
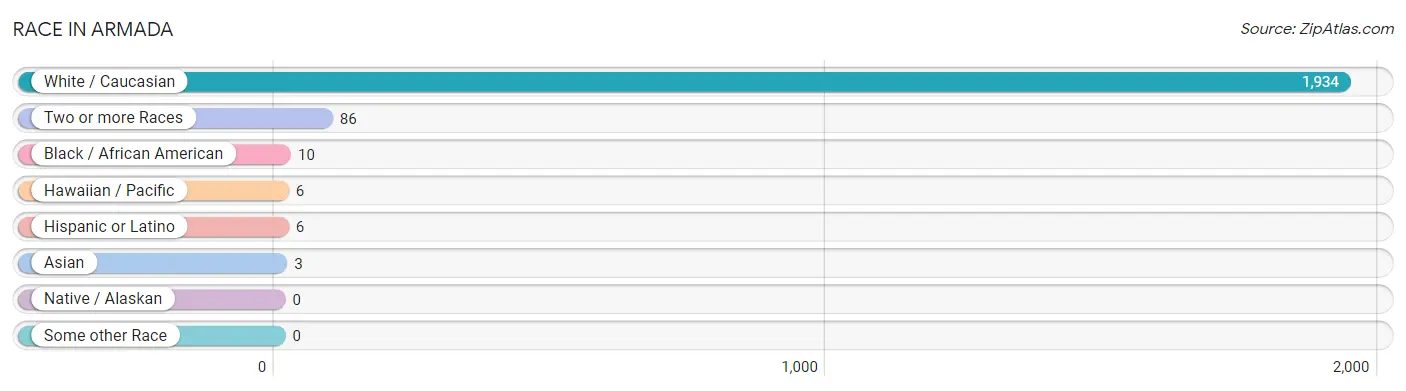
| Race | # Population | % Population |
| Asian | 3 | 0.2% |
| Black / African American | 10 | 0.5% |
| Hawaiian / Pacific | 6 | 0.3% |
| Hispanic or Latino | 6 | 0.3% |
| Native / Alaskan | 0 | 0.0% |
| White / Caucasian | 1,934 | 94.9% |
| Two or more Races | 86 | 4.2% |
| Some other Race | 0 | 0.0% |
| Total | 2,039 | 100.0% |
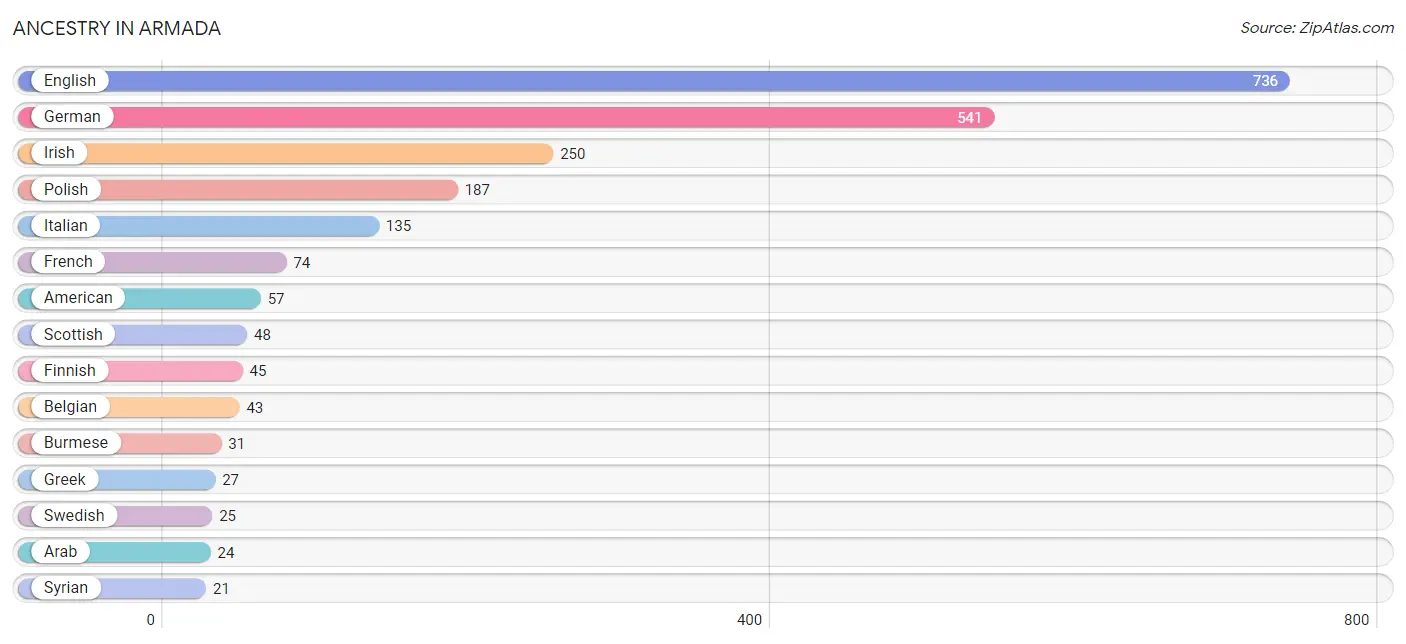
Ancestry in Armada
The most populous ancestries reported in Armada are English (736 | 36.1%), German (541 | 26.5%), Irish (250 | 12.3%), Polish (187 | 9.2%), and Italian (135 | 6.6%), together accounting for 90.7% of all Armada residents.
| Ancestry | # Population | % Population |
| African | 20 | 1.0% |
| American | 57 | 2.8% |
| Arab | 24 | 1.2% |
| Armenian | 3 | 0.2% |
| Belgian | 43 | 2.1% |
| Blackfeet | 3 | 0.2% |
| British | 3 | 0.2% |
| Burmese | 31 | 1.5% |
| Cherokee | 6 | 0.3% |
| Cheyenne | 3 | 0.2% |
| Czech | 5 | 0.3% |
| Dutch | 4 | 0.2% |
| English | 736 | 36.1% |
| European | 5 | 0.3% |
| Finnish | 45 | 2.2% |
| French | 74 | 3.6% |
| French Canadian | 11 | 0.5% |
| German | 541 | 26.5% |
| Greek | 27 | 1.3% |
| Hungarian | 7 | 0.3% |
| Irish | 250 | 12.3% |
| Italian | 135 | 6.6% |
| Lebanese | 3 | 0.2% |
| Macedonian | 6 | 0.3% |
| Mexican | 6 | 0.3% |
| Native Hawaiian | 15 | 0.7% |
| Norwegian | 7 | 0.3% |
| Polish | 187 | 9.2% |
| Romanian | 9 | 0.4% |
| Russian | 4 | 0.2% |
| Samoan | 6 | 0.3% |
| Scotch-Irish | 7 | 0.3% |
| Scottish | 48 | 2.4% |
| Slovak | 5 | 0.3% |
| Subsaharan African | 20 | 1.0% |
| Swedish | 25 | 1.2% |
| Syrian | 21 | 1.0% |
| Ukrainian | 9 | 0.4% |
| Welsh | 21 | 1.0% | View All 39 Rows |
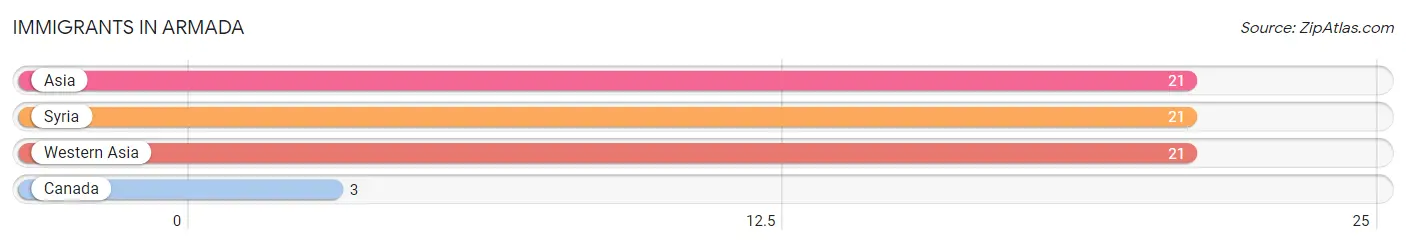
Immigrants in Armada
The most numerous immigrant groups reported in Armada came from Asia (21 | 1.0%), Syria (21 | 1.0%), Western Asia (21 | 1.0%), and Canada (3 | 0.2%), together accounting for 3.2% of all Armada residents.
| Immigration Origin | # Population | % Population |
| Asia | 21 | 1.0% |
| Canada | 3 | 0.2% |
| Syria | 21 | 1.0% |
| Western Asia | 21 | 1.0% | View All 4 Rows |
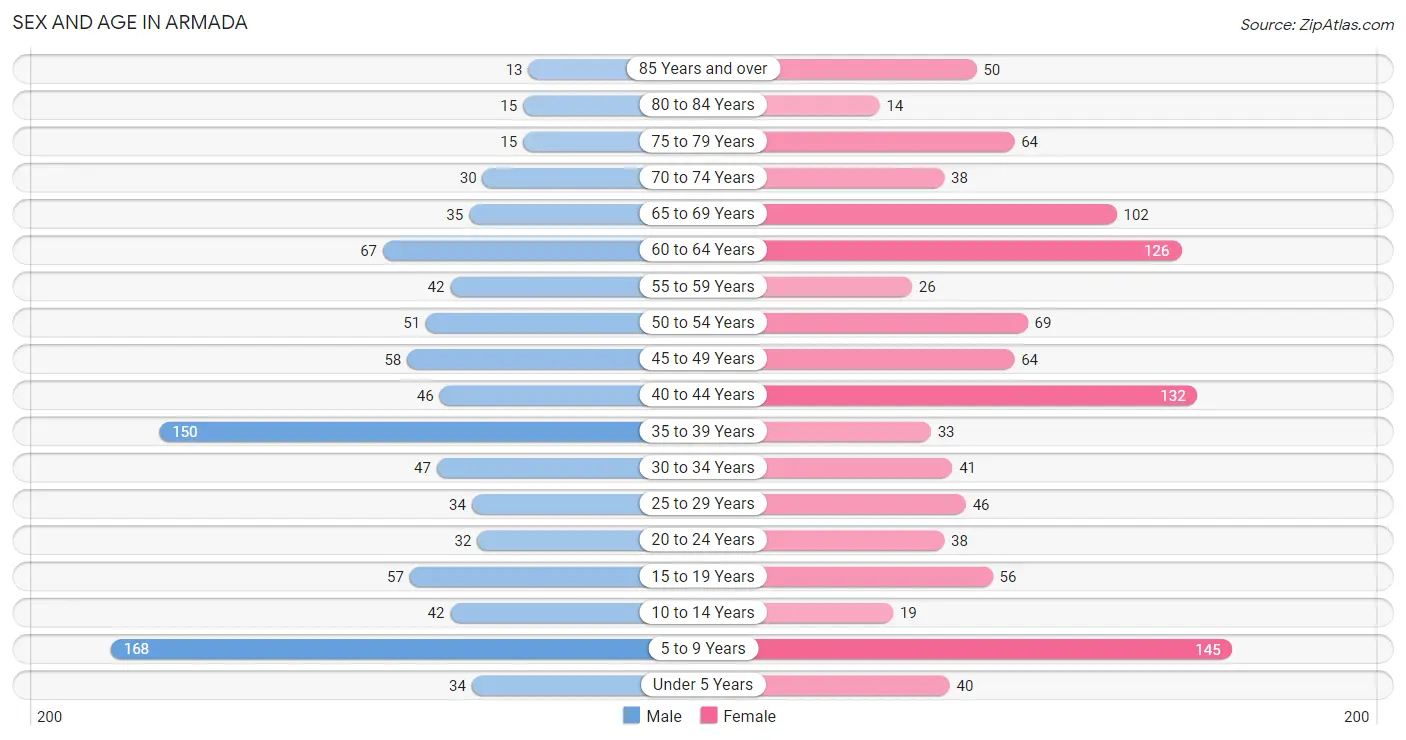
Sex and Age in Armada
Sex and Age in Armada
The most populous age groups in Armada are 5 to 9 Years (168 | 17.9%) for men and 5 to 9 Years (145 | 13.2%) for women.
| Age Bracket | Male | Female |
| Under 5 Years | 34 (3.6%) | 40 (3.6%) |
| 5 to 9 Years | 168 (17.9%) | 145 (13.2%) |
| 10 to 14 Years | 42 (4.5%) | 19 (1.7%) |
| 15 to 19 Years | 57 (6.1%) | 56 (5.1%) |
| 20 to 24 Years | 32 (3.4%) | 38 (3.5%) |
| 25 to 29 Years | 34 (3.6%) | 46 (4.2%) |
| 30 to 34 Years | 47 (5.0%) | 41 (3.7%) |
| 35 to 39 Years | 150 (16.0%) | 33 (3.0%) |
| 40 to 44 Years | 46 (4.9%) | 132 (12.0%) |
| 45 to 49 Years | 58 (6.2%) | 64 (5.8%) |
| 50 to 54 Years | 51 (5.4%) | 69 (6.3%) |
| 55 to 59 Years | 42 (4.5%) | 26 (2.4%) |
| 60 to 64 Years | 67 (7.2%) | 126 (11.4%) |
| 65 to 69 Years | 35 (3.7%) | 102 (9.2%) |
| 70 to 74 Years | 30 (3.2%) | 38 (3.5%) |
| 75 to 79 Years | 15 (1.6%) | 64 (5.8%) |
| 80 to 84 Years | 15 (1.6%) | 14 (1.3%) |
| 85 Years and over | 13 (1.4%) | 50 (4.5%) |
| Total | 936 (100.0%) | 1,103 (100.0%) |
Families and Households in Armada
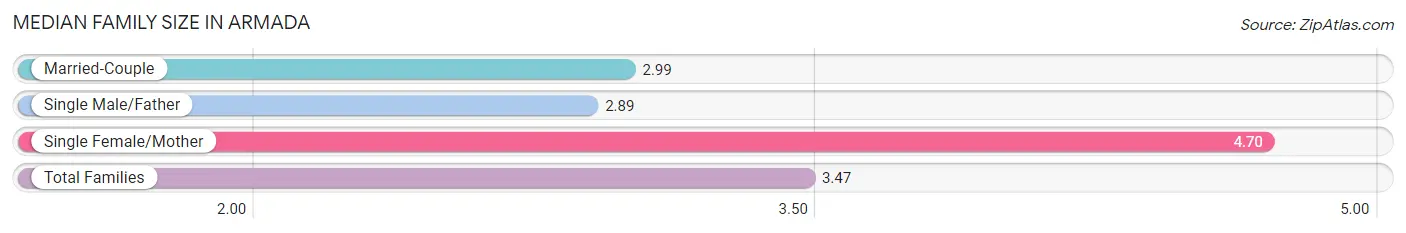
Median Family Size in Armada
The median family size in Armada is 3.47 persons per family, with single female/mother families (134 | 28.1%) accounting for the largest median family size of 4.7 persons per family. On the other hand, single male/father families (18 | 3.8%) represent the smallest median family size with 2.89 persons per family.
| Family Type | # Families | Family Size |
| Married-Couple | 324 (68.1%) | 2.99 |
| Single Male/Father | 18 (3.8%) | 2.89 |
| Single Female/Mother | 134 (28.1%) | 4.70 |
| Total Families | 476 (100.0%) | 3.47 |
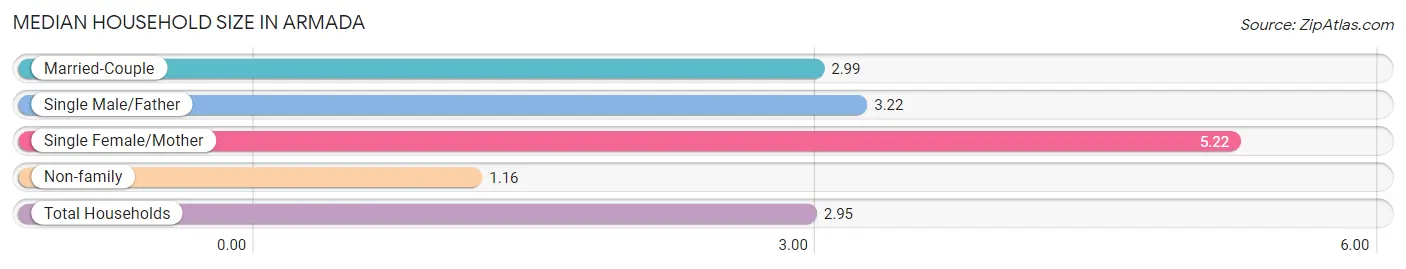
Median Household Size in Armada
The median household size in Armada is 2.95 persons per household, with single female/mother households (134 | 20.4%) accounting for the largest median household size of 5.22 persons per household. non-family households (181 | 27.6%) represent the smallest median household size with 1.16 persons per household.
| Household Type | # Households | Household Size |
| Married-Couple | 324 (49.3%) | 2.99 |
| Single Male/Father | 18 (2.7%) | 3.22 |
| Single Female/Mother | 134 (20.4%) | 5.22 |
| Non-family | 181 (27.6%) | 1.16 |
| Total Households | 657 (100.0%) | 2.95 |
Household Size by Marriage Status in Armada
Out of a total of 657 households in Armada, 476 (72.5%) are family households, while 181 (27.6%) are nonfamily households. The most numerous type of family households are 2-person households, comprising 184, and the most common type of nonfamily households are 1-person households, comprising 158.
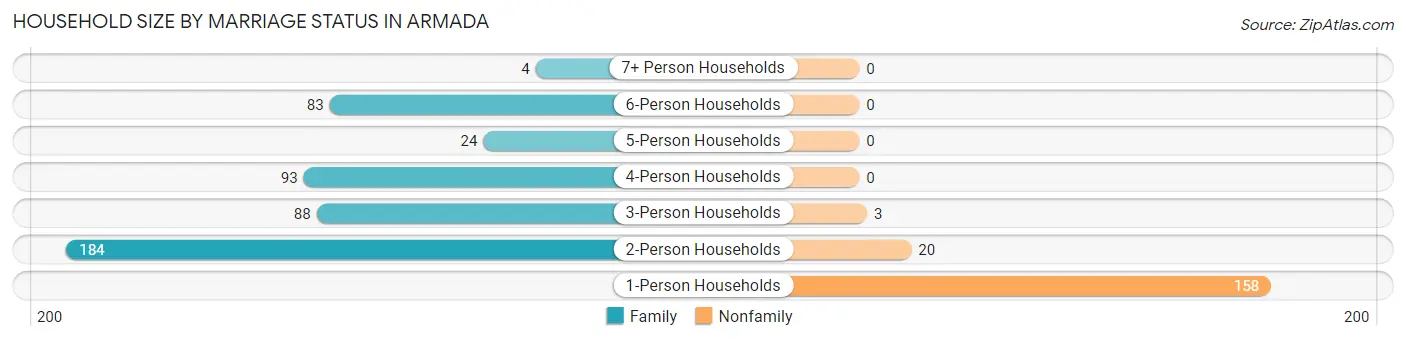
| Household Size | Family Households | Nonfamily Households |
| 1-Person Households | - | 158 (24.0%) |
| 2-Person Households | 184 (28.0%) | 20 (3.0%) |
| 3-Person Households | 88 (13.4%) | 3 (0.5%) |
| 4-Person Households | 93 (14.2%) | 0 (0.0%) |
| 5-Person Households | 24 (3.6%) | 0 (0.0%) |
| 6-Person Households | 83 (12.6%) | 0 (0.0%) |
| 7+ Person Households | 4 (0.6%) | 0 (0.0%) |
| Total | 476 (72.5%) | 181 (27.6%) |
Female Fertility in Armada
Fertility by Age in Armada
Average fertility rate in Armada is 38.0 births per 1,000 women. Women in the age bracket of 20 to 34 years have the highest fertility rate with 128.0 births per 1,000 women. Women in the age bracket of 20 to 34 years acount for 100.0% of all women with births.
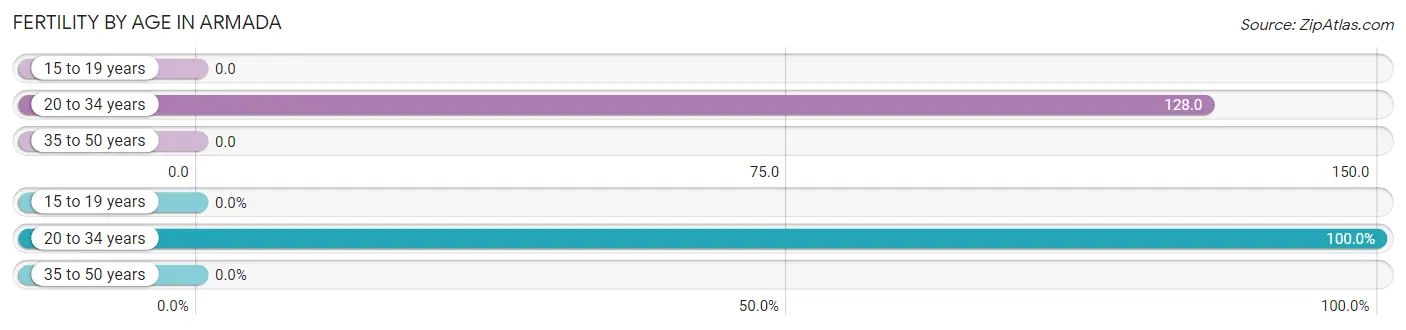
| Age Bracket | Women with Births | Births / 1,000 Women |
| 15 to 19 years | 0 (0.0%) | 0.0 |
| 20 to 34 years | 16 (100.0%) | 128.0 |
| 35 to 50 years | 0 (0.0%) | 0.0 |
| Total | 16 (100.0%) | 38.0 |
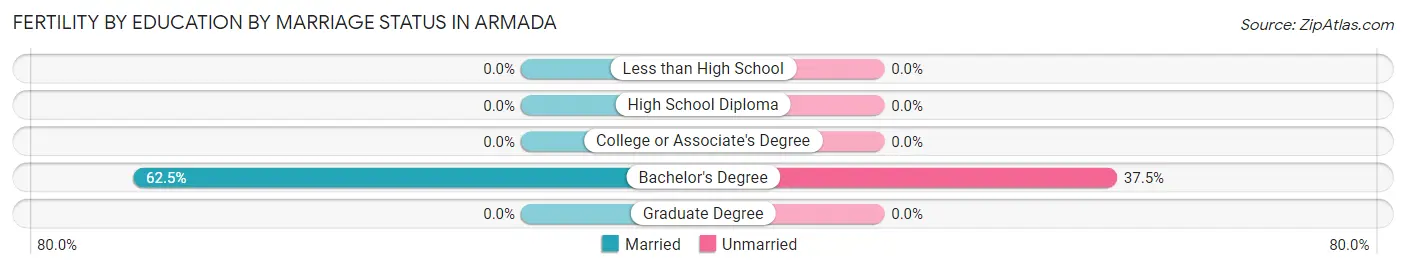
Fertility by Age by Marriage Status in Armada
62.5% of women with births (16) in Armada are married. The highest percentage of unmarried women with births falls into 20 to 34 years age bracket with 37.5% of them unmarried at the time of birth, while the lowest percentage of unmarried women with births belong to 20 to 34 years age bracket with 37.5% of them unmarried.
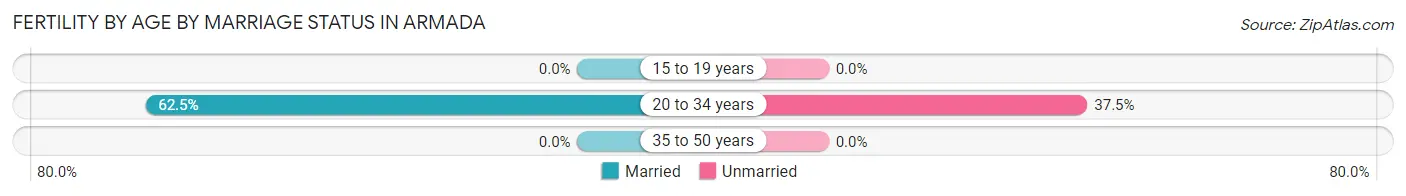
| Age Bracket | Married | Unmarried |
| 15 to 19 years | 0 (0.0%) | 0 (0.0%) |
| 20 to 34 years | 10 (62.5%) | 6 (37.5%) |
| 35 to 50 years | 0 (0.0%) | 0 (0.0%) |
| Total | 10 (62.5%) | 6 (37.5%) |
Fertility by Education in Armada
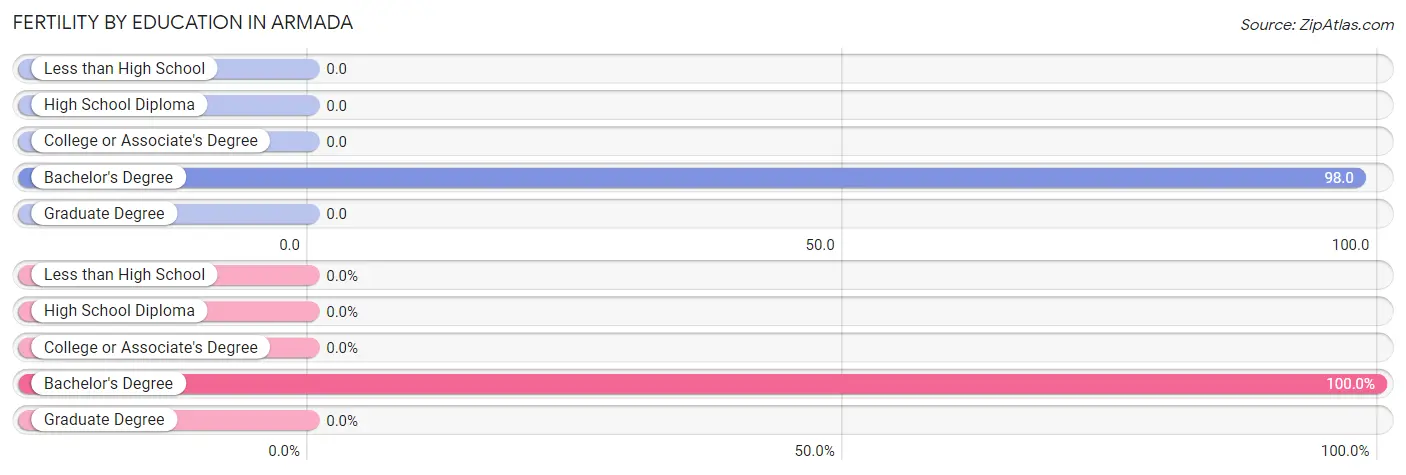
| Educational Attainment | Women with Births | Births / 1,000 Women |
| Less than High School | 0 (0.0%) | 0.0 |
| High School Diploma | 0 (0.0%) | 0.0 |
| College or Associate's Degree | 0 (0.0%) | 0.0 |
| Bachelor's Degree | 16 (100.0%) | 98.0 |
| Graduate Degree | 0 (0.0%) | 0.0 |
| Total | 16 (100.0%) | 38.0 |
Fertility by Education by Marriage Status in Armada
37.5% of women with births in Armada are unmarried. Women with the educational attainment of bachelor's degree are most likely to be married with 62.5% of them married at childbirth, while women with the educational attainment of bachelor's degree are least likely to be married with 37.5% of them unmarried at childbirth.
| Educational Attainment | Married | Unmarried |
| Less than High School | 0 (0.0%) | 0 (0.0%) |
| High School Diploma | 0 (0.0%) | 0 (0.0%) |
| College or Associate's Degree | 0 (0.0%) | 0 (0.0%) |
| Bachelor's Degree | 10 (62.5%) | 6 (37.5%) |
| Graduate Degree | 0 (0.0%) | 0 (0.0%) |
| Total | 10 (62.5%) | 6 (37.5%) |
Employment Characteristics in Armada
Employment by Class of Employer in Armada
Among the 874 employed individuals in Armada, private company employees (640 | 73.2%), local government employees (112 | 12.8%), and not-for-profit organizations (39 | 4.5%) make up the most common classes of employment.
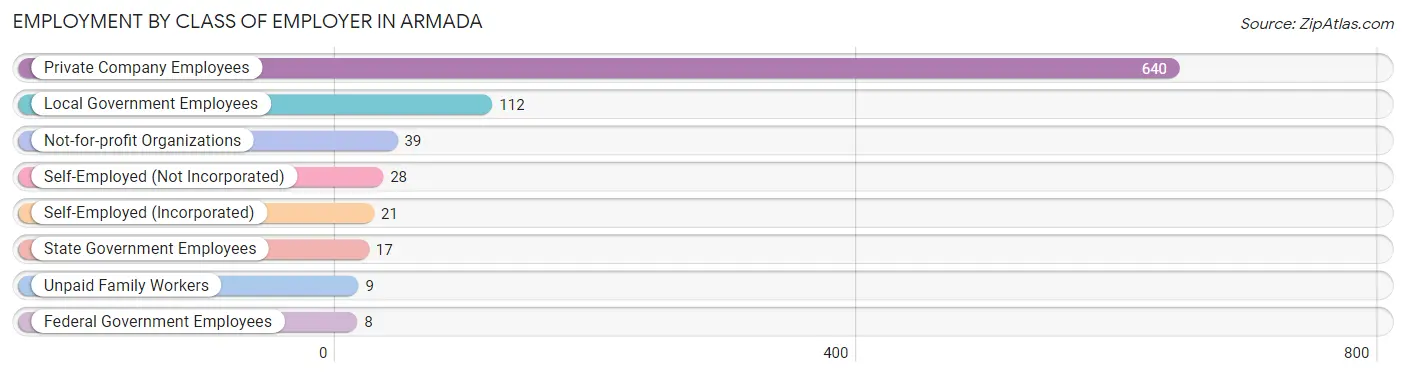
| Employer Class | # Employees | % Employees |
| Private Company Employees | 640 | 73.2% |
| Self-Employed (Incorporated) | 21 | 2.4% |
| Self-Employed (Not Incorporated) | 28 | 3.2% |
| Not-for-profit Organizations | 39 | 4.5% |
| Local Government Employees | 112 | 12.8% |
| State Government Employees | 17 | 1.9% |
| Federal Government Employees | 8 | 0.9% |
| Unpaid Family Workers | 9 | 1.0% |
| Total | 874 | 100.0% |
Employment Status by Age in Armada
According to the labor force statistics for Armada, out of the total population over 16 years of age (1,566), 59.2% or 927 individuals are in the labor force, with 3.1% or 29 of them unemployed. The age group with the highest labor force participation rate is 35 to 44 years, with 91.7% or 331 individuals in the labor force. Within the labor force, the 16 to 19 years age range has the highest percentage of unemployed individuals, with 14.8% or 4 of them being unemployed.
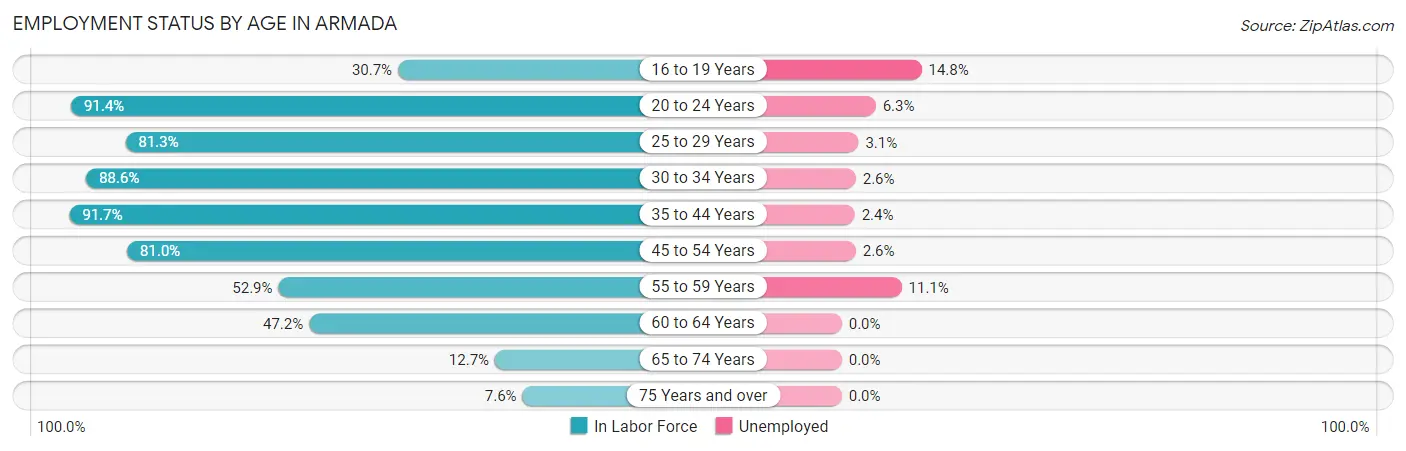
| Age Bracket | In Labor Force | Unemployed |
| 16 to 19 Years | 27 (30.7%) | 4 (14.8%) |
| 20 to 24 Years | 64 (91.4%) | 4 (6.3%) |
| 25 to 29 Years | 65 (81.3%) | 2 (3.1%) |
| 30 to 34 Years | 78 (88.6%) | 2 (2.6%) |
| 35 to 44 Years | 331 (91.7%) | 8 (2.4%) |
| 45 to 54 Years | 196 (81.0%) | 5 (2.6%) |
| 55 to 59 Years | 36 (52.9%) | 4 (11.1%) |
| 60 to 64 Years | 91 (47.2%) | 0 (0.0%) |
| 65 to 74 Years | 26 (12.7%) | 0 (0.0%) |
| 75 Years and over | 13 (7.6%) | 0 (0.0%) |
| Total | 927 (59.2%) | 29 (3.1%) |
Employment Status by Educational Attainment in Armada
According to labor force statistics for Armada, 77.2% of individuals (797) out of the total population between 25 and 64 years of age (1,032) are in the labor force, with 2.6% or 21 of them being unemployed. The group with the highest labor force participation rate are those with the educational attainment of high school diploma, with 94.4% or 186 individuals in the labor force. Within the labor force, individuals with college / associate degree education have the highest percentage of unemployment, with 8.5% or 19 of them being unemployed.
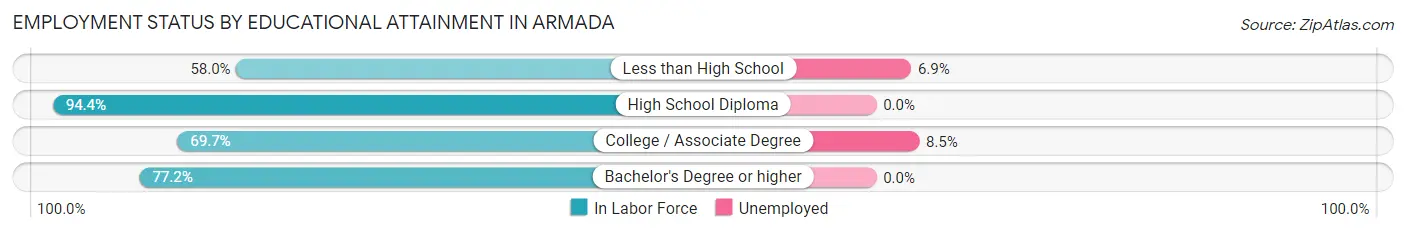
| Educational Attainment | In Labor Force | Unemployed |
| Less than High School | 29 (58.0%) | 3 (6.9%) |
| High School Diploma | 186 (94.4%) | 0 (0.0%) |
| College / Associate Degree | 223 (69.7%) | 27 (8.5%) |
| Bachelor's Degree or higher | 359 (77.2%) | 0 (0.0%) |
| Total | 797 (77.2%) | 27 (2.6%) |
Employment Occupations by Sex in Armada
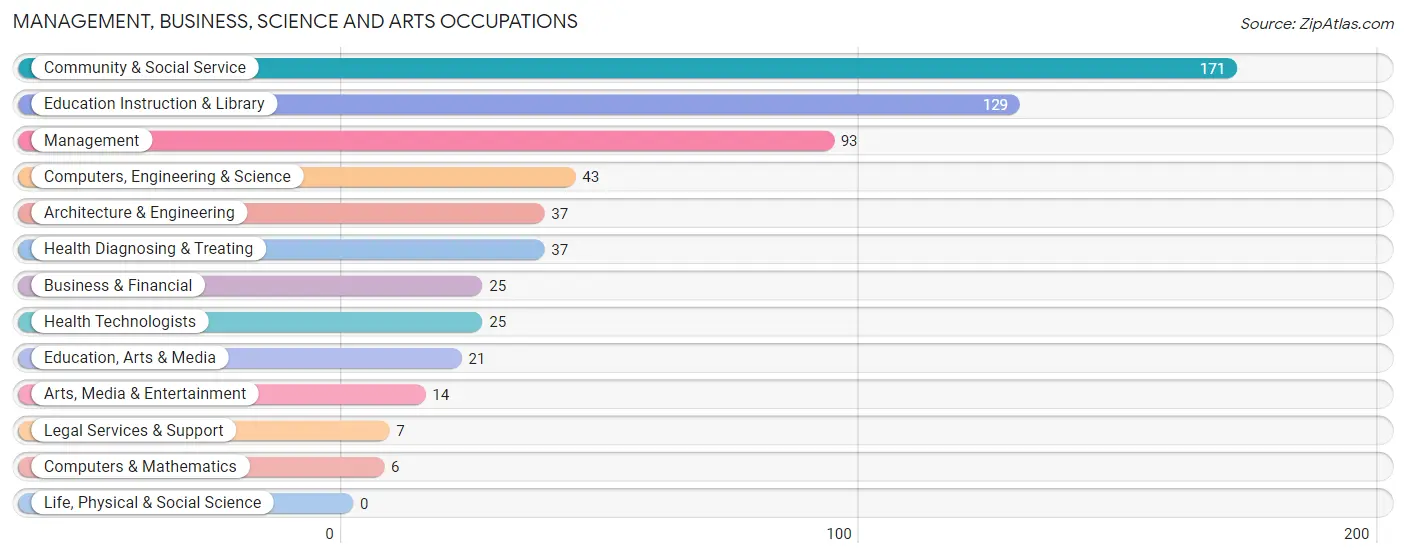
Management, Business, Science and Arts Occupations
The most common Management, Business, Science and Arts occupations in Armada are Community & Social Service (171 | 19.0%), Education Instruction & Library (129 | 14.4%), Management (93 | 10.4%), Computers, Engineering & Science (43 | 4.8%), and Architecture & Engineering (37 | 4.1%).
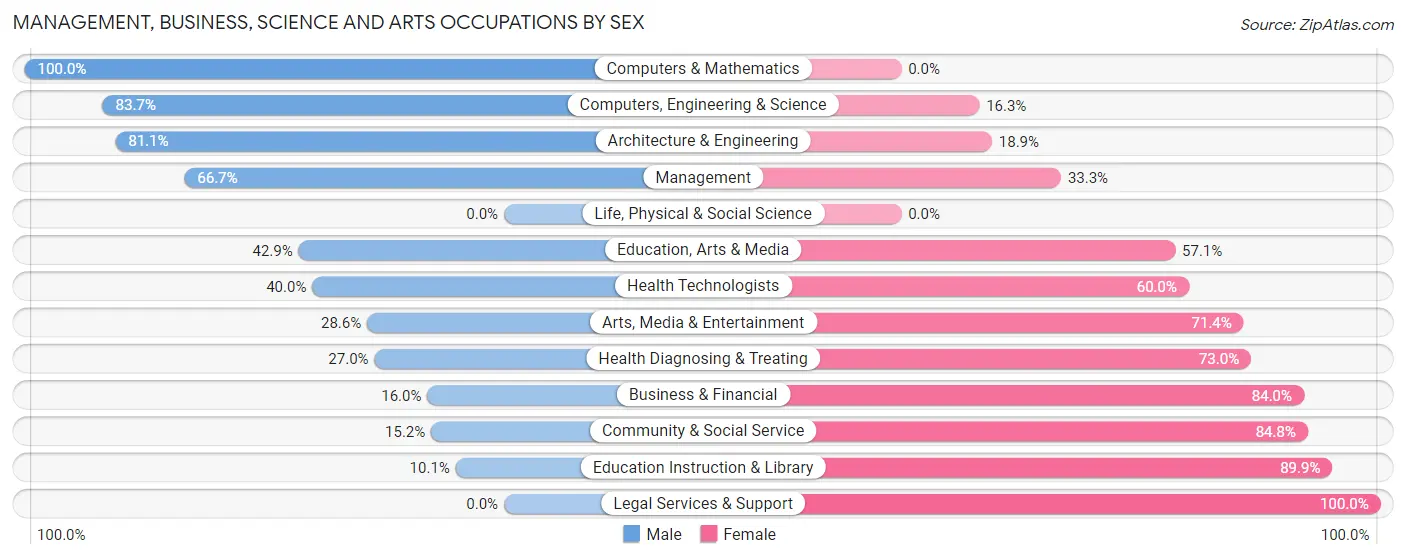
Management, Business, Science and Arts Occupations by Sex
Within the Management, Business, Science and Arts occupations in Armada, the most male-oriented occupations are Computers & Mathematics (100.0%), Computers, Engineering & Science (83.7%), and Architecture & Engineering (81.1%), while the most female-oriented occupations are Legal Services & Support (100.0%), Education Instruction & Library (89.9%), and Community & Social Service (84.8%).
| Occupation | Male | Female |
| Management | 62 (66.7%) | 31 (33.3%) |
| Business & Financial | 4 (16.0%) | 21 (84.0%) |
| Computers, Engineering & Science | 36 (83.7%) | 7 (16.3%) |
| Computers & Mathematics | 6 (100.0%) | 0 (0.0%) |
| Architecture & Engineering | 30 (81.1%) | 7 (18.9%) |
| Life, Physical & Social Science | 0 (0.0%) | 0 (0.0%) |
| Community & Social Service | 26 (15.2%) | 145 (84.8%) |
| Education, Arts & Media | 9 (42.9%) | 12 (57.1%) |
| Legal Services & Support | 0 (0.0%) | 7 (100.0%) |
| Education Instruction & Library | 13 (10.1%) | 116 (89.9%) |
| Arts, Media & Entertainment | 4 (28.6%) | 10 (71.4%) |
| Health Diagnosing & Treating | 10 (27.0%) | 27 (73.0%) |
| Health Technologists | 10 (40.0%) | 15 (60.0%) |
| Total (Category) | 138 (37.4%) | 231 (62.6%) |
| Total (Overall) | 497 (55.3%) | 401 (44.7%) |
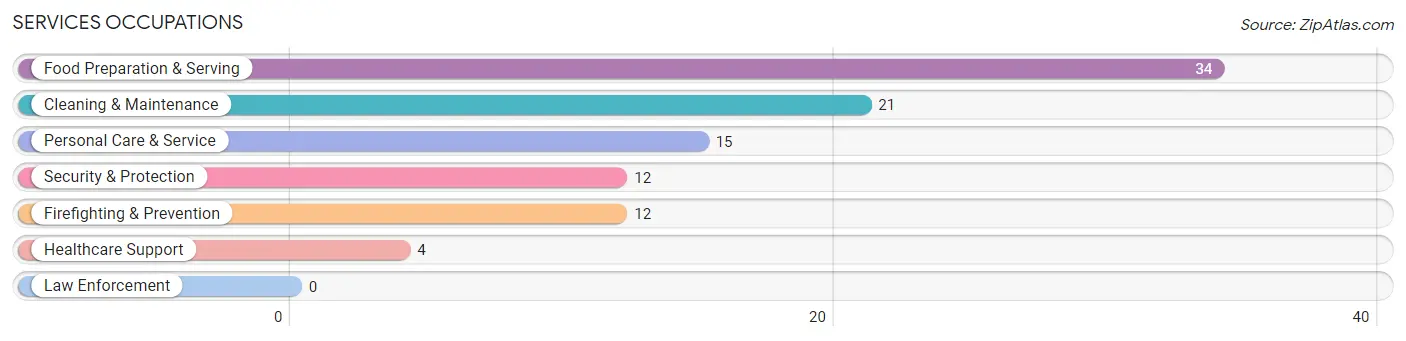
Services Occupations
The most common Services occupations in Armada are Food Preparation & Serving (34 | 3.8%), Cleaning & Maintenance (21 | 2.3%), Personal Care & Service (15 | 1.7%), Security & Protection (12 | 1.3%), and Firefighting & Prevention (12 | 1.3%).
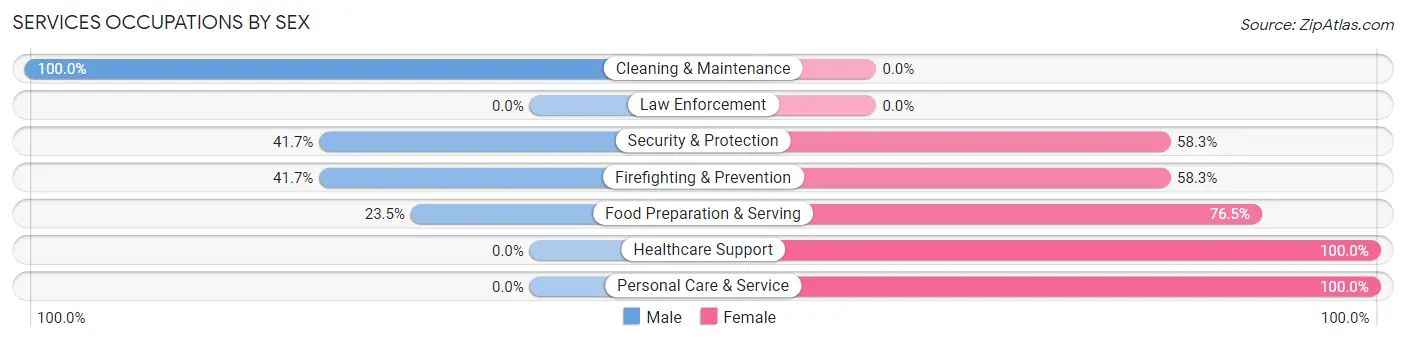
Services Occupations by Sex
Within the Services occupations in Armada, the most male-oriented occupations are Cleaning & Maintenance (100.0%), Security & Protection (41.7%), and Firefighting & Prevention (41.7%), while the most female-oriented occupations are Healthcare Support (100.0%), Personal Care & Service (100.0%), and Food Preparation & Serving (76.5%).
| Occupation | Male | Female |
| Healthcare Support | 0 (0.0%) | 4 (100.0%) |
| Security & Protection | 5 (41.7%) | 7 (58.3%) |
| Firefighting & Prevention | 5 (41.7%) | 7 (58.3%) |
| Law Enforcement | 0 (0.0%) | 0 (0.0%) |
| Food Preparation & Serving | 8 (23.5%) | 26 (76.5%) |
| Cleaning & Maintenance | 21 (100.0%) | 0 (0.0%) |
| Personal Care & Service | 0 (0.0%) | 15 (100.0%) |
| Total (Category) | 34 (39.5%) | 52 (60.5%) |
| Total (Overall) | 497 (55.3%) | 401 (44.7%) |
Sales and Office Occupations
The most common Sales and Office occupations in Armada are Office & Administration (176 | 19.6%), and Sales & Related (55 | 6.1%).
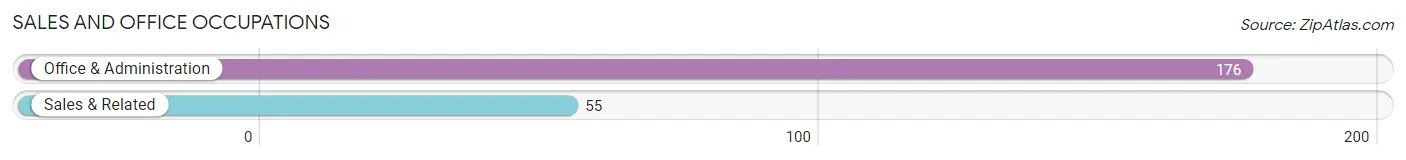
Sales and Office Occupations by Sex
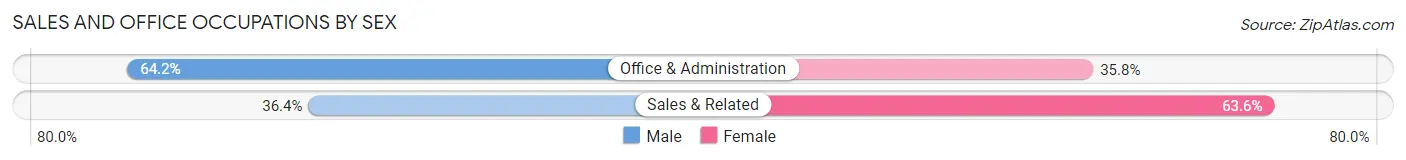
| Occupation | Male | Female |
| Sales & Related | 20 (36.4%) | 35 (63.6%) |
| Office & Administration | 113 (64.2%) | 63 (35.8%) |
| Total (Category) | 133 (57.6%) | 98 (42.4%) |
| Total (Overall) | 497 (55.3%) | 401 (44.7%) |
Natural Resources, Construction and Maintenance Occupations
The most common Natural Resources, Construction and Maintenance occupations in Armada are Installation, Maintenance & Repair (45 | 5.0%), Construction & Extraction (32 | 3.6%), and Farming, Fishing & Forestry (8 | 0.9%).
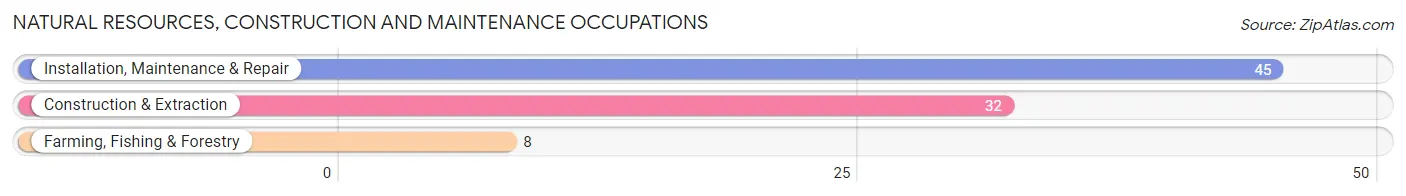
Natural Resources, Construction and Maintenance Occupations by Sex
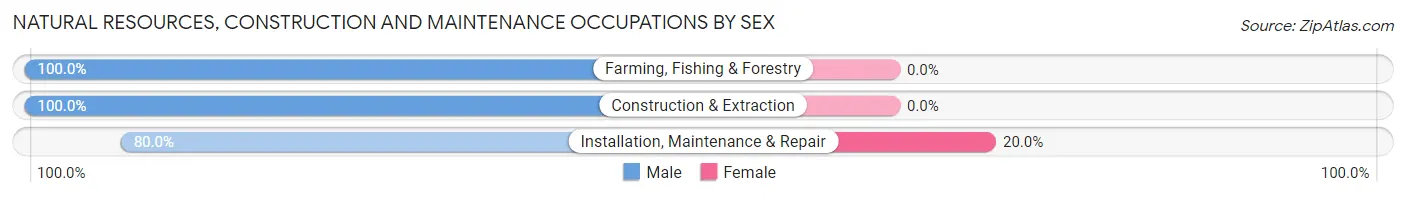
| Occupation | Male | Female |
| Farming, Fishing & Forestry | 8 (100.0%) | 0 (0.0%) |
| Construction & Extraction | 32 (100.0%) | 0 (0.0%) |
| Installation, Maintenance & Repair | 36 (80.0%) | 9 (20.0%) |
| Total (Category) | 76 (89.4%) | 9 (10.6%) |
| Total (Overall) | 497 (55.3%) | 401 (44.7%) |
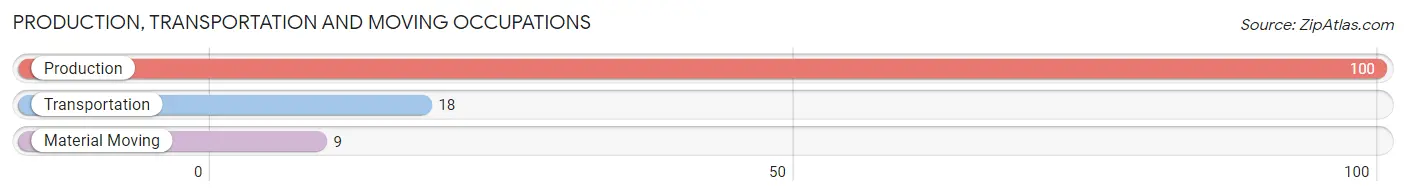
Production, Transportation and Moving Occupations
The most common Production, Transportation and Moving occupations in Armada are Production (100 | 11.1%), Transportation (18 | 2.0%), and Material Moving (9 | 1.0%).
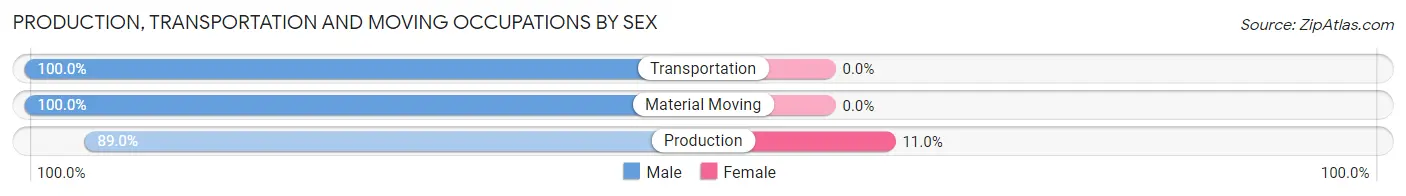
Production, Transportation and Moving Occupations by Sex
| Occupation | Male | Female |
| Production | 89 (89.0%) | 11 (11.0%) |
| Transportation | 18 (100.0%) | 0 (0.0%) |
| Material Moving | 9 (100.0%) | 0 (0.0%) |
| Total (Category) | 116 (91.3%) | 11 (8.7%) |
| Total (Overall) | 497 (55.3%) | 401 (44.7%) |
Employment Industries by Sex in Armada
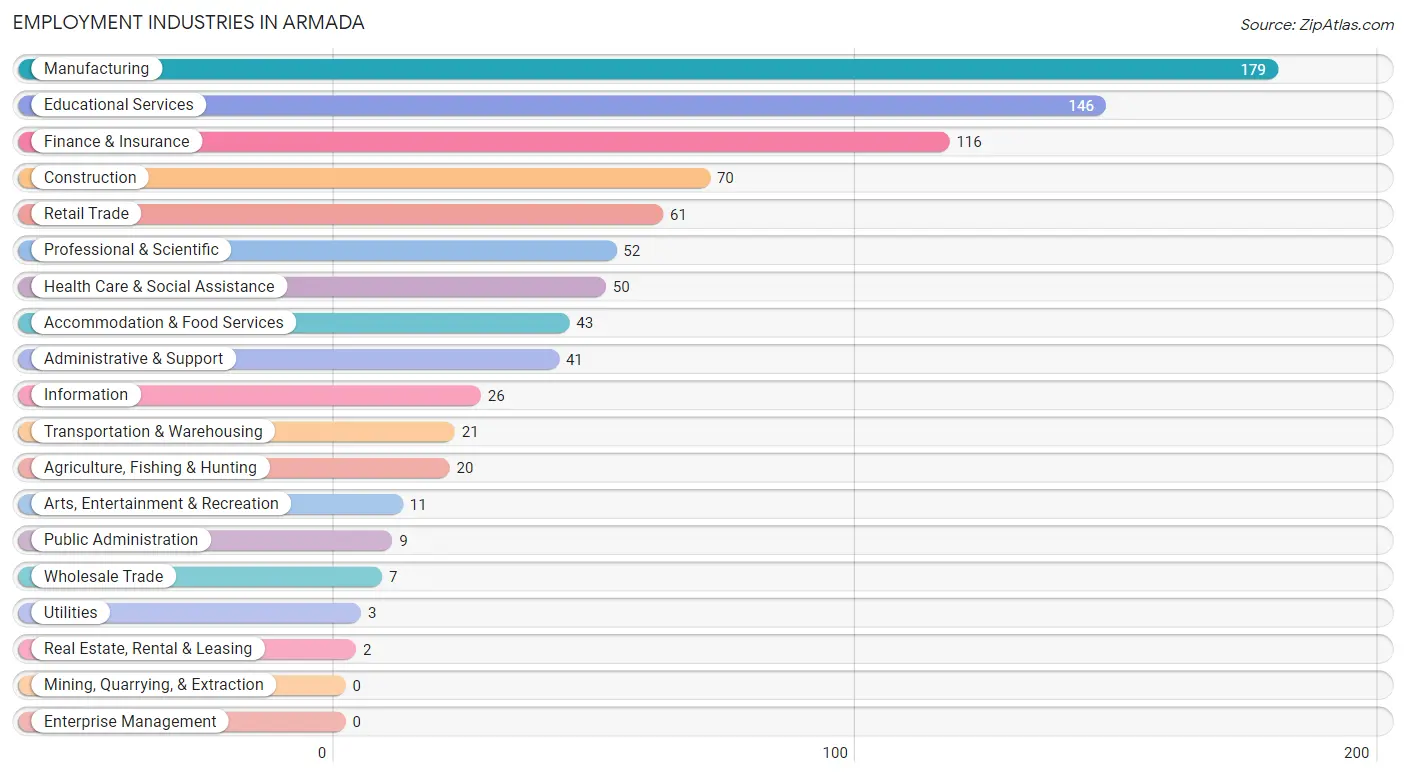
Employment Industries in Armada
The major employment industries in Armada include Manufacturing (179 | 19.9%), Educational Services (146 | 16.3%), Finance & Insurance (116 | 12.9%), Construction (70 | 7.8%), and Retail Trade (61 | 6.8%).
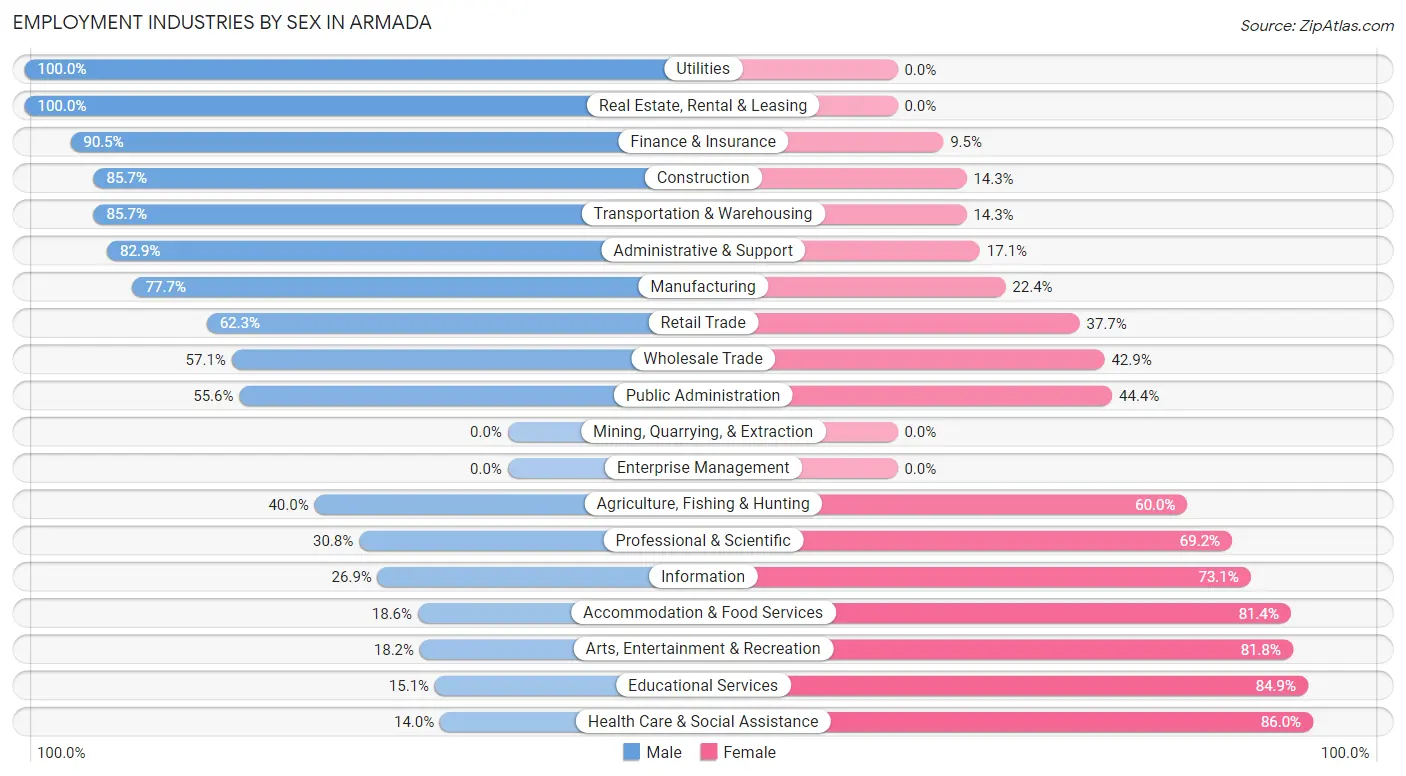
Employment Industries by Sex in Armada
The Armada industries that see more men than women are Utilities (100.0%), Real Estate, Rental & Leasing (100.0%), and Finance & Insurance (90.5%), whereas the industries that tend to have a higher number of women are Health Care & Social Assistance (86.0%), Educational Services (84.9%), and Arts, Entertainment & Recreation (81.8%).
| Industry | Male | Female |
| Agriculture, Fishing & Hunting | 8 (40.0%) | 12 (60.0%) |
| Mining, Quarrying, & Extraction | 0 (0.0%) | 0 (0.0%) |
| Construction | 60 (85.7%) | 10 (14.3%) |
| Manufacturing | 139 (77.6%) | 40 (22.4%) |
| Wholesale Trade | 4 (57.1%) | 3 (42.9%) |
| Retail Trade | 38 (62.3%) | 23 (37.7%) |
| Transportation & Warehousing | 18 (85.7%) | 3 (14.3%) |
| Utilities | 3 (100.0%) | 0 (0.0%) |
| Information | 7 (26.9%) | 19 (73.1%) |
| Finance & Insurance | 105 (90.5%) | 11 (9.5%) |
| Real Estate, Rental & Leasing | 2 (100.0%) | 0 (0.0%) |
| Professional & Scientific | 16 (30.8%) | 36 (69.2%) |
| Enterprise Management | 0 (0.0%) | 0 (0.0%) |
| Administrative & Support | 34 (82.9%) | 7 (17.1%) |
| Educational Services | 22 (15.1%) | 124 (84.9%) |
| Health Care & Social Assistance | 7 (14.0%) | 43 (86.0%) |
| Arts, Entertainment & Recreation | 2 (18.2%) | 9 (81.8%) |
| Accommodation & Food Services | 8 (18.6%) | 35 (81.4%) |
| Public Administration | 5 (55.6%) | 4 (44.4%) |
| Total | 497 (55.3%) | 401 (44.7%) |
Education in Armada
School Enrollment in Armada
The most common levels of schooling among the 644 students in Armada are elementary school (311 | 48.3%), graduate / professional (96 | 14.9%), and high school (90 | 14.0%).
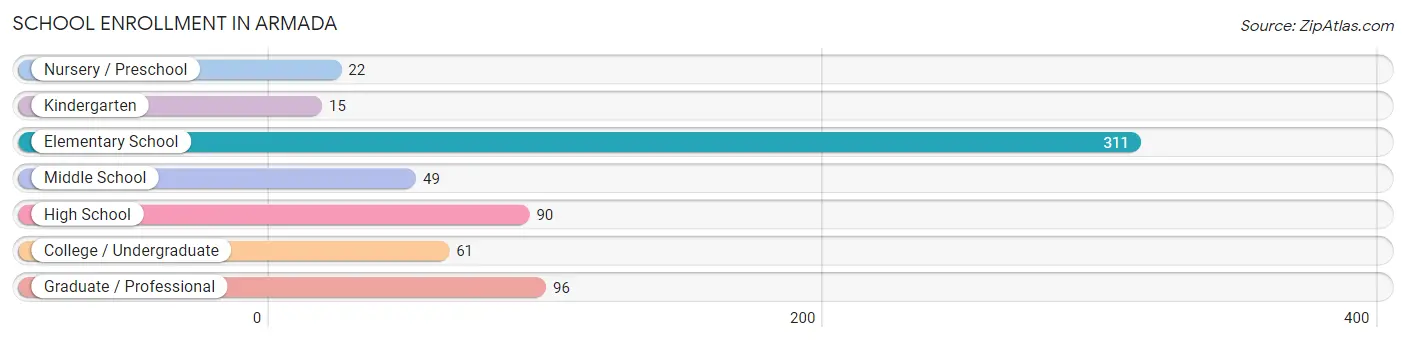
| School Level | # Students | % Students |
| Nursery / Preschool | 22 | 3.4% |
| Kindergarten | 15 | 2.3% |
| Elementary School | 311 | 48.3% |
| Middle School | 49 | 7.6% |
| High School | 90 | 14.0% |
| College / Undergraduate | 61 | 9.5% |
| Graduate / Professional | 96 | 14.9% |
| Total | 644 | 100.0% |
School Enrollment by Age by Funding Source in Armada
Out of a total of 644 students who are enrolled in schools in Armada, 17 (2.6%) attend a private institution, while the remaining 627 (97.4%) are enrolled in public schools. The age group of 3 to 4 year olds has the highest likelihood of being enrolled in private schools, with 9 (36.0% in the age bracket) enrolled. Conversely, the age group of 5 to 9 year old has the lowest likelihood of being enrolled in a private school, with 313 (100.0% in the age bracket) attending a public institution.
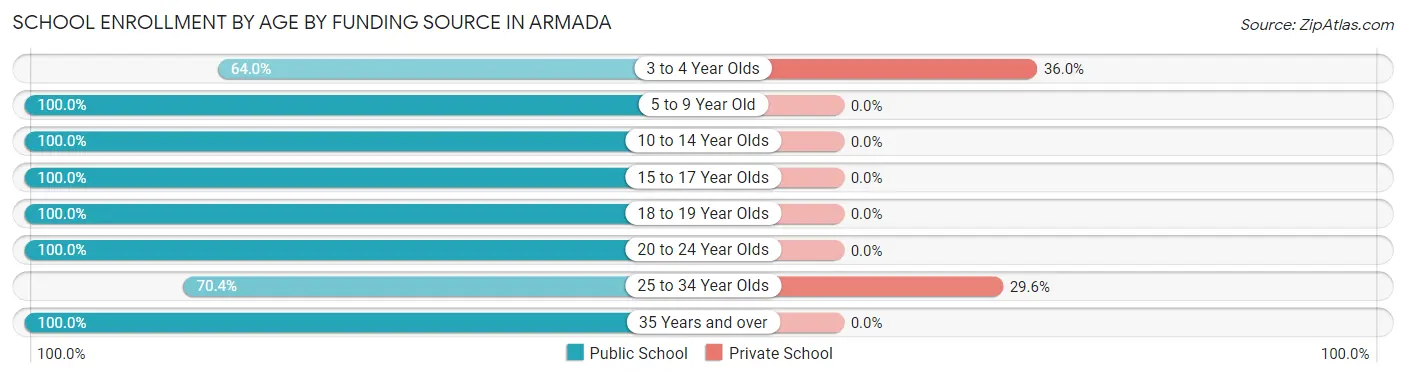
| Age Bracket | Public School | Private School |
| 3 to 4 Year Olds | 16 (64.0%) | 9 (36.0%) |
| 5 to 9 Year Old | 313 (100.0%) | 0 (0.0%) |
| 10 to 14 Year Olds | 61 (100.0%) | 0 (0.0%) |
| 15 to 17 Year Olds | 87 (100.0%) | 0 (0.0%) |
| 18 to 19 Year Olds | 15 (100.0%) | 0 (0.0%) |
| 20 to 24 Year Olds | 16 (100.0%) | 0 (0.0%) |
| 25 to 34 Year Olds | 19 (70.4%) | 8 (29.6%) |
| 35 Years and over | 100 (100.0%) | 0 (0.0%) |
| Total | 627 (97.4%) | 17 (2.6%) |
Educational Attainment by Field of Study in Armada
Education (224 | 38.9%), social sciences (113 | 19.6%), visual & performing arts (69 | 12.0%), science & technology (45 | 7.8%), and business (31 | 5.4%) are the most common fields of study among 576 individuals in Armada who have obtained a bachelor's degree or higher.
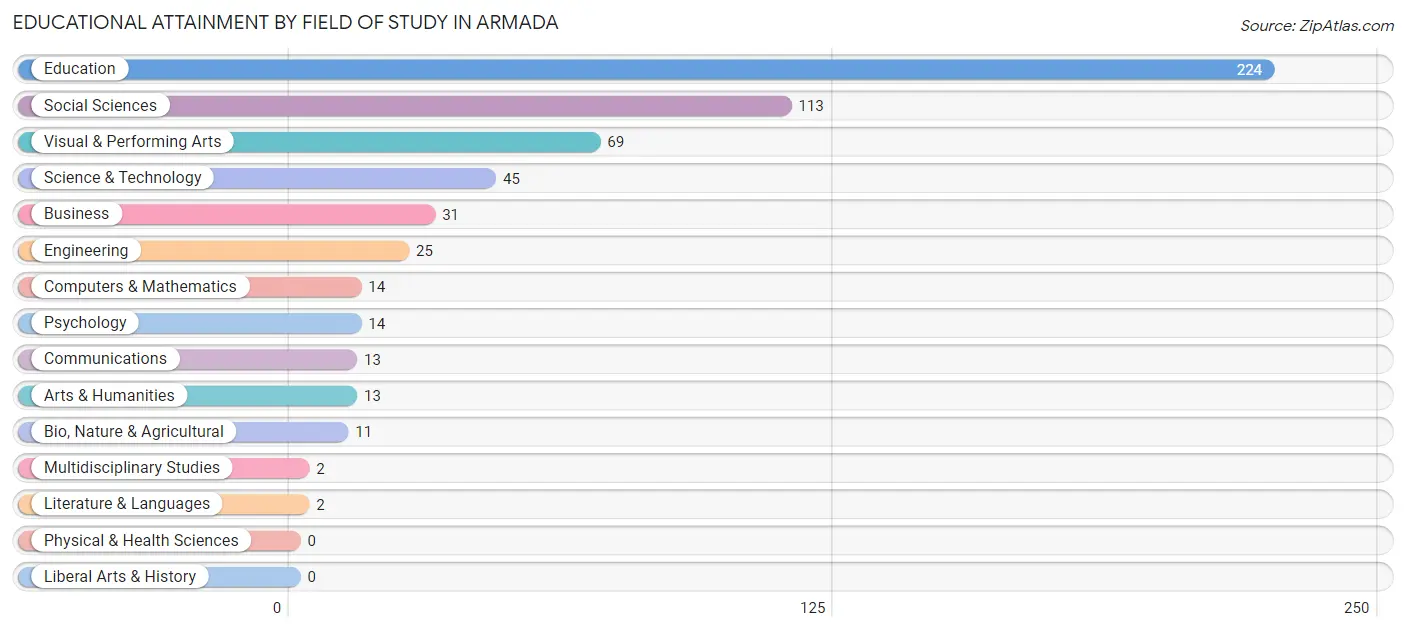
| Field of Study | # Graduates | % Graduates |
| Computers & Mathematics | 14 | 2.4% |
| Bio, Nature & Agricultural | 11 | 1.9% |
| Physical & Health Sciences | 0 | 0.0% |
| Psychology | 14 | 2.4% |
| Social Sciences | 113 | 19.6% |
| Engineering | 25 | 4.3% |
| Multidisciplinary Studies | 2 | 0.4% |
| Science & Technology | 45 | 7.8% |
| Business | 31 | 5.4% |
| Education | 224 | 38.9% |
| Literature & Languages | 2 | 0.4% |
| Liberal Arts & History | 0 | 0.0% |
| Visual & Performing Arts | 69 | 12.0% |
| Communications | 13 | 2.3% |
| Arts & Humanities | 13 | 2.3% |
| Total | 576 | 100.0% |
Transportation & Commute in Armada
Vehicle Availability by Sex in Armada
The most prevalent vehicle ownership categories in Armada are males with 4 vehicles (147, accounting for 29.9%) and females with 4 vehicles (133, making up 39.0%).
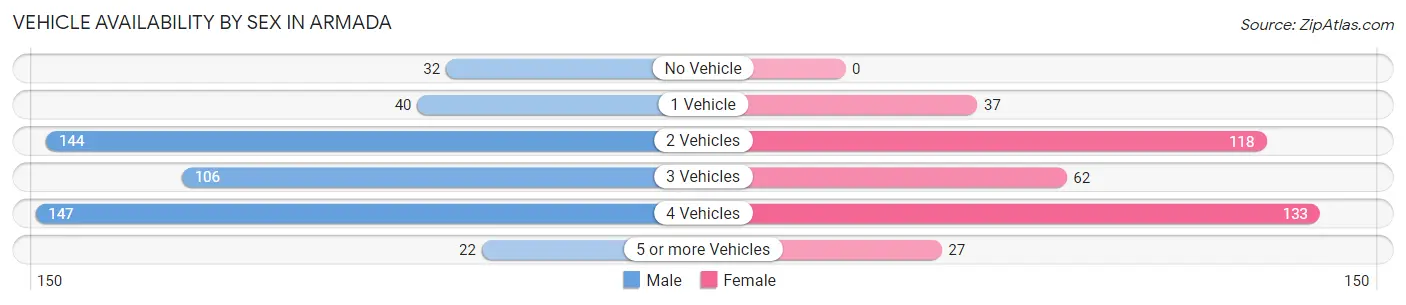
| Vehicles Available | Male | Female |
| No Vehicle | 32 (6.5%) | 0 (0.0%) |
| 1 Vehicle | 40 (8.2%) | 37 (9.8%) |
| 2 Vehicles | 144 (29.3%) | 118 (31.3%) |
| 3 Vehicles | 106 (21.6%) | 62 (16.5%) |
| 4 Vehicles | 147 (29.9%) | 133 (35.3%) |
| 5 or more Vehicles | 22 (4.5%) | 27 (7.2%) |
| Total | 491 (100.0%) | 377 (100.0%) |
Commute Time in Armada
The most frequently occuring commute durations in Armada are 45 to 59 minutes (93 commuters, 13.9%), 30 to 34 minutes (91 commuters, 13.6%), and 25 to 29 minutes (77 commuters, 11.5%).
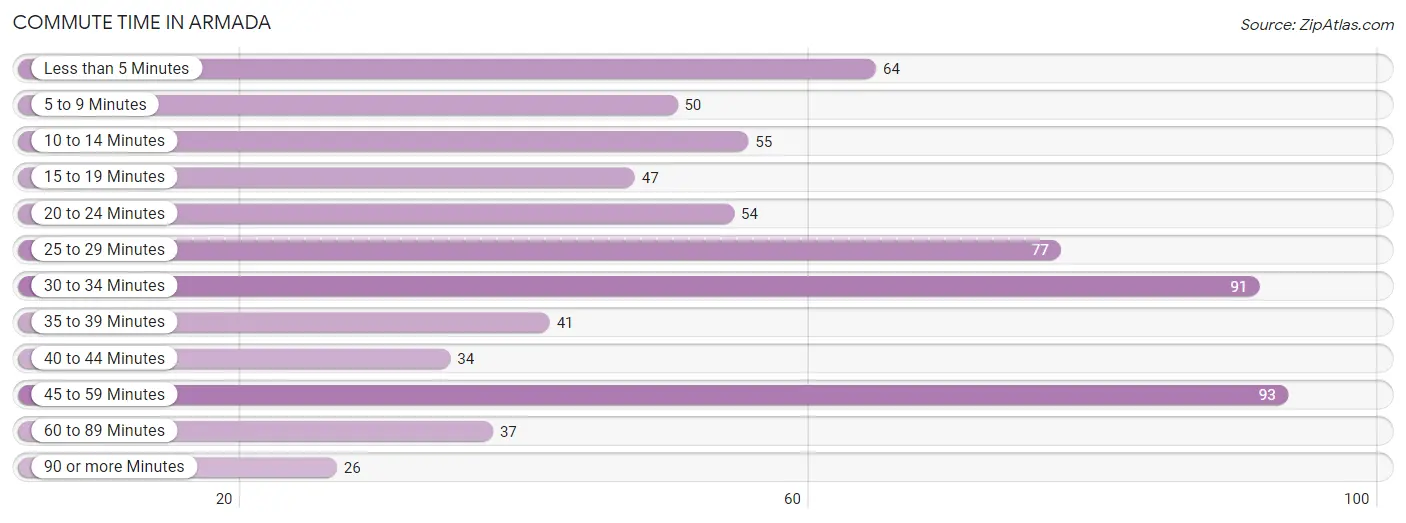
| Commute Time | # Commuters | % Commuters |
| Less than 5 Minutes | 64 | 9.6% |
| 5 to 9 Minutes | 50 | 7.5% |
| 10 to 14 Minutes | 55 | 8.2% |
| 15 to 19 Minutes | 47 | 7.0% |
| 20 to 24 Minutes | 54 | 8.1% |
| 25 to 29 Minutes | 77 | 11.5% |
| 30 to 34 Minutes | 91 | 13.6% |
| 35 to 39 Minutes | 41 | 6.1% |
| 40 to 44 Minutes | 34 | 5.1% |
| 45 to 59 Minutes | 93 | 13.9% |
| 60 to 89 Minutes | 37 | 5.5% |
| 90 or more Minutes | 26 | 3.9% |
Commute Time by Sex in Armada
The most common commute times in Armada are 30 to 34 minutes (84 commuters, 21.4%) for males and 45 to 59 minutes (39 commuters, 14.1%) for females.
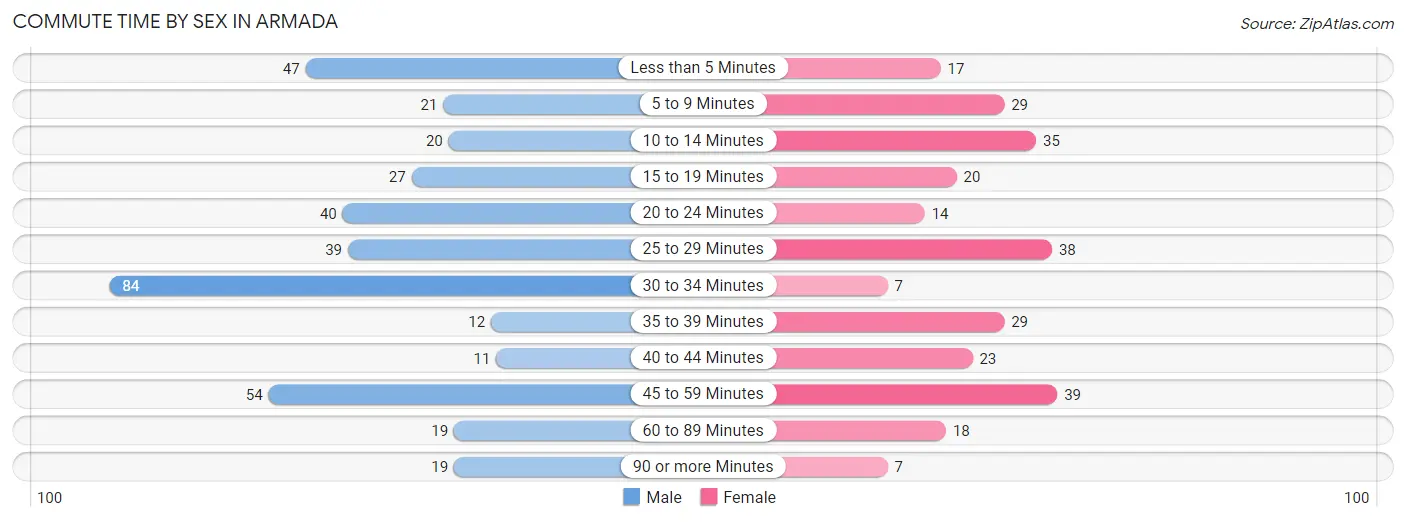
| Commute Time | Male | Female |
| Less than 5 Minutes | 47 (12.0%) | 17 (6.2%) |
| 5 to 9 Minutes | 21 (5.3%) | 29 (10.5%) |
| 10 to 14 Minutes | 20 (5.1%) | 35 (12.7%) |
| 15 to 19 Minutes | 27 (6.9%) | 20 (7.2%) |
| 20 to 24 Minutes | 40 (10.2%) | 14 (5.1%) |
| 25 to 29 Minutes | 39 (9.9%) | 38 (13.8%) |
| 30 to 34 Minutes | 84 (21.4%) | 7 (2.5%) |
| 35 to 39 Minutes | 12 (3.0%) | 29 (10.5%) |
| 40 to 44 Minutes | 11 (2.8%) | 23 (8.3%) |
| 45 to 59 Minutes | 54 (13.7%) | 39 (14.1%) |
| 60 to 89 Minutes | 19 (4.8%) | 18 (6.5%) |
| 90 or more Minutes | 19 (4.8%) | 7 (2.5%) |
Time of Departure to Work by Sex in Armada
The most frequent times of departure to work in Armada are 12:00 AM to 4:59 AM (66, 16.8%) for males and 7:00 AM to 7:29 AM (46, 16.7%) for females.
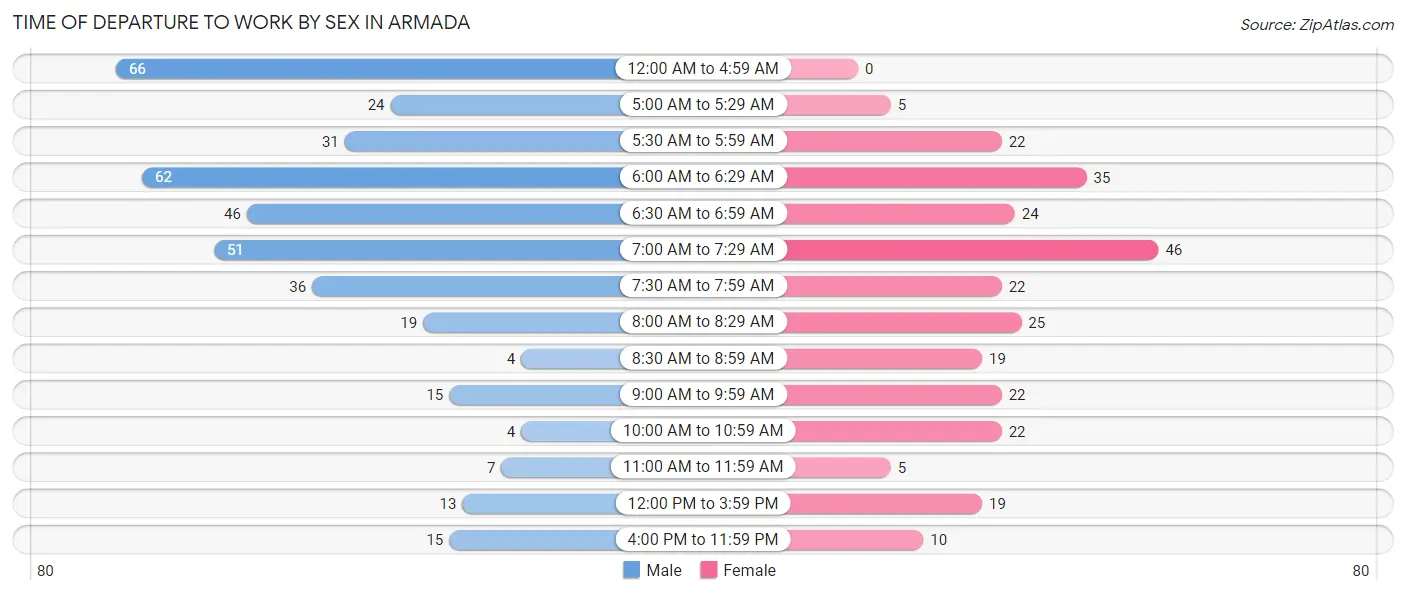
| Time of Departure | Male | Female |
| 12:00 AM to 4:59 AM | 66 (16.8%) | 0 (0.0%) |
| 5:00 AM to 5:29 AM | 24 (6.1%) | 5 (1.8%) |
| 5:30 AM to 5:59 AM | 31 (7.9%) | 22 (8.0%) |
| 6:00 AM to 6:29 AM | 62 (15.8%) | 35 (12.7%) |
| 6:30 AM to 6:59 AM | 46 (11.7%) | 24 (8.7%) |
| 7:00 AM to 7:29 AM | 51 (13.0%) | 46 (16.7%) |
| 7:30 AM to 7:59 AM | 36 (9.2%) | 22 (8.0%) |
| 8:00 AM to 8:29 AM | 19 (4.8%) | 25 (9.1%) |
| 8:30 AM to 8:59 AM | 4 (1.0%) | 19 (6.9%) |
| 9:00 AM to 9:59 AM | 15 (3.8%) | 22 (8.0%) |
| 10:00 AM to 10:59 AM | 4 (1.0%) | 22 (8.0%) |
| 11:00 AM to 11:59 AM | 7 (1.8%) | 5 (1.8%) |
| 12:00 PM to 3:59 PM | 13 (3.3%) | 19 (6.9%) |
| 4:00 PM to 11:59 PM | 15 (3.8%) | 10 (3.6%) |
| Total | 393 (100.0%) | 276 (100.0%) |
Housing Occupancy in Armada
Occupancy by Ownership in Armada
Of the total 657 dwellings in Armada, owner-occupied units account for 546 (83.1%), while renter-occupied units make up 111 (16.9%).
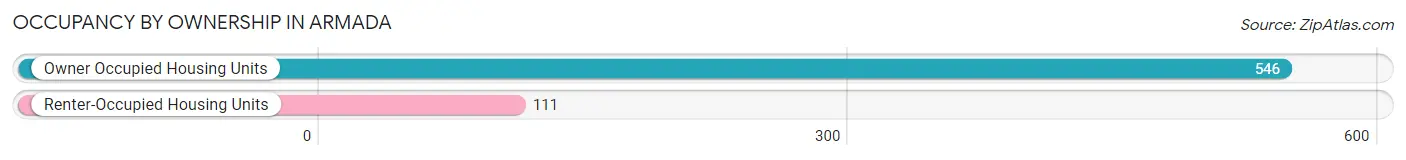
| Occupancy | # Housing Units | % Housing Units |
| Owner Occupied Housing Units | 546 | 83.1% |
| Renter-Occupied Housing Units | 111 | 16.9% |
| Total Occupied Housing Units | 657 | 100.0% |
Occupancy by Household Size in Armada
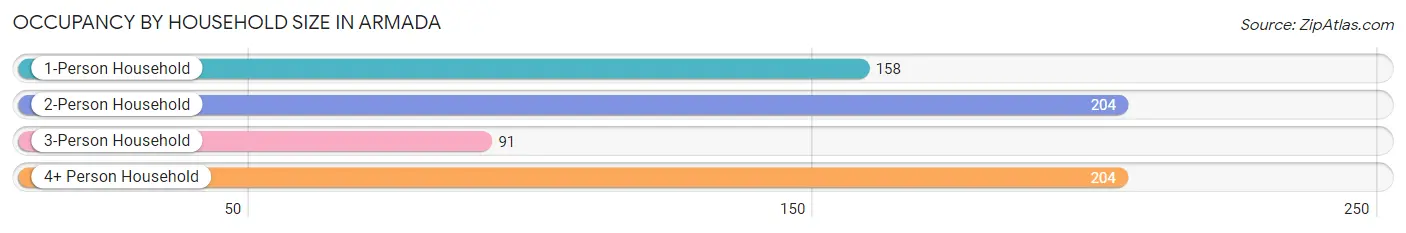
| Household Size | # Housing Units | % Housing Units |
| 1-Person Household | 158 | 24.0% |
| 2-Person Household | 204 | 31.0% |
| 3-Person Household | 91 | 13.9% |
| 4+ Person Household | 204 | 31.0% |
| Total Housing Units | 657 | 100.0% |
Occupancy by Ownership by Household Size in Armada
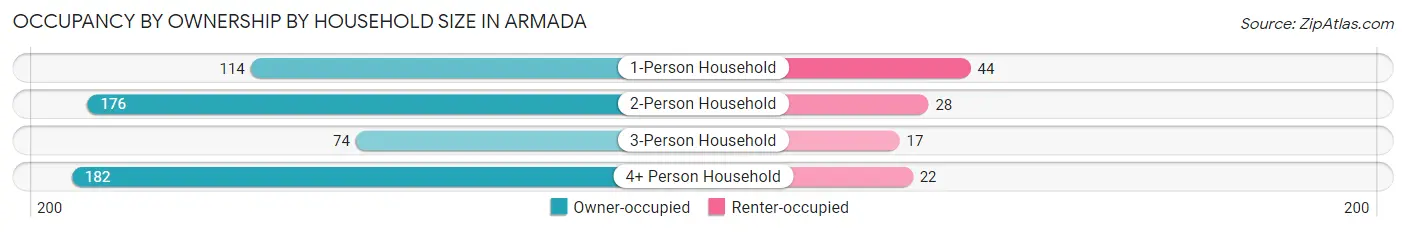
| Household Size | Owner-occupied | Renter-occupied |
| 1-Person Household | 114 (72.2%) | 44 (27.9%) |
| 2-Person Household | 176 (86.3%) | 28 (13.7%) |
| 3-Person Household | 74 (81.3%) | 17 (18.7%) |
| 4+ Person Household | 182 (89.2%) | 22 (10.8%) |
| Total Housing Units | 546 (83.1%) | 111 (16.9%) |
Occupancy by Educational Attainment in Armada
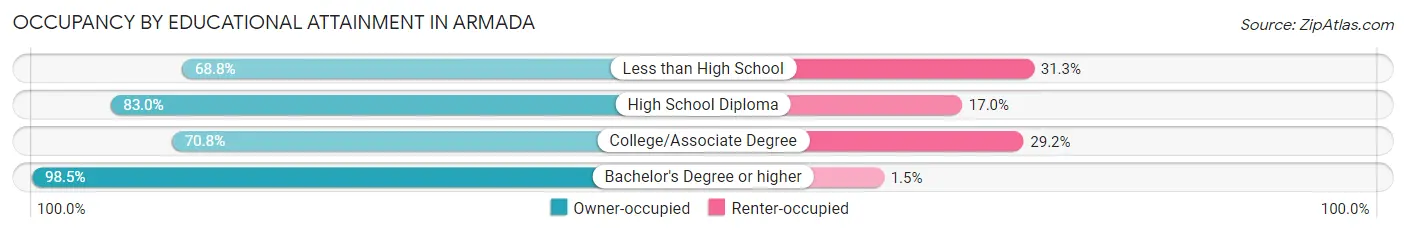
| Household Size | Owner-occupied | Renter-occupied |
| Less than High School | 11 (68.8%) | 5 (31.2%) |
| High School Diploma | 171 (83.0%) | 35 (17.0%) |
| College/Associate Degree | 165 (70.8%) | 68 (29.2%) |
| Bachelor's Degree or higher | 199 (98.5%) | 3 (1.5%) |
Occupancy by Age of Householder in Armada
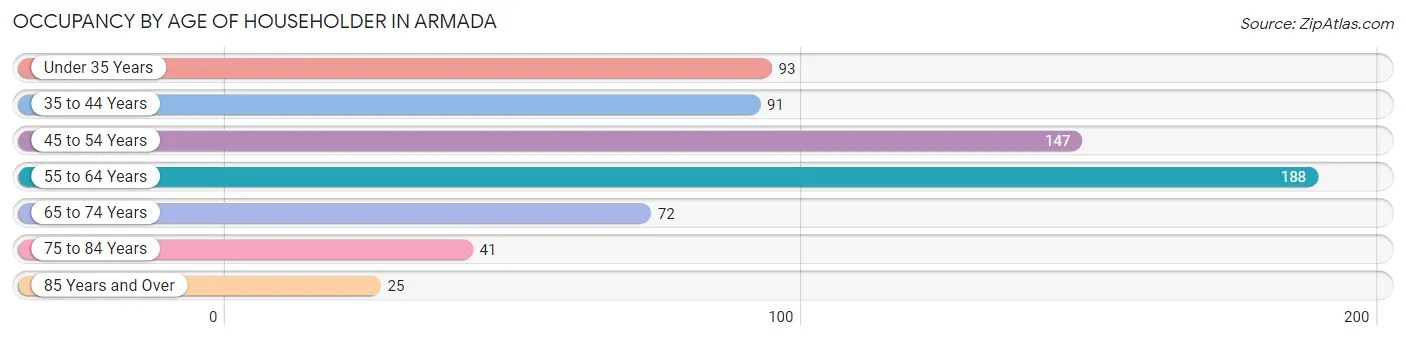
| Age Bracket | # Households | % Households |
| Under 35 Years | 93 | 14.2% |
| 35 to 44 Years | 91 | 13.9% |
| 45 to 54 Years | 147 | 22.4% |
| 55 to 64 Years | 188 | 28.6% |
| 65 to 74 Years | 72 | 11.0% |
| 75 to 84 Years | 41 | 6.2% |
| 85 Years and Over | 25 | 3.8% |
| Total | 657 | 100.0% |
Housing Finances in Armada
Median Income by Occupancy in Armada
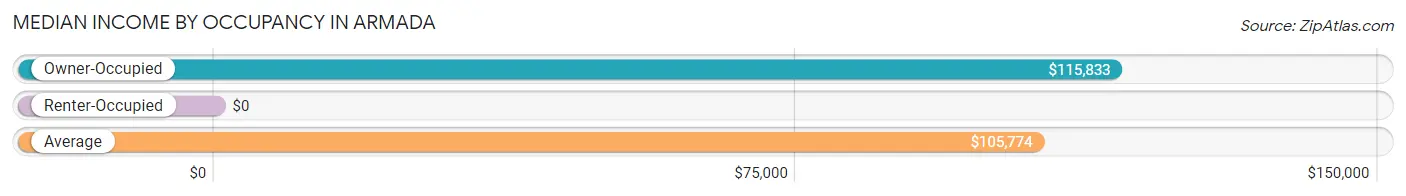
| Occupancy Type | # Households | Median Income |
| Owner-Occupied | 546 (83.1%) | $115,833 |
| Renter-Occupied | 111 (16.9%) | $0 |
| Average | 657 (100.0%) | $105,774 |
Occupancy by Householder Income Bracket in Armada
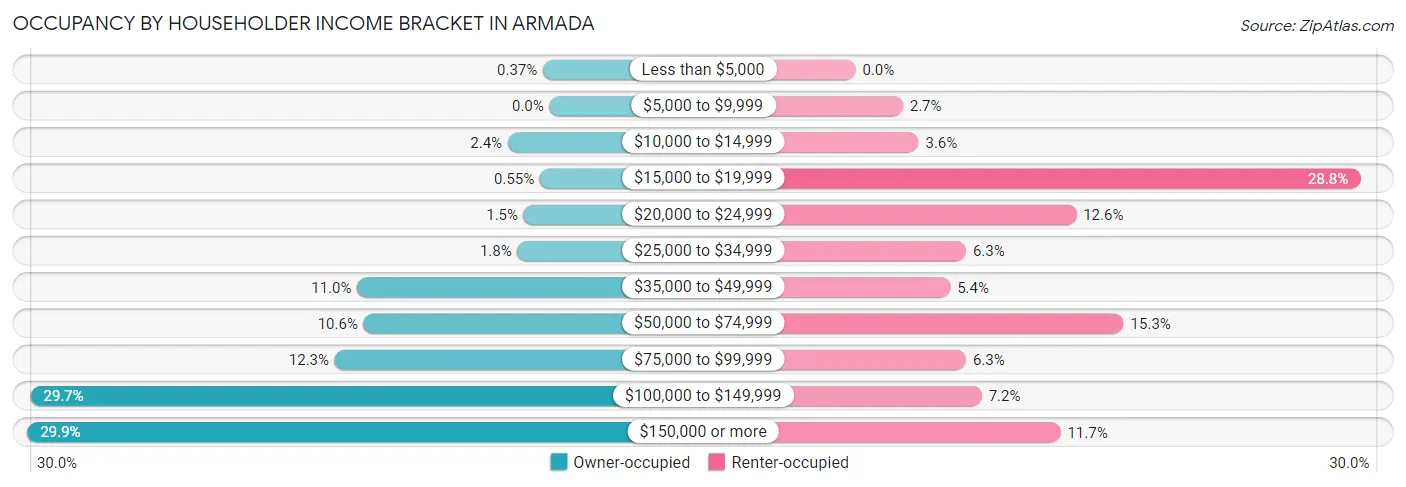
| Income Bracket | Owner-occupied | Renter-occupied |
| Less than $5,000 | 2 (0.4%) | 0 (0.0%) |
| $5,000 to $9,999 | 0 (0.0%) | 3 (2.7%) |
| $10,000 to $14,999 | 13 (2.4%) | 4 (3.6%) |
| $15,000 to $19,999 | 3 (0.5%) | 32 (28.8%) |
| $20,000 to $24,999 | 8 (1.5%) | 14 (12.6%) |
| $25,000 to $34,999 | 10 (1.8%) | 7 (6.3%) |
| $35,000 to $49,999 | 60 (11.0%) | 6 (5.4%) |
| $50,000 to $74,999 | 58 (10.6%) | 17 (15.3%) |
| $75,000 to $99,999 | 67 (12.3%) | 7 (6.3%) |
| $100,000 to $149,999 | 162 (29.7%) | 8 (7.2%) |
| $150,000 or more | 163 (29.8%) | 13 (11.7%) |
| Total | 546 (100.0%) | 111 (100.0%) |
Monthly Housing Cost Tiers in Armada
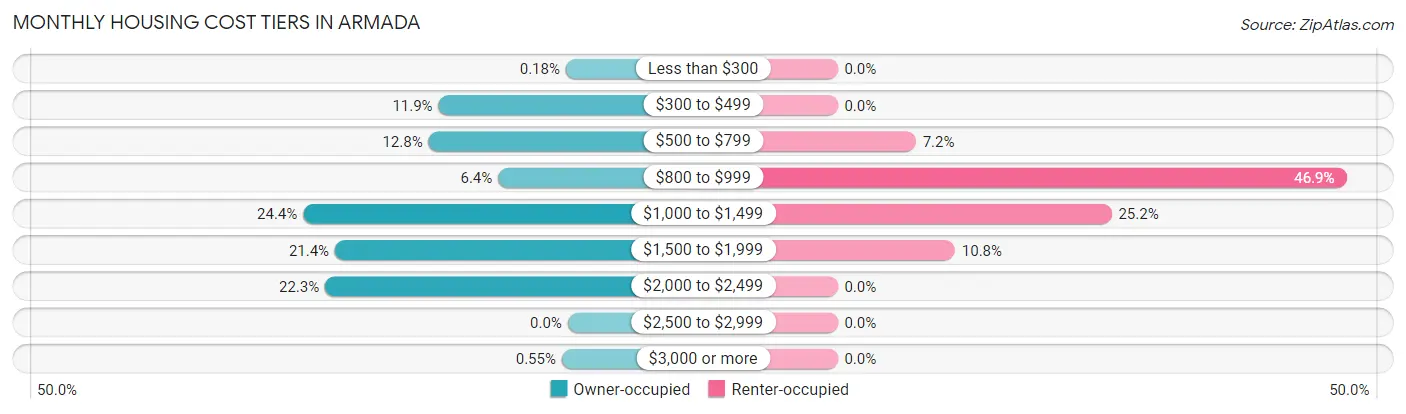
| Monthly Cost | Owner-occupied | Renter-occupied |
| Less than $300 | 1 (0.2%) | 0 (0.0%) |
| $300 to $499 | 65 (11.9%) | 0 (0.0%) |
| $500 to $799 | 70 (12.8%) | 8 (7.2%) |
| $800 to $999 | 35 (6.4%) | 52 (46.9%) |
| $1,000 to $1,499 | 133 (24.4%) | 28 (25.2%) |
| $1,500 to $1,999 | 117 (21.4%) | 12 (10.8%) |
| $2,000 to $2,499 | 122 (22.3%) | 0 (0.0%) |
| $2,500 to $2,999 | 0 (0.0%) | 0 (0.0%) |
| $3,000 or more | 3 (0.5%) | 0 (0.0%) |
| Total | 546 (100.0%) | 111 (100.0%) |
Physical Housing Characteristics in Armada
Housing Structures in Armada
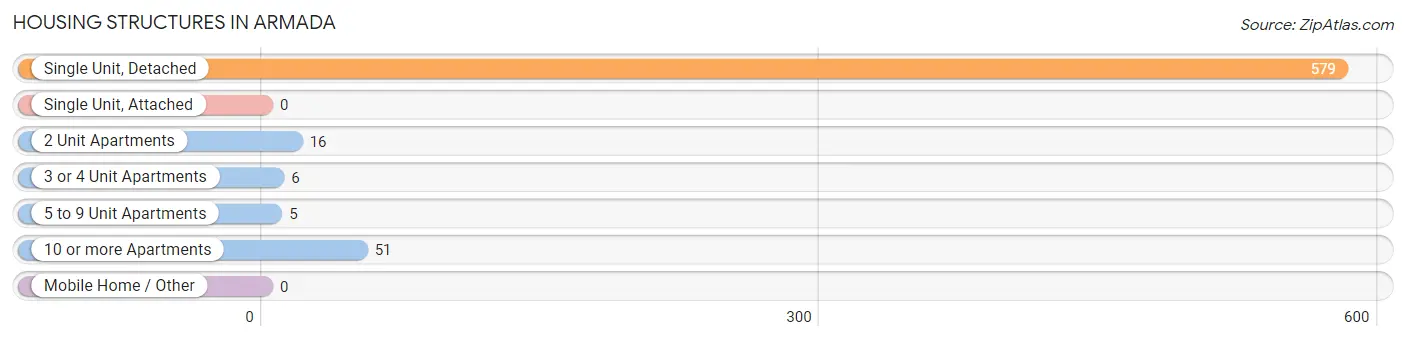
| Structure Type | # Housing Units | % Housing Units |
| Single Unit, Detached | 579 | 88.1% |
| Single Unit, Attached | 0 | 0.0% |
| 2 Unit Apartments | 16 | 2.4% |
| 3 or 4 Unit Apartments | 6 | 0.9% |
| 5 to 9 Unit Apartments | 5 | 0.8% |
| 10 or more Apartments | 51 | 7.8% |
| Mobile Home / Other | 0 | 0.0% |
| Total | 657 | 100.0% |
Housing Structures by Occupancy in Armada
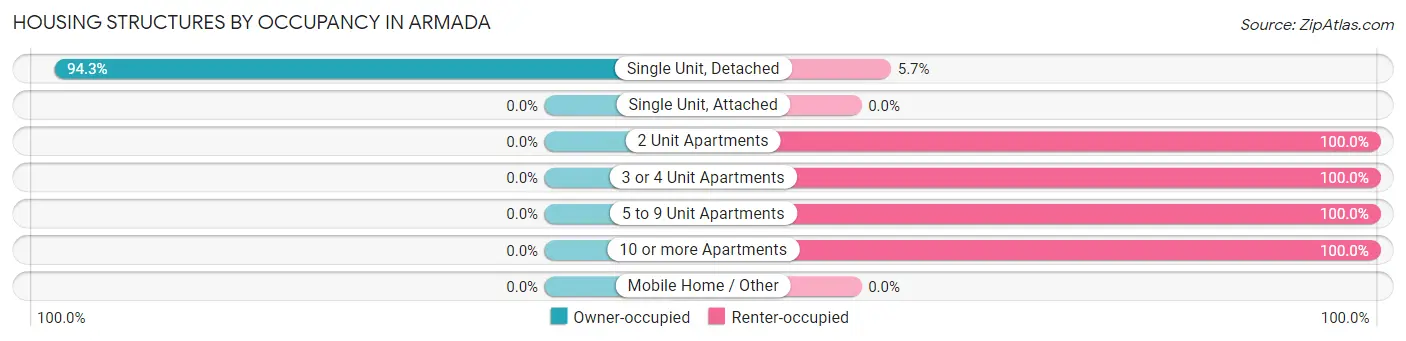
| Structure Type | Owner-occupied | Renter-occupied |
| Single Unit, Detached | 546 (94.3%) | 33 (5.7%) |
| Single Unit, Attached | 0 (0.0%) | 0 (0.0%) |
| 2 Unit Apartments | 0 (0.0%) | 16 (100.0%) |
| 3 or 4 Unit Apartments | 0 (0.0%) | 6 (100.0%) |
| 5 to 9 Unit Apartments | 0 (0.0%) | 5 (100.0%) |
| 10 or more Apartments | 0 (0.0%) | 51 (100.0%) |
| Mobile Home / Other | 0 (0.0%) | 0 (0.0%) |
| Total | 546 (83.1%) | 111 (16.9%) |
Housing Structures by Number of Rooms in Armada
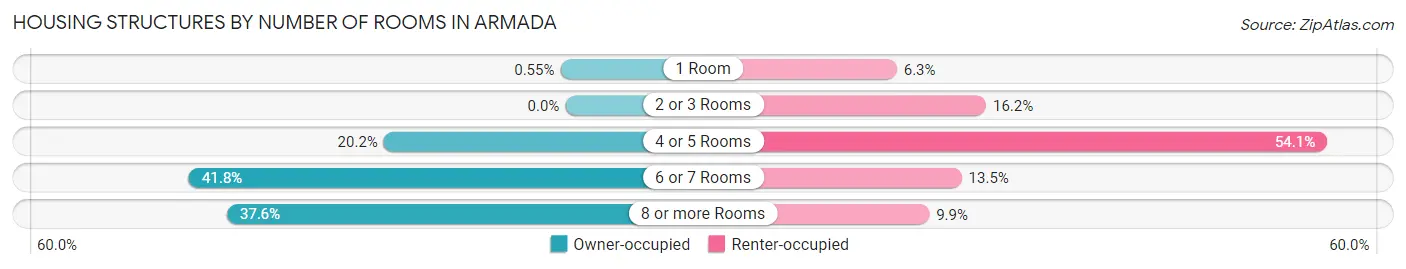
| Number of Rooms | Owner-occupied | Renter-occupied |
| 1 Room | 3 (0.5%) | 7 (6.3%) |
| 2 or 3 Rooms | 0 (0.0%) | 18 (16.2%) |
| 4 or 5 Rooms | 110 (20.2%) | 60 (54.0%) |
| 6 or 7 Rooms | 228 (41.8%) | 15 (13.5%) |
| 8 or more Rooms | 205 (37.6%) | 11 (9.9%) |
| Total | 546 (100.0%) | 111 (100.0%) |
Housing Structure by Heating Type in Armada
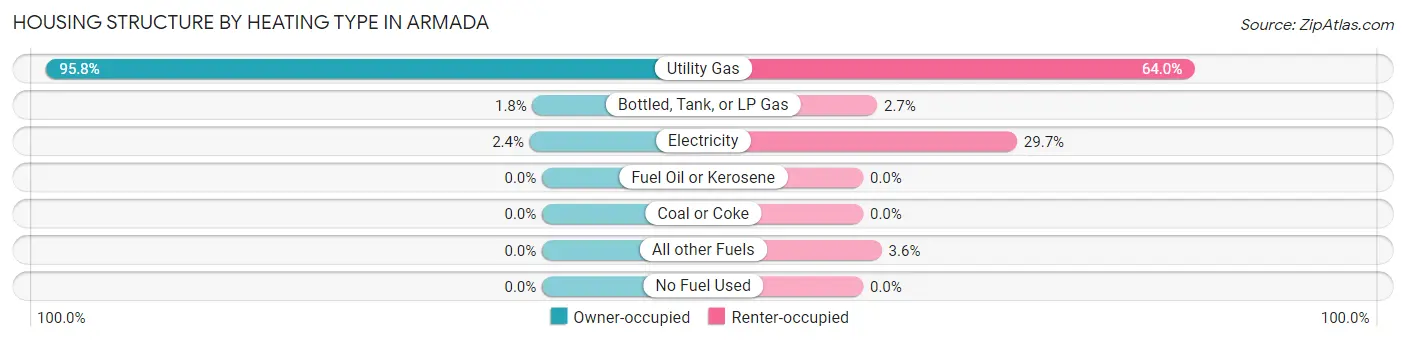
| Heating Type | Owner-occupied | Renter-occupied |
| Utility Gas | 523 (95.8%) | 71 (64.0%) |
| Bottled, Tank, or LP Gas | 10 (1.8%) | 3 (2.7%) |
| Electricity | 13 (2.4%) | 33 (29.7%) |
| Fuel Oil or Kerosene | 0 (0.0%) | 0 (0.0%) |
| Coal or Coke | 0 (0.0%) | 0 (0.0%) |
| All other Fuels | 0 (0.0%) | 4 (3.6%) |
| No Fuel Used | 0 (0.0%) | 0 (0.0%) |
| Total | 546 (100.0%) | 111 (100.0%) |
Household Vehicle Usage in Armada
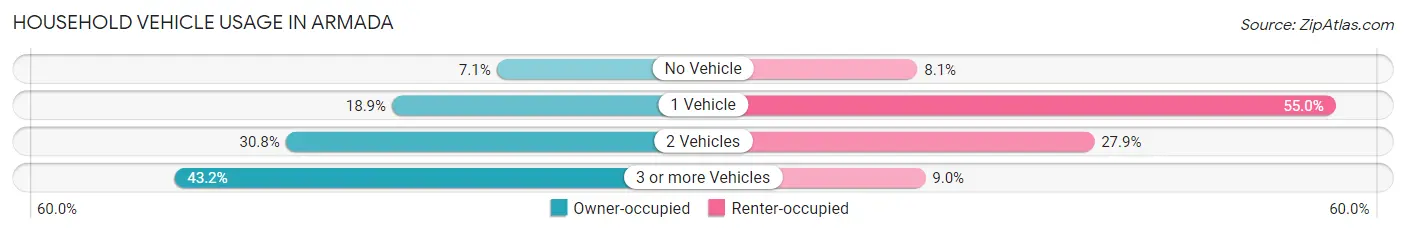
| Vehicles per Household | Owner-occupied | Renter-occupied |
| No Vehicle | 39 (7.1%) | 9 (8.1%) |
| 1 Vehicle | 103 (18.9%) | 61 (54.9%) |
| 2 Vehicles | 168 (30.8%) | 31 (27.9%) |
| 3 or more Vehicles | 236 (43.2%) | 10 (9.0%) |
| Total | 546 (100.0%) | 111 (100.0%) |
Real Estate & Mortgages in Armada
Real Estate and Mortgage Overview in Armada
| Characteristic | Without Mortgage | With Mortgage |
| Housing Units | 140 | 406 |
| Median Property Value | $193,300 | $250,000 |
| Median Household Income | $65,000 | $152 |
| Monthly Housing Costs | $588 | $3 |
| Real Estate Taxes | $2,766 | $0 |
Property Value by Mortgage Status in Armada
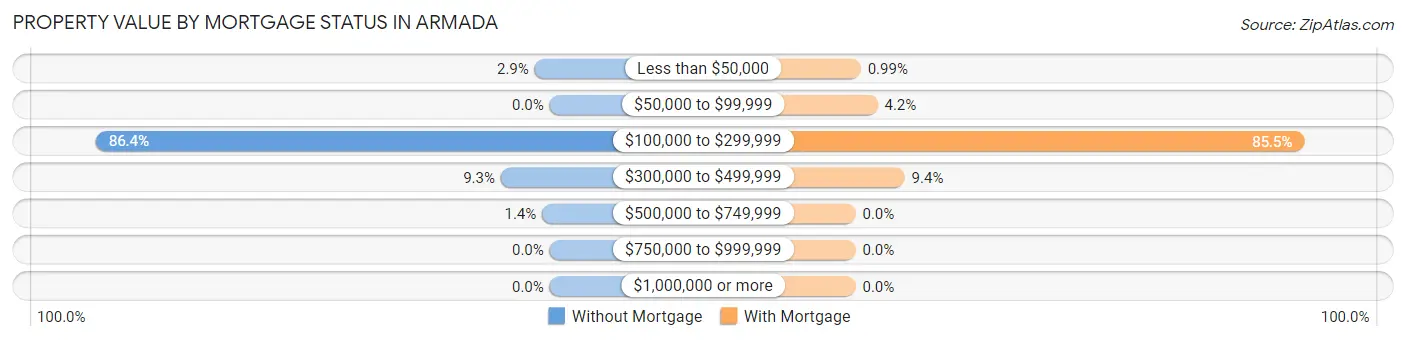
| Property Value | Without Mortgage | With Mortgage |
| Less than $50,000 | 4 (2.9%) | 4 (1.0%) |
| $50,000 to $99,999 | 0 (0.0%) | 17 (4.2%) |
| $100,000 to $299,999 | 121 (86.4%) | 347 (85.5%) |
| $300,000 to $499,999 | 13 (9.3%) | 38 (9.4%) |
| $500,000 to $749,999 | 2 (1.4%) | 0 (0.0%) |
| $750,000 to $999,999 | 0 (0.0%) | 0 (0.0%) |
| $1,000,000 or more | 0 (0.0%) | 0 (0.0%) |
| Total | 140 (100.0%) | 406 (100.0%) |
Household Income by Mortgage Status in Armada
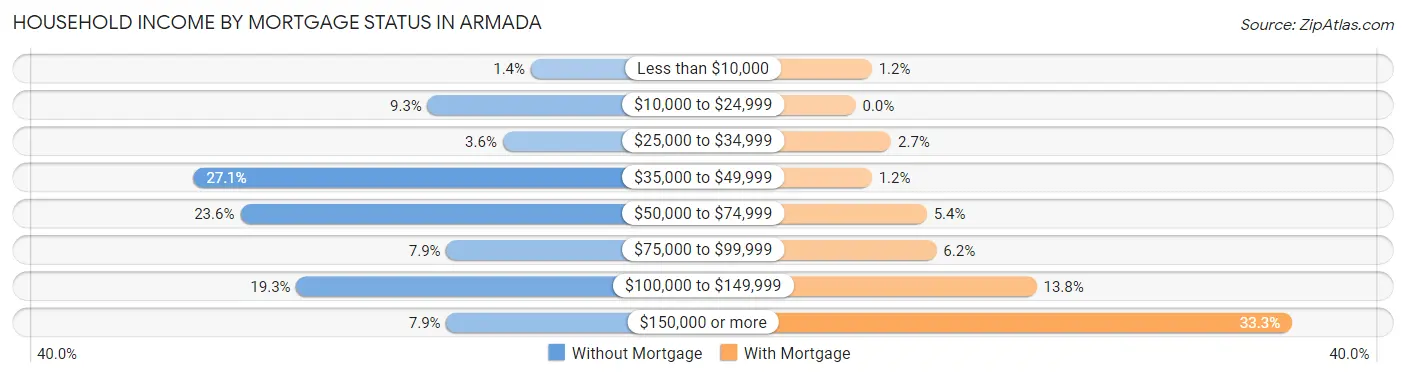
| Household Income | Without Mortgage | With Mortgage |
| Less than $10,000 | 2 (1.4%) | 5 (1.2%) |
| $10,000 to $24,999 | 13 (9.3%) | 0 (0.0%) |
| $25,000 to $34,999 | 5 (3.6%) | 11 (2.7%) |
| $35,000 to $49,999 | 38 (27.1%) | 5 (1.2%) |
| $50,000 to $74,999 | 33 (23.6%) | 22 (5.4%) |
| $75,000 to $99,999 | 11 (7.9%) | 25 (6.2%) |
| $100,000 to $149,999 | 27 (19.3%) | 56 (13.8%) |
| $150,000 or more | 11 (7.9%) | 135 (33.3%) |
| Total | 140 (100.0%) | 406 (100.0%) |
Property Value to Household Income Ratio in Armada
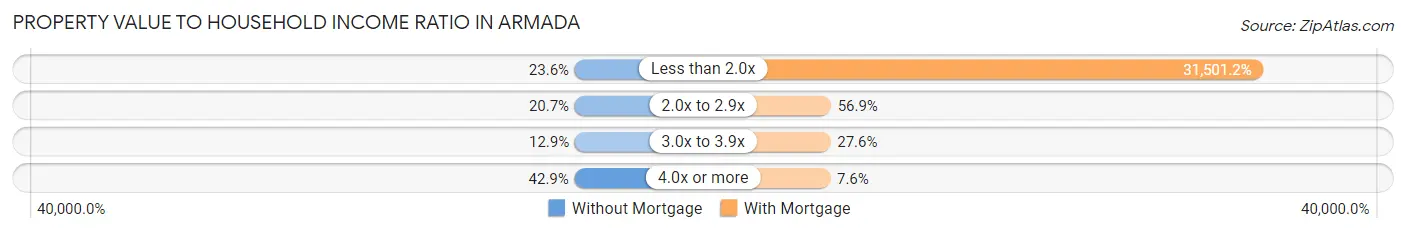
| Value-to-Income Ratio | Without Mortgage | With Mortgage |
| Less than 2.0x | 33 (23.6%) | 127,895 (31,501.2%) |
| 2.0x to 2.9x | 29 (20.7%) | 231 (56.9%) |
| 3.0x to 3.9x | 18 (12.9%) | 112 (27.6%) |
| 4.0x or more | 60 (42.9%) | 31 (7.6%) |
| Total | 140 (100.0%) | 406 (100.0%) |
Real Estate Taxes by Mortgage Status in Armada
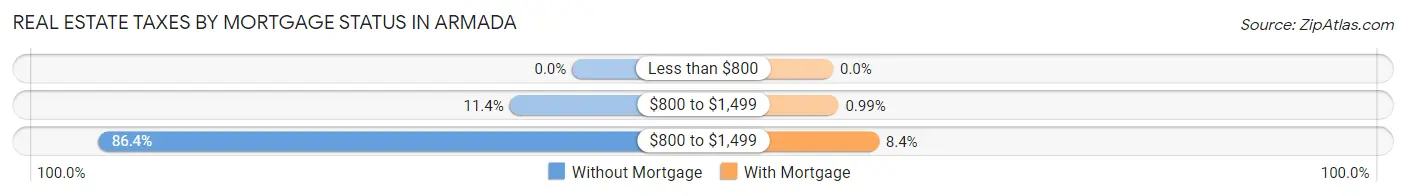
| Property Taxes | Without Mortgage | With Mortgage |
| Less than $800 | 0 (0.0%) | 0 (0.0%) |
| $800 to $1,499 | 16 (11.4%) | 4 (1.0%) |
| $800 to $1,499 | 121 (86.4%) | 34 (8.4%) |
| Total | 140 (100.0%) | 406 (100.0%) |
Health & Disability in Armada
Health Insurance Coverage by Age in Armada
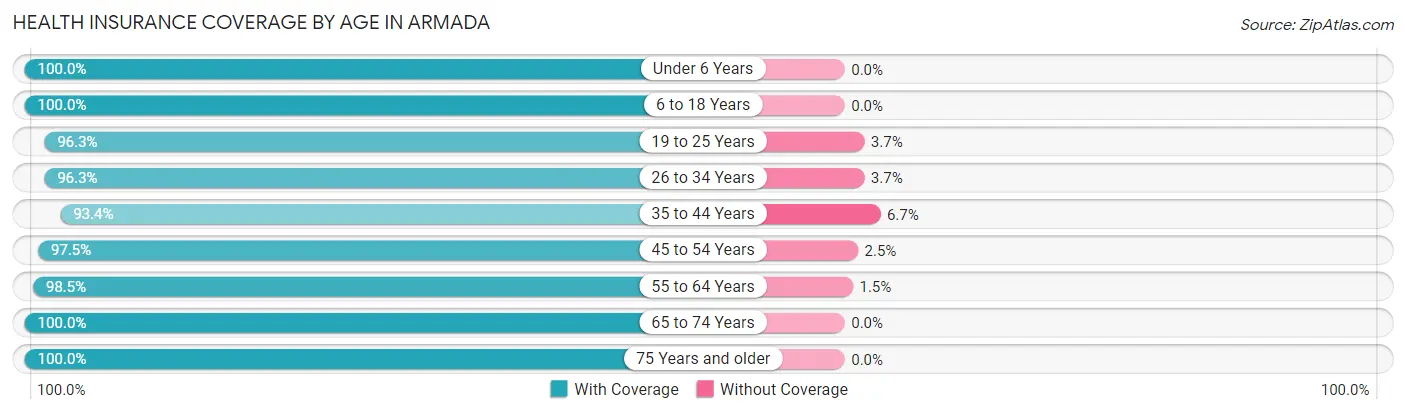
| Age Bracket | With Coverage | Without Coverage |
| Under 6 Years | 81 (100.0%) | 0 (0.0%) |
| 6 to 18 Years | 472 (100.0%) | 0 (0.0%) |
| 19 to 25 Years | 79 (96.3%) | 3 (3.7%) |
| 26 to 34 Years | 158 (96.3%) | 6 (3.7%) |
| 35 to 44 Years | 337 (93.3%) | 24 (6.7%) |
| 45 to 54 Years | 236 (97.5%) | 6 (2.5%) |
| 55 to 64 Years | 257 (98.5%) | 4 (1.5%) |
| 65 to 74 Years | 198 (100.0%) | 0 (0.0%) |
| 75 Years and older | 109 (100.0%) | 0 (0.0%) |
| Total | 1,927 (97.8%) | 43 (2.2%) |
Health Insurance Coverage by Citizenship Status in Armada
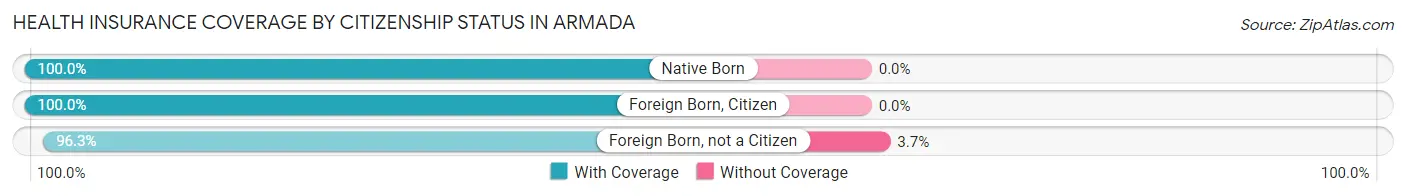
| Citizenship Status | With Coverage | Without Coverage |
| Native Born | 81 (100.0%) | 0 (0.0%) |
| Foreign Born, Citizen | 472 (100.0%) | 0 (0.0%) |
| Foreign Born, not a Citizen | 79 (96.3%) | 3 (3.7%) |
Health Insurance Coverage by Household Income in Armada
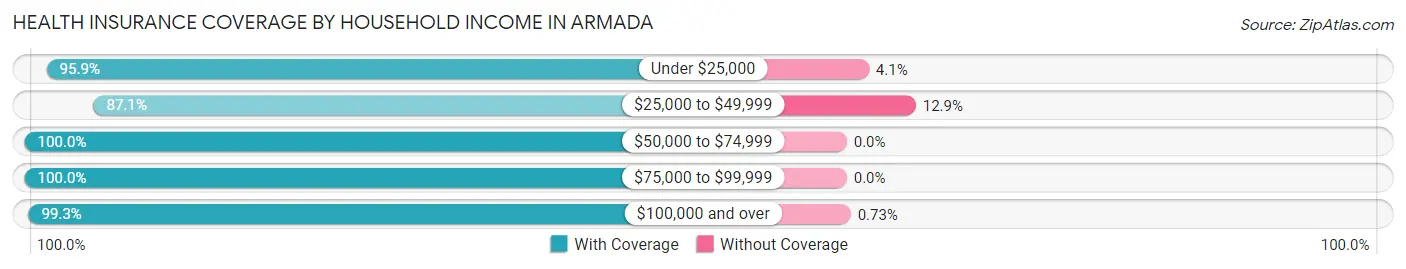
| Household Income | With Coverage | Without Coverage |
| Under $25,000 | 139 (95.9%) | 6 (4.1%) |
| $25,000 to $49,999 | 101 (87.1%) | 15 (12.9%) |
| $50,000 to $74,999 | 147 (100.0%) | 0 (0.0%) |
| $75,000 to $99,999 | 165 (100.0%) | 0 (0.0%) |
| $100,000 and over | 1,354 (99.3%) | 10 (0.7%) |
Public vs Private Health Insurance Coverage by Age in Armada
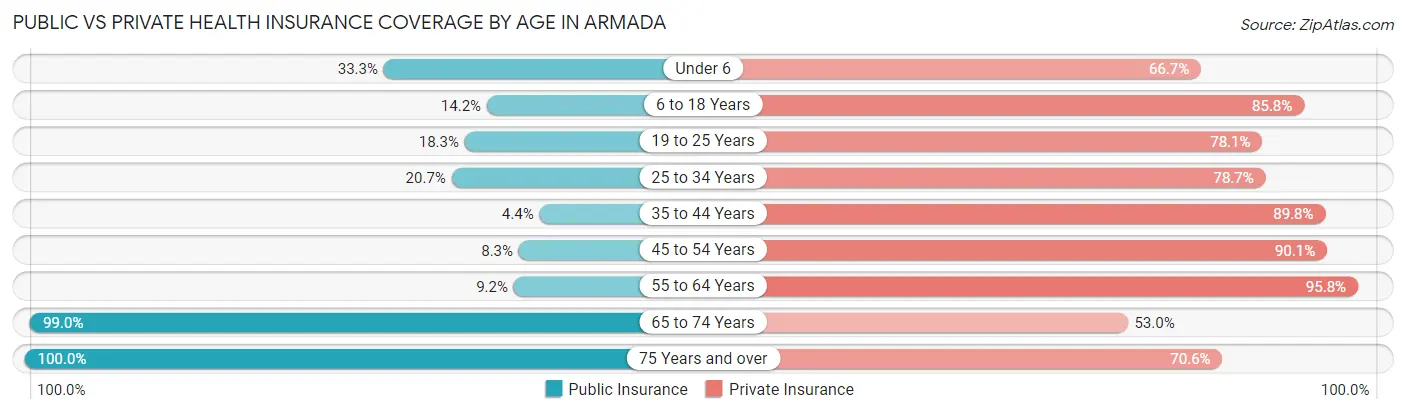
| Age Bracket | Public Insurance | Private Insurance |
| Under 6 | 27 (33.3%) | 54 (66.7%) |
| 6 to 18 Years | 67 (14.2%) | 405 (85.8%) |
| 19 to 25 Years | 15 (18.3%) | 64 (78.0%) |
| 25 to 34 Years | 34 (20.7%) | 129 (78.7%) |
| 35 to 44 Years | 16 (4.4%) | 324 (89.7%) |
| 45 to 54 Years | 20 (8.3%) | 218 (90.1%) |
| 55 to 64 Years | 24 (9.2%) | 250 (95.8%) |
| 65 to 74 Years | 196 (99.0%) | 105 (53.0%) |
| 75 Years and over | 109 (100.0%) | 77 (70.6%) |
| Total | 508 (25.8%) | 1,626 (82.5%) |
Disability Status by Sex by Age in Armada
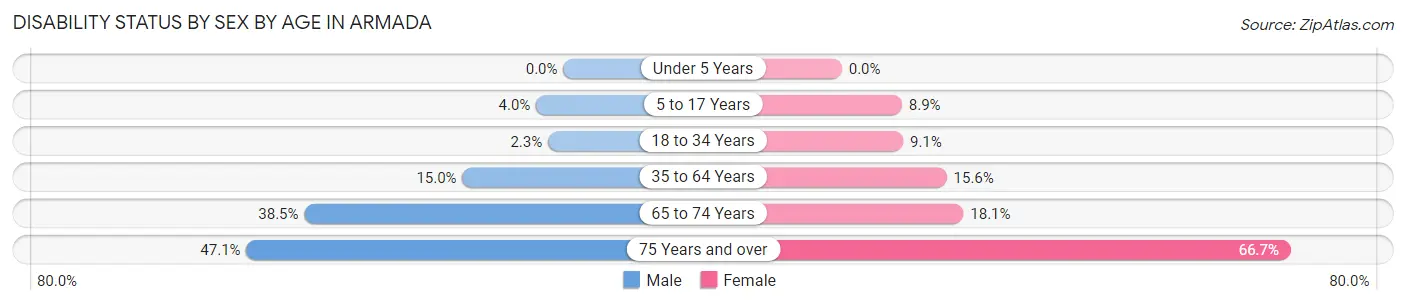
| Age Bracket | Male | Female |
| Under 5 Years | 0 (0.0%) | 0 (0.0%) |
| 5 to 17 Years | 10 (4.0%) | 19 (8.9%) |
| 18 to 34 Years | 3 (2.3%) | 12 (9.1%) |
| 35 to 64 Years | 62 (15.0%) | 70 (15.6%) |
| 65 to 74 Years | 25 (38.5%) | 24 (18.0%) |
| 75 Years and over | 16 (47.1%) | 50 (66.7%) |
Disability Class by Sex by Age in Armada
Disability Class: Hearing Difficulty
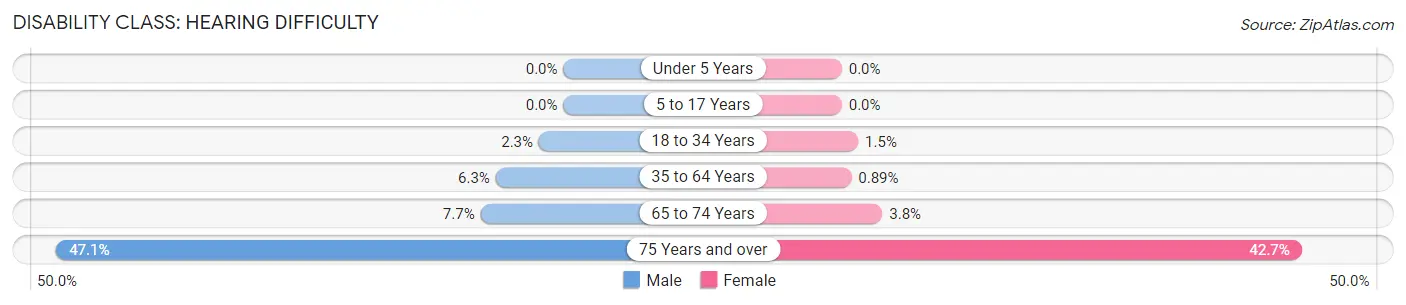
| Age Bracket | Male | Female |
| Under 5 Years | 0 (0.0%) | 0 (0.0%) |
| 5 to 17 Years | 0 (0.0%) | 0 (0.0%) |
| 18 to 34 Years | 3 (2.3%) | 2 (1.5%) |
| 35 to 64 Years | 26 (6.3%) | 4 (0.9%) |
| 65 to 74 Years | 5 (7.7%) | 5 (3.8%) |
| 75 Years and over | 16 (47.1%) | 32 (42.7%) |
Disability Class: Vision Difficulty
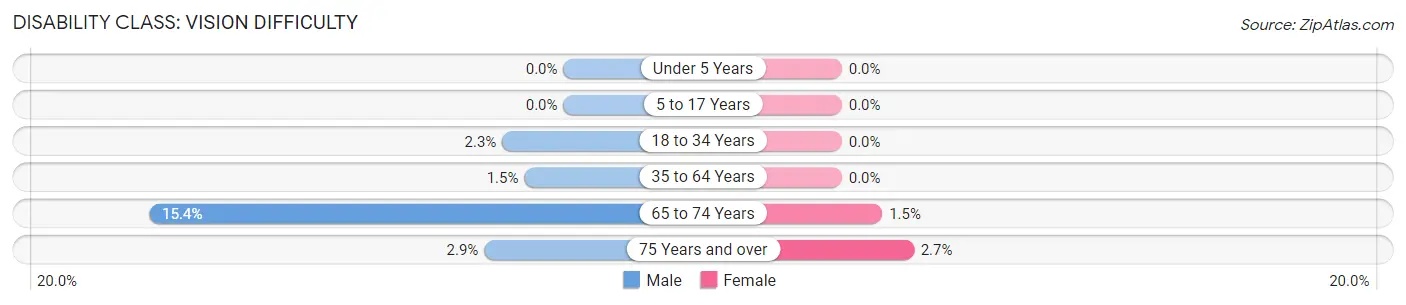
| Age Bracket | Male | Female |
| Under 5 Years | 0 (0.0%) | 0 (0.0%) |
| 5 to 17 Years | 0 (0.0%) | 0 (0.0%) |
| 18 to 34 Years | 3 (2.3%) | 0 (0.0%) |
| 35 to 64 Years | 6 (1.5%) | 0 (0.0%) |
| 65 to 74 Years | 10 (15.4%) | 2 (1.5%) |
| 75 Years and over | 1 (2.9%) | 2 (2.7%) |
Disability Class: Cognitive Difficulty
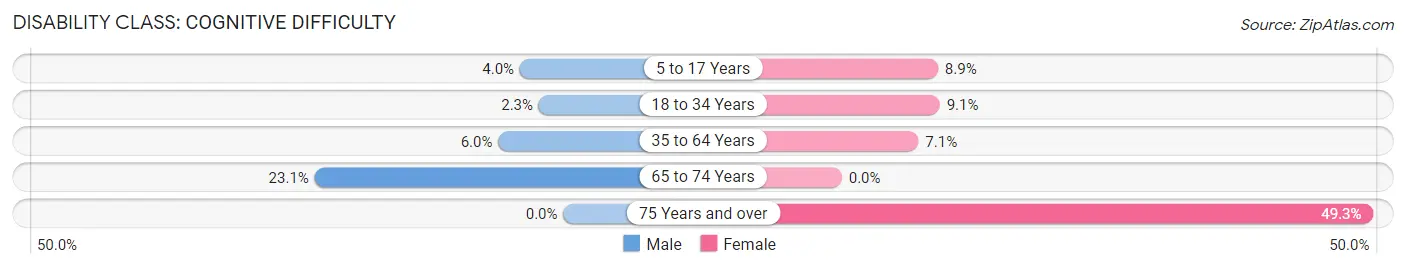
| Age Bracket | Male | Female |
| 5 to 17 Years | 10 (4.0%) | 19 (8.9%) |
| 18 to 34 Years | 3 (2.3%) | 12 (9.1%) |
| 35 to 64 Years | 25 (6.0%) | 32 (7.1%) |
| 65 to 74 Years | 15 (23.1%) | 0 (0.0%) |
| 75 Years and over | 0 (0.0%) | 37 (49.3%) |
Disability Class: Ambulatory Difficulty
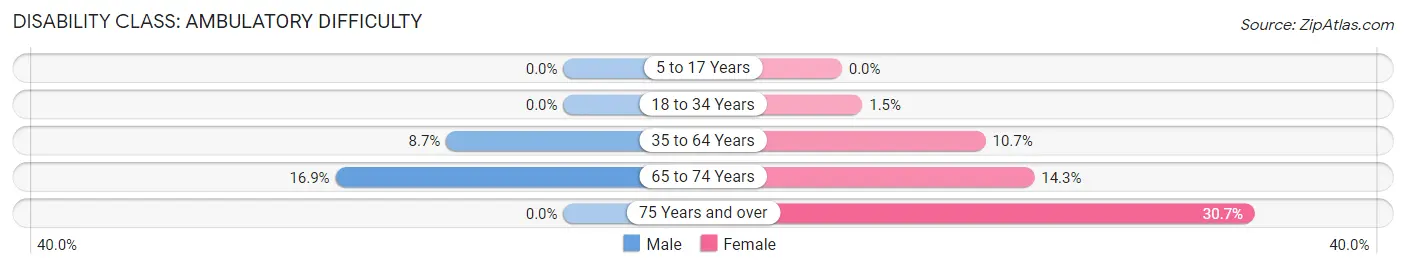
| Age Bracket | Male | Female |
| 5 to 17 Years | 0 (0.0%) | 0 (0.0%) |
| 18 to 34 Years | 0 (0.0%) | 2 (1.5%) |
| 35 to 64 Years | 36 (8.7%) | 48 (10.7%) |
| 65 to 74 Years | 11 (16.9%) | 19 (14.3%) |
| 75 Years and over | 0 (0.0%) | 23 (30.7%) |
Disability Class: Self-Care Difficulty
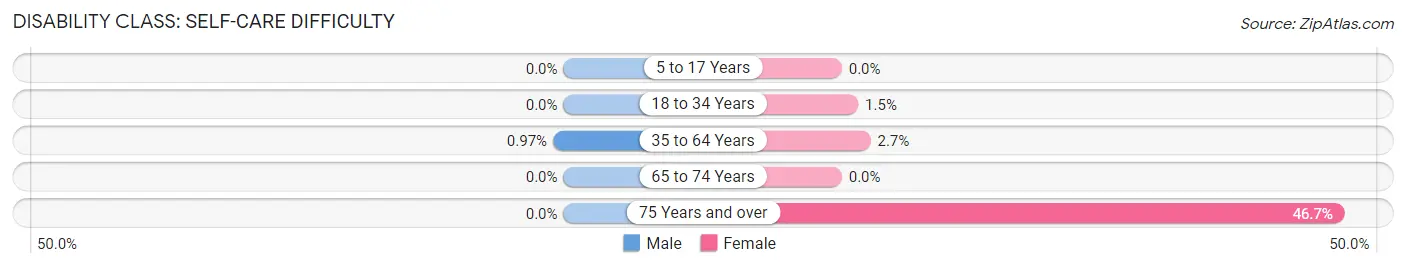
| Age Bracket | Male | Female |
| 5 to 17 Years | 0 (0.0%) | 0 (0.0%) |
| 18 to 34 Years | 0 (0.0%) | 2 (1.5%) |
| 35 to 64 Years | 4 (1.0%) | 12 (2.7%) |
| 65 to 74 Years | 0 (0.0%) | 0 (0.0%) |
| 75 Years and over | 0 (0.0%) | 35 (46.7%) |
Technology Access in Armada
Computing Device Access in Armada
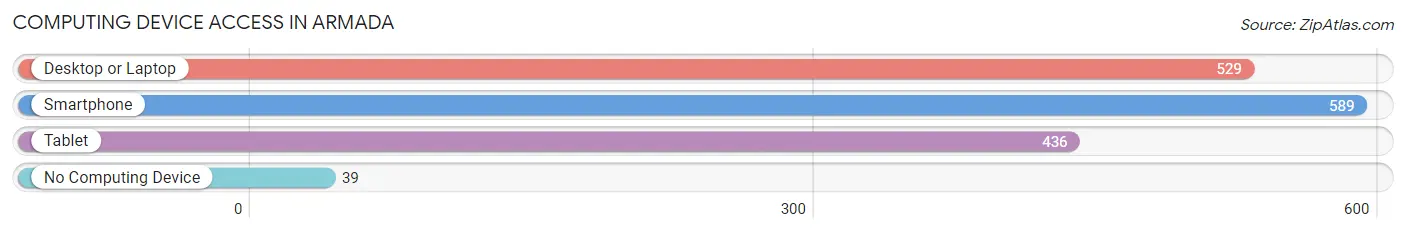
| Device Type | # Households | % Households |
| Desktop or Laptop | 529 | 80.5% |
| Smartphone | 589 | 89.6% |
| Tablet | 436 | 66.4% |
| No Computing Device | 39 | 5.9% |
| Total | 657 | 100.0% |
Internet Access in Armada
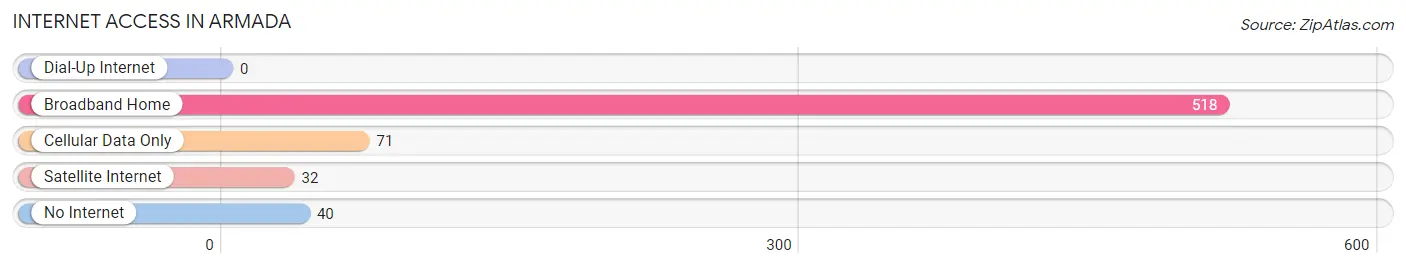
| Internet Type | # Households | % Households |
| Dial-Up Internet | 0 | 0.0% |
| Broadband Home | 518 | 78.8% |
| Cellular Data Only | 71 | 10.8% |
| Satellite Internet | 32 | 4.9% |
| No Internet | 40 | 6.1% |
| Total | 657 | 100.0% |
Armada Summary
Armada is a small village located in Macomb County, Michigan. It is situated about 25 miles north of Detroit and is part of the Metro Detroit area. The village has a population of about 1,700 people and is known for its rural charm and small-town atmosphere.
History
Armada was first settled in 1824 by a group of settlers from New York. The village was originally known as “Armada Center” and was named after the Spanish Armada. The village was incorporated in 1867 and was primarily an agricultural community. In the late 19th century, the village began to grow and develop as a result of the railroad and the lumber industry.
Geography
Armada is located in Macomb County, Michigan. It is situated about 25 miles north of Detroit and is part of the Metro Detroit area. The village is located on the banks of the Clinton River and is surrounded by rolling hills and farmland. The village has a total area of 1.2 square miles, all of which is land.
Economy
Armada’s economy is primarily based on agriculture and small businesses. The village is home to several small businesses, including a grocery store, a hardware store, a pharmacy, and a few restaurants. The village also has a few manufacturing companies, including a plastics company and a metal fabrication company.
Demographics
As of the 2010 census, the population of Armada was 1,744. The racial makeup of the village was 97.3% White, 0.7% African American, 0.3% Native American, 0.3% Asian, 0.2% from other races, and 1.2% from two or more races. Hispanic or Latino of any race were 1.2% of the population.
The median income for a household in the village was $50,938, and the median income for a family was $60,000. The per capita income for the village was $22,845. About 4.2% of families and 5.7% of the population were below the poverty line, including 6.3% of those under age 18 and 4.2% of those age 65 or over.
Armada is a small village with a rich history and a unique atmosphere. It is a great place to live and work, and it offers a variety of activities and attractions for residents and visitors alike. The village is home to a variety of businesses, and its economy is primarily based on agriculture and small businesses. The village has a diverse population and a median income that is slightly higher than the national average.
Common Questions
What is Per Capita Income in Armada?
Per Capita income in Armada is $38,156.
What is the Median Family Income in Armada?
Median Family Income in Armada is $125,100.
What is the Median Household income in Armada?
Median Household Income in Armada is $105,774.
What is Income or Wage Gap in Armada?
Income or Wage Gap in Armada is 42.2%.
Women in Armada earn 57.8 cents for every dollar earned by a man.
What is Inequality or Gini Index in Armada?
Inequality or Gini Index in Armada is 0.38.
What is the Total Population of Armada?
Total Population of Armada is 2,039.
What is the Total Male Population of Armada?
Total Male Population of Armada is 936.
What is the Total Female Population of Armada?
Total Female Population of Armada is 1,103.
What is the Ratio of Males per 100 Females in Armada?
There are 84.86 Males per 100 Females in Armada.
What is the Ratio of Females per 100 Males in Armada?
There are 117.84 Females per 100 Males in Armada.
What is the Median Population Age in Armada?
Median Population Age in Armada is 40.4 Years.
What is the Average Family Size in Armada
Average Family Size in Armada is 3.5 People.
What is the Average Household Size in Armada
Average Household Size in Armada is 3.0 People.
How Large is the Labor Force in Armada?
There are 927 People in the Labor Forcein in Armada.
What is the Percentage of People in the Labor Force in Armada?
59.2% of People are in the Labor Force in Armada.
What is the Unemployment Rate in Armada?
Unemployment Rate in Armada is 3.1%.