Walloon Lake, MI Map & Demographics
Walloon Lake Map
Walloon Lake Overview
$66,344
PER CAPITA INCOME
$107,386
AVG FAMILY INCOME
$89,531
AVG HOUSEHOLD INCOME
46.0%
WAGE / INCOME GAP [ % ]
54.0¢/ $1
WAGE / INCOME GAP [ $ ]
0.51
INEQUALITY / GINI INDEX
308
TOTAL POPULATION
193
MALE POPULATION
115
FEMALE POPULATION
167.83
MALES / 100 FEMALES
59.59
FEMALES / 100 MALES
45.3
MEDIAN AGE
2.6
AVG FAMILY SIZE
2.1
AVG HOUSEHOLD SIZE
163
LABOR FORCE [ PEOPLE ]
66.3%
PERCENT IN LABOR FORCE
1.2%
UNEMPLOYMENT RATE
Walloon Lake Zip Codes
Walloon Lake Area Codes
Income in Walloon Lake
Income Overview in Walloon Lake
Per Capita Income in Walloon Lake is $66,344, while median incomes of families and households are $107,386 and $89,531 respectively.
| Characteristic | Number | Measure |
| Per Capita Income | 308 | $66,344 |
| Median Family Income | 97 | $107,386 |
| Mean Family Income | 97 | $188,618 |
| Median Household Income | 143 | $89,531 |
| Mean Household Income | 143 | $147,929 |
| Income Deficit | 97 | $0 |
| Wage / Income Gap (%) | 308 | 45.98% |
| Wage / Income Gap ($) | 308 | 54.02¢ per $1 |
| Gini / Inequality Index | 308 | 0.51 |
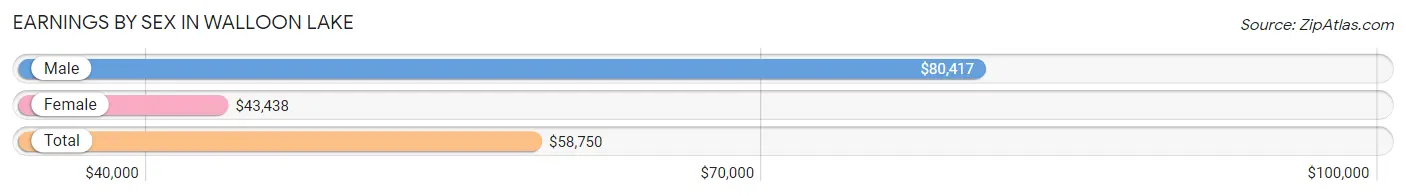
Earnings by Sex in Walloon Lake
Average Earnings in Walloon Lake are $58,750, $80,417 for men and $43,438 for women, a difference of 46.0%.
| Sex | Number | Average Earnings |
| Male | 103 (61.3%) | $80,417 |
| Female | 65 (38.7%) | $43,438 |
| Total | 168 (100.0%) | $58,750 |
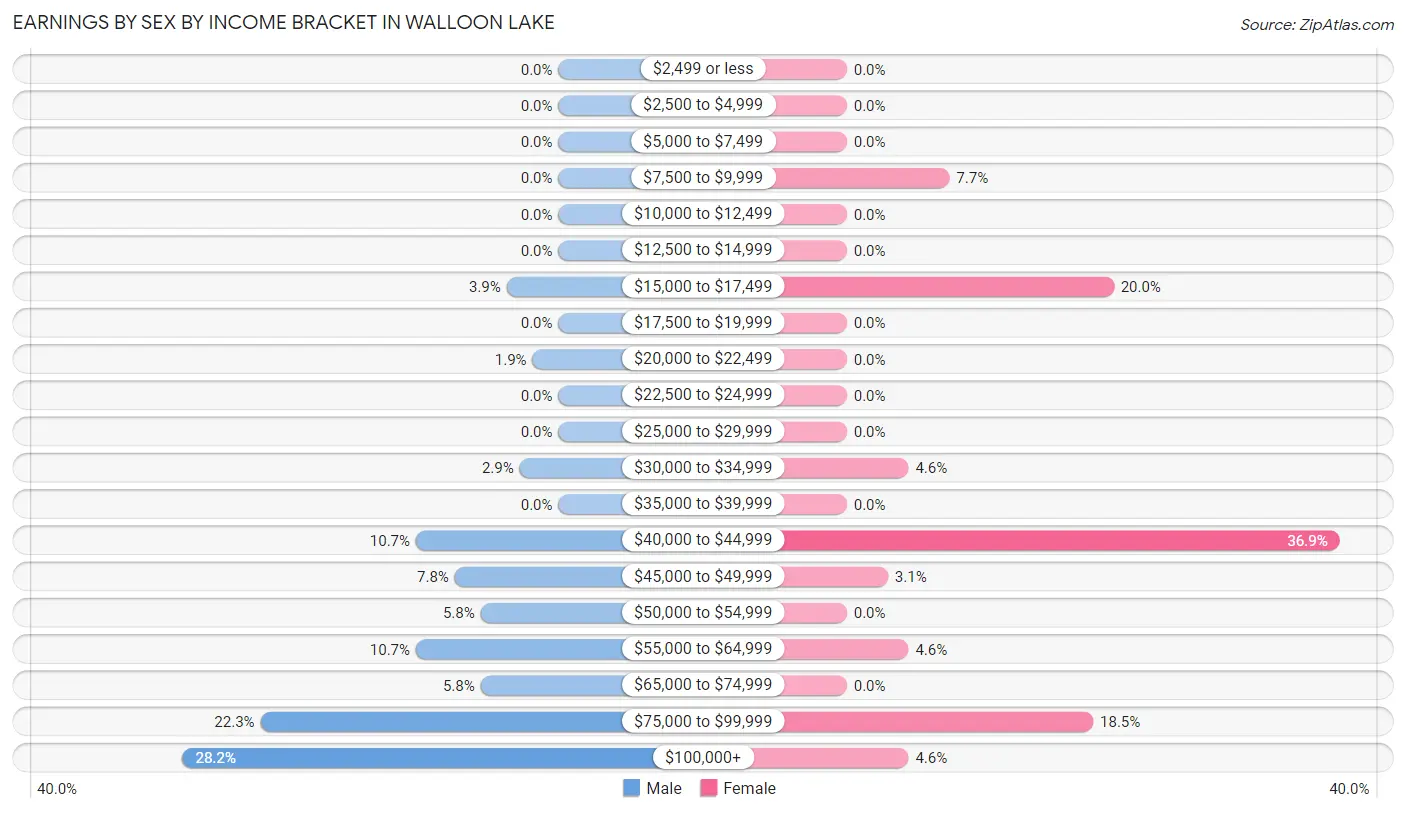
Earnings by Sex by Income Bracket in Walloon Lake
The most common earnings brackets in Walloon Lake are $100,000+ for men (29 | 28.2%) and $40,000 to $44,999 for women (24 | 36.9%).
| Income | Male | Female |
| $2,499 or less | 0 (0.0%) | 0 (0.0%) |
| $2,500 to $4,999 | 0 (0.0%) | 0 (0.0%) |
| $5,000 to $7,499 | 0 (0.0%) | 0 (0.0%) |
| $7,500 to $9,999 | 0 (0.0%) | 5 (7.7%) |
| $10,000 to $12,499 | 0 (0.0%) | 0 (0.0%) |
| $12,500 to $14,999 | 0 (0.0%) | 0 (0.0%) |
| $15,000 to $17,499 | 4 (3.9%) | 13 (20.0%) |
| $17,500 to $19,999 | 0 (0.0%) | 0 (0.0%) |
| $20,000 to $22,499 | 2 (1.9%) | 0 (0.0%) |
| $22,500 to $24,999 | 0 (0.0%) | 0 (0.0%) |
| $25,000 to $29,999 | 0 (0.0%) | 0 (0.0%) |
| $30,000 to $34,999 | 3 (2.9%) | 3 (4.6%) |
| $35,000 to $39,999 | 0 (0.0%) | 0 (0.0%) |
| $40,000 to $44,999 | 11 (10.7%) | 24 (36.9%) |
| $45,000 to $49,999 | 8 (7.8%) | 2 (3.1%) |
| $50,000 to $54,999 | 6 (5.8%) | 0 (0.0%) |
| $55,000 to $64,999 | 11 (10.7%) | 3 (4.6%) |
| $65,000 to $74,999 | 6 (5.8%) | 0 (0.0%) |
| $75,000 to $99,999 | 23 (22.3%) | 12 (18.5%) |
| $100,000+ | 29 (28.2%) | 3 (4.6%) |
| Total | 103 (100.0%) | 65 (100.0%) |
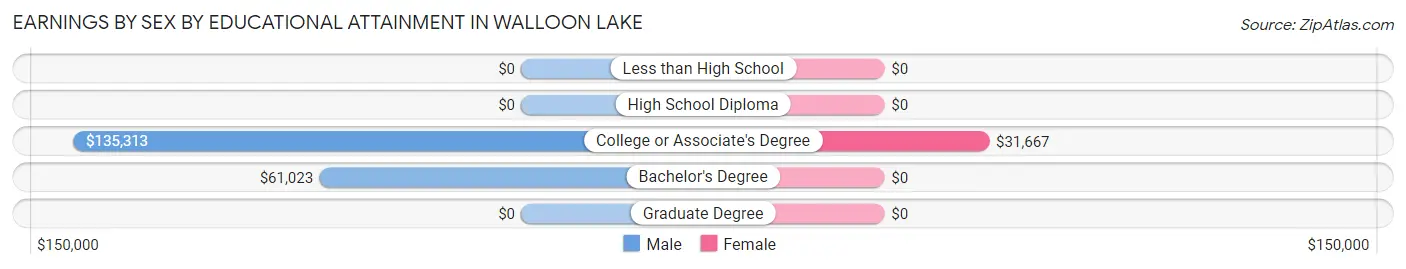
Earnings by Sex by Educational Attainment in Walloon Lake
Average earnings in Walloon Lake are $81,250 for men and $43,438 for women, a difference of 46.5%. Men with an educational attainment of college or associate's degree enjoy the highest average annual earnings of $135,313, while those with bachelor's degree education earn the least with $61,023. Women with an educational attainment of college or associate's degree earn the most with the average annual earnings of $31,667, while those with college or associate's degree education have the smallest earnings of $31,667.
| Educational Attainment | Male Income | Female Income |
| Less than High School | - | - |
| High School Diploma | - | - |
| College or Associate's Degree | $135,313 | $31,667 |
| Bachelor's Degree | $61,023 | $0 |
| Graduate Degree | - | - |
| Total | $81,250 | $43,438 |
Family Income in Walloon Lake
Family Income Brackets in Walloon Lake
According to the Walloon Lake family income data, there are 30 families falling into the $100,000 to $149,999 income range, which is the most common income bracket and makes up 30.9% of all families.
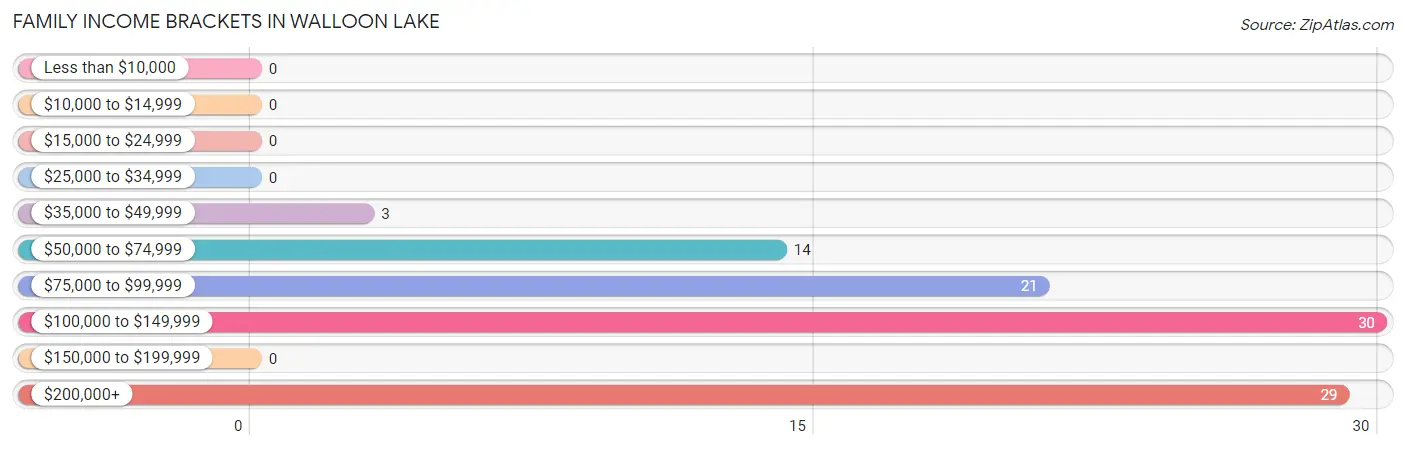
| Income Bracket | # Families | % Families |
| Less than $10,000 | 0 | 0.0% |
| $10,000 to $14,999 | 0 | 0.0% |
| $15,000 to $24,999 | 0 | 0.0% |
| $25,000 to $34,999 | 0 | 0.0% |
| $35,000 to $49,999 | 3 | 3.1% |
| $50,000 to $74,999 | 14 | 14.4% |
| $75,000 to $99,999 | 21 | 21.6% |
| $100,000 to $149,999 | 30 | 30.9% |
| $150,000 to $199,999 | 0 | 0.0% |
| $200,000+ | 29 | 29.9% |
Family Income by Famaliy Size in Walloon Lake
5-person families (14 | 14.4%) account for the highest median family income in Walloon Lake with $111,250 per family, while 3-person families (21 | 21.6%) have the highest median income of $27,083 per family member.
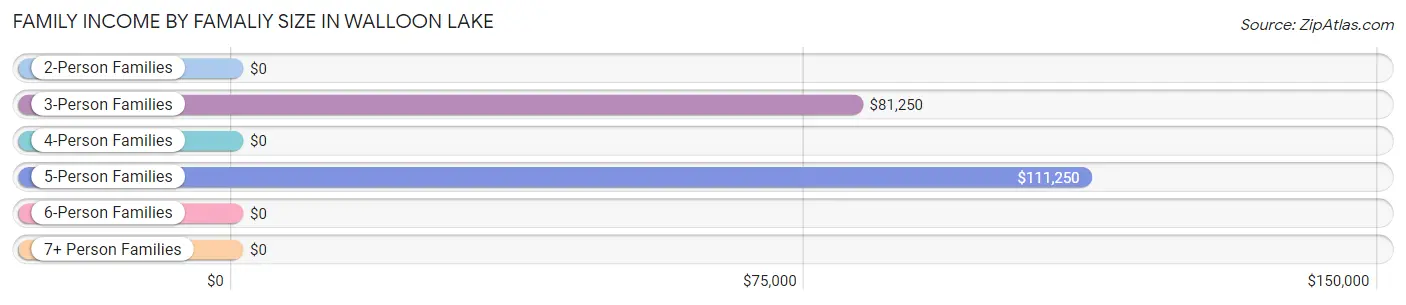
| Income Bracket | # Families | Median Income |
| 2-Person Families | 57 (58.8%) | $0 |
| 3-Person Families | 21 (21.6%) | $81,250 |
| 4-Person Families | 5 (5.1%) | $0 |
| 5-Person Families | 14 (14.4%) | $111,250 |
| 6-Person Families | 0 (0.0%) | $0 |
| 7+ Person Families | 0 (0.0%) | $0 |
| Total | 97 (100.0%) | $107,386 |
Family Income by Number of Earners in Walloon Lake
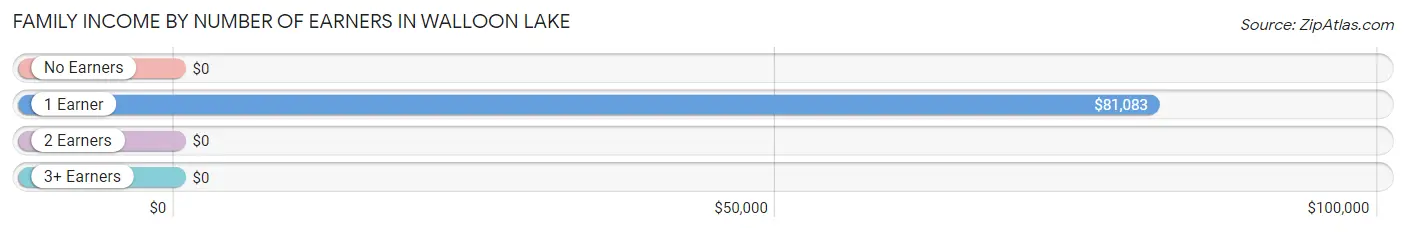
| Number of Earners | # Families | Median Income |
| No Earners | 10 (10.3%) | $0 |
| 1 Earner | 29 (29.9%) | $81,083 |
| 2 Earners | 55 (56.7%) | $0 |
| 3+ Earners | 3 (3.1%) | $0 |
| Total | 97 (100.0%) | $107,386 |
Household Income in Walloon Lake
Household Income Brackets in Walloon Lake
With 33 households falling in the category, the $100,000 to $149,999 income range is the most frequent in Walloon Lake, accounting for 23.1% of all households.
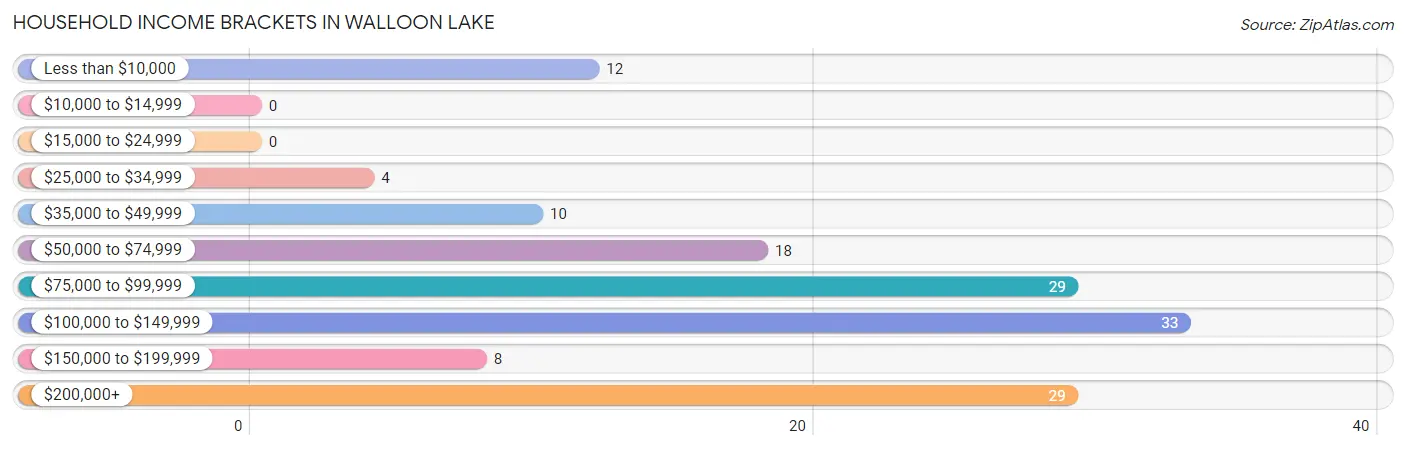
| Income Bracket | # Households | % Households |
| Less than $10,000 | 12 | 8.4% |
| $10,000 to $14,999 | 0 | 0.0% |
| $15,000 to $24,999 | 0 | 0.0% |
| $25,000 to $34,999 | 4 | 2.8% |
| $35,000 to $49,999 | 10 | 7.0% |
| $50,000 to $74,999 | 18 | 12.6% |
| $75,000 to $99,999 | 29 | 20.3% |
| $100,000 to $149,999 | 33 | 23.1% |
| $150,000 to $199,999 | 8 | 5.6% |
| $200,000+ | 29 | 20.3% |
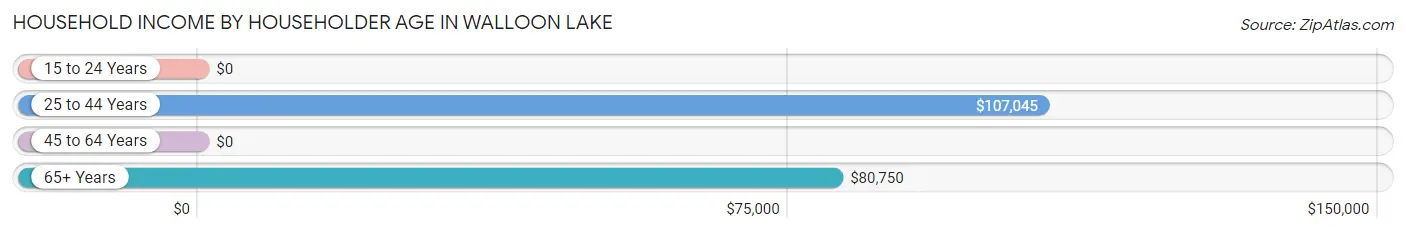
Household Income by Householder Age in Walloon Lake
The median household income in Walloon Lake is $89,531, with the highest median household income of $107,045 found in the 25 to 44 years age bracket for the primary householder. A total of 60 households (42.0%) fall into this category.
| Income Bracket | # Households | Median Income |
| 15 to 24 Years | 0 (0.0%) | $0 |
| 25 to 44 Years | 60 (42.0%) | $107,045 |
| 45 to 64 Years | 46 (32.2%) | $0 |
| 65+ Years | 37 (25.9%) | $80,750 |
| Total | 143 (100.0%) | $89,531 |
Poverty in Walloon Lake
Income Below Poverty by Sex and Age in Walloon Lake
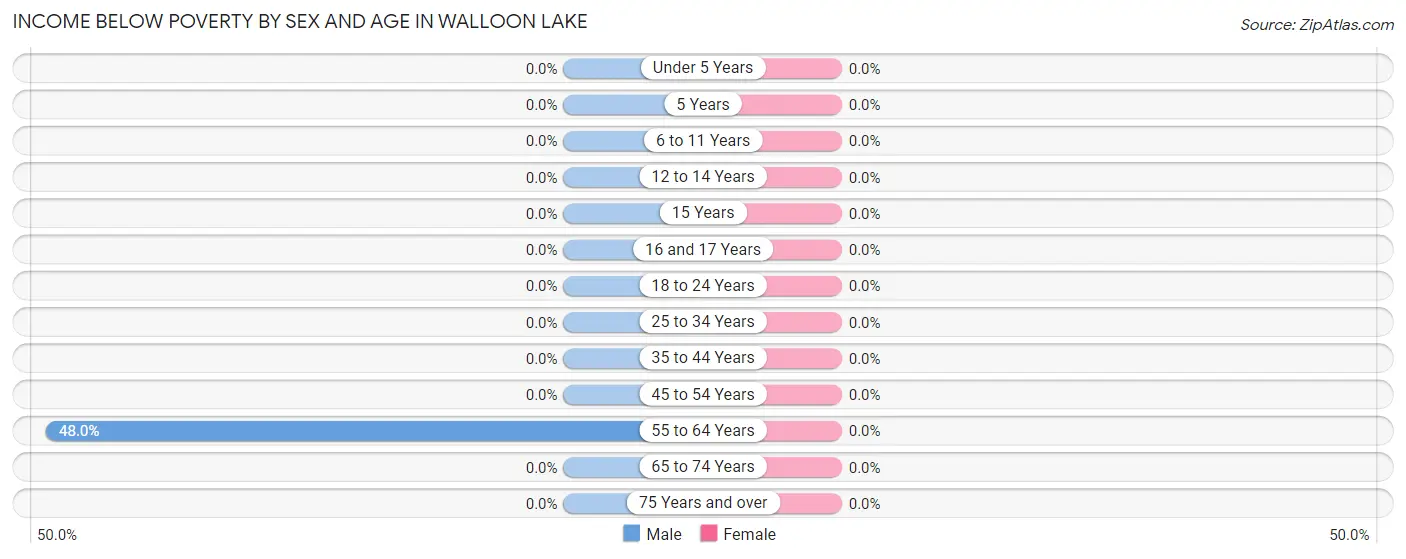
| Age Bracket | Male | Female |
| Under 5 Years | 0 (0.0%) | 0 (0.0%) |
| 5 Years | 0 (0.0%) | 0 (0.0%) |
| 6 to 11 Years | 0 (0.0%) | 0 (0.0%) |
| 12 to 14 Years | 0 (0.0%) | 0 (0.0%) |
| 15 Years | 0 (0.0%) | 0 (0.0%) |
| 16 and 17 Years | 0 (0.0%) | 0 (0.0%) |
| 18 to 24 Years | 0 (0.0%) | 0 (0.0%) |
| 25 to 34 Years | 0 (0.0%) | 0 (0.0%) |
| 35 to 44 Years | 0 (0.0%) | 0 (0.0%) |
| 45 to 54 Years | 0 (0.0%) | 0 (0.0%) |
| 55 to 64 Years | 12 (48.0%) | 0 (0.0%) |
| 65 to 74 Years | 0 (0.0%) | 0 (0.0%) |
| 75 Years and over | 0 (0.0%) | 0 (0.0%) |
| Total | 12 (6.2%) | 0 (0.0%) |
Income Above Poverty by Sex and Age in Walloon Lake
According to the poverty statistics in Walloon Lake, males aged under 5 years and females aged 5 years are the age groups that are most secure financially, with 100.0% of males and 100.0% of females in these age groups living above the poverty line.
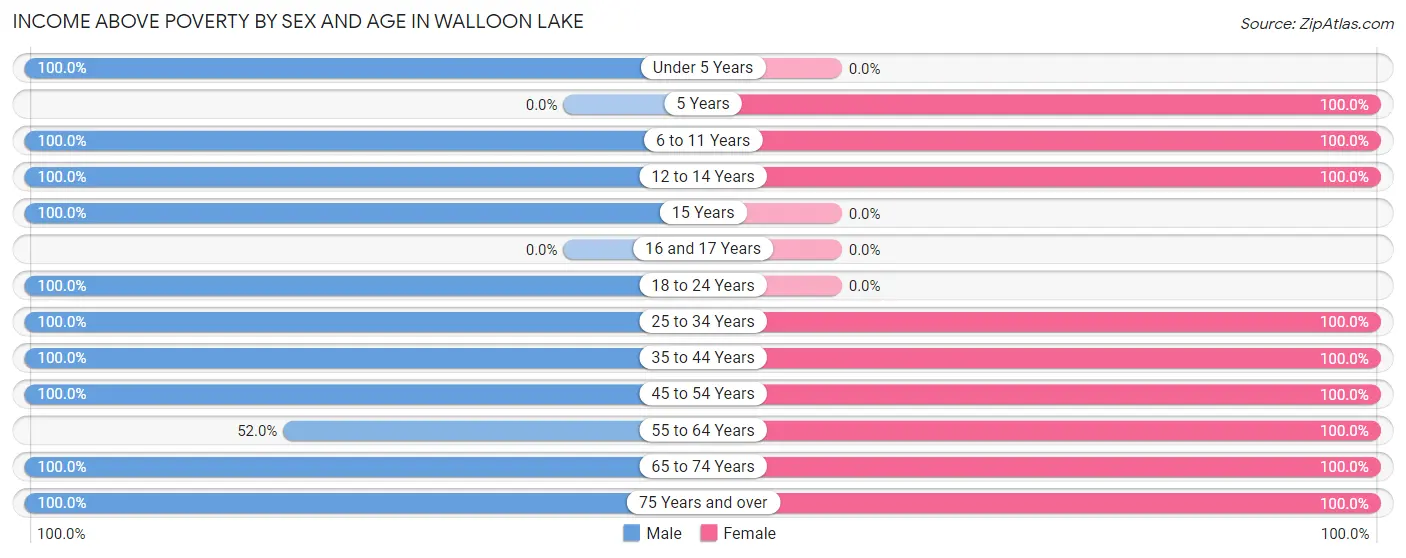
| Age Bracket | Male | Female |
| Under 5 Years | 2 (100.0%) | 0 (0.0%) |
| 5 Years | 0 (0.0%) | 2 (100.0%) |
| 6 to 11 Years | 26 (100.0%) | 2 (100.0%) |
| 12 to 14 Years | 9 (100.0%) | 6 (100.0%) |
| 15 Years | 15 (100.0%) | 0 (0.0%) |
| 16 and 17 Years | 0 (0.0%) | 0 (0.0%) |
| 18 to 24 Years | 2 (100.0%) | 0 (0.0%) |
| 25 to 34 Years | 28 (100.0%) | 20 (100.0%) |
| 35 to 44 Years | 19 (100.0%) | 21 (100.0%) |
| 45 to 54 Years | 29 (100.0%) | 22 (100.0%) |
| 55 to 64 Years | 13 (52.0%) | 15 (100.0%) |
| 65 to 74 Years | 23 (100.0%) | 9 (100.0%) |
| 75 Years and over | 15 (100.0%) | 18 (100.0%) |
| Total | 181 (93.8%) | 115 (100.0%) |
Income Below Poverty Among Married-Couple Families in Walloon Lake
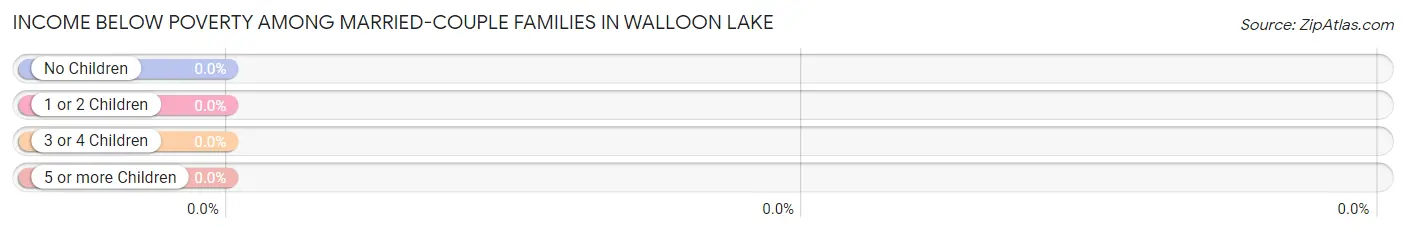
| Children | Above Poverty | Below Poverty |
| No Children | 70 (100.0%) | 0 (0.0%) |
| 1 or 2 Children | 5 (100.0%) | 0 (0.0%) |
| 3 or 4 Children | 14 (100.0%) | 0 (0.0%) |
| 5 or more Children | 0 (0.0%) | 0 (0.0%) |
| Total | 89 (100.0%) | 0 (0.0%) |
Income Below Poverty Among Single-Parent Households in Walloon Lake
| Children | Single Father | Single Mother |
| No Children | 0 (0.0%) | 0 (0.0%) |
| 1 or 2 Children | 0 (0.0%) | 0 (0.0%) |
| 3 or 4 Children | 0 (0.0%) | 0 (0.0%) |
| 5 or more Children | 0 (0.0%) | 0 (0.0%) |
| Total | 0 (0.0%) | 0 (0.0%) |
Income Below Poverty Among Married-Couple vs Single-Parent Households in Walloon Lake
| Children | Married-Couple Families | Single-Parent Households |
| No Children | 0 (0.0%) | 0 (0.0%) |
| 1 or 2 Children | 0 (0.0%) | 0 (0.0%) |
| 3 or 4 Children | 0 (0.0%) | 0 (0.0%) |
| 5 or more Children | 0 (0.0%) | 0 (0.0%) |
| Total | 0 (0.0%) | 0 (0.0%) |
Race in Walloon Lake
The most populous races in Walloon Lake are White / Caucasian (301 | 97.7%), Hispanic or Latino (9 | 2.9%), and Some other Race (5 | 1.6%).
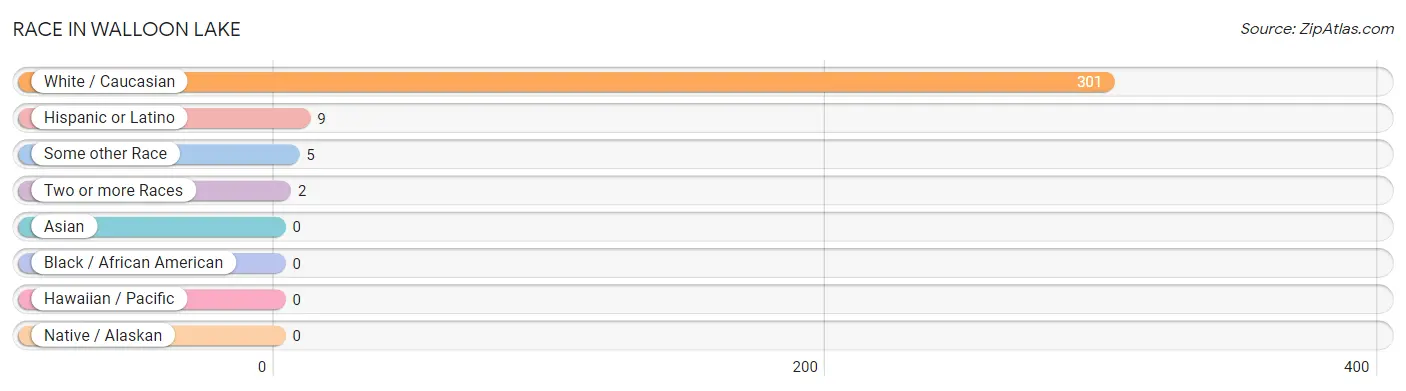
| Race | # Population | % Population |
| Asian | 0 | 0.0% |
| Black / African American | 0 | 0.0% |
| Hawaiian / Pacific | 0 | 0.0% |
| Hispanic or Latino | 9 | 2.9% |
| Native / Alaskan | 0 | 0.0% |
| White / Caucasian | 301 | 97.7% |
| Two or more Races | 2 | 0.6% |
| Some other Race | 5 | 1.6% |
| Total | 308 | 100.0% |
Ancestry in Walloon Lake
The most populous ancestries reported in Walloon Lake are English (71 | 23.1%), French (49 | 15.9%), Hungarian (46 | 14.9%), Polish (34 | 11.0%), and Dutch (27 | 8.8%), together accounting for 73.7% of all Walloon Lake residents.
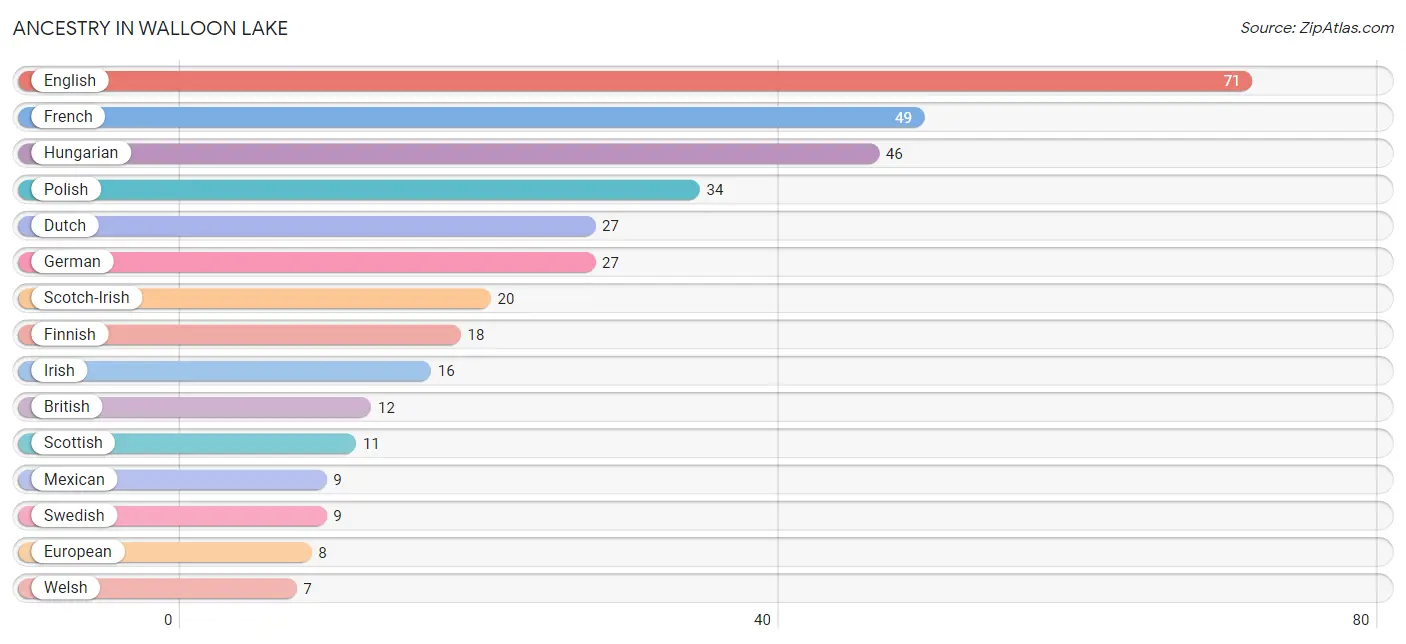
| Ancestry | # Population | % Population |
| Arab | 4 | 1.3% |
| British | 12 | 3.9% |
| Chippewa | 2 | 0.6% |
| Czech | 3 | 1.0% |
| Danish | 3 | 1.0% |
| Dutch | 27 | 8.8% |
| English | 71 | 23.1% |
| European | 8 | 2.6% |
| Finnish | 18 | 5.8% |
| French | 49 | 15.9% |
| German | 27 | 8.8% |
| Hungarian | 46 | 14.9% |
| Irish | 16 | 5.2% |
| Italian | 4 | 1.3% |
| Lebanese | 4 | 1.3% |
| Lithuanian | 3 | 1.0% |
| Mexican | 9 | 2.9% |
| Norwegian | 5 | 1.6% |
| Polish | 34 | 11.0% |
| Scotch-Irish | 20 | 6.5% |
| Scottish | 11 | 3.6% |
| Swedish | 9 | 2.9% |
| Welsh | 7 | 2.3% | View All 23 Rows |
Immigrants in Walloon Lake

| Immigration Origin | # Population | % Population | View All 0 Rows |
Sex and Age in Walloon Lake
Sex and Age in Walloon Lake
The most populous age groups in Walloon Lake are 50 to 54 Years (24 | 12.4%) for men and 25 to 29 Years (18 | 15.7%) for women.
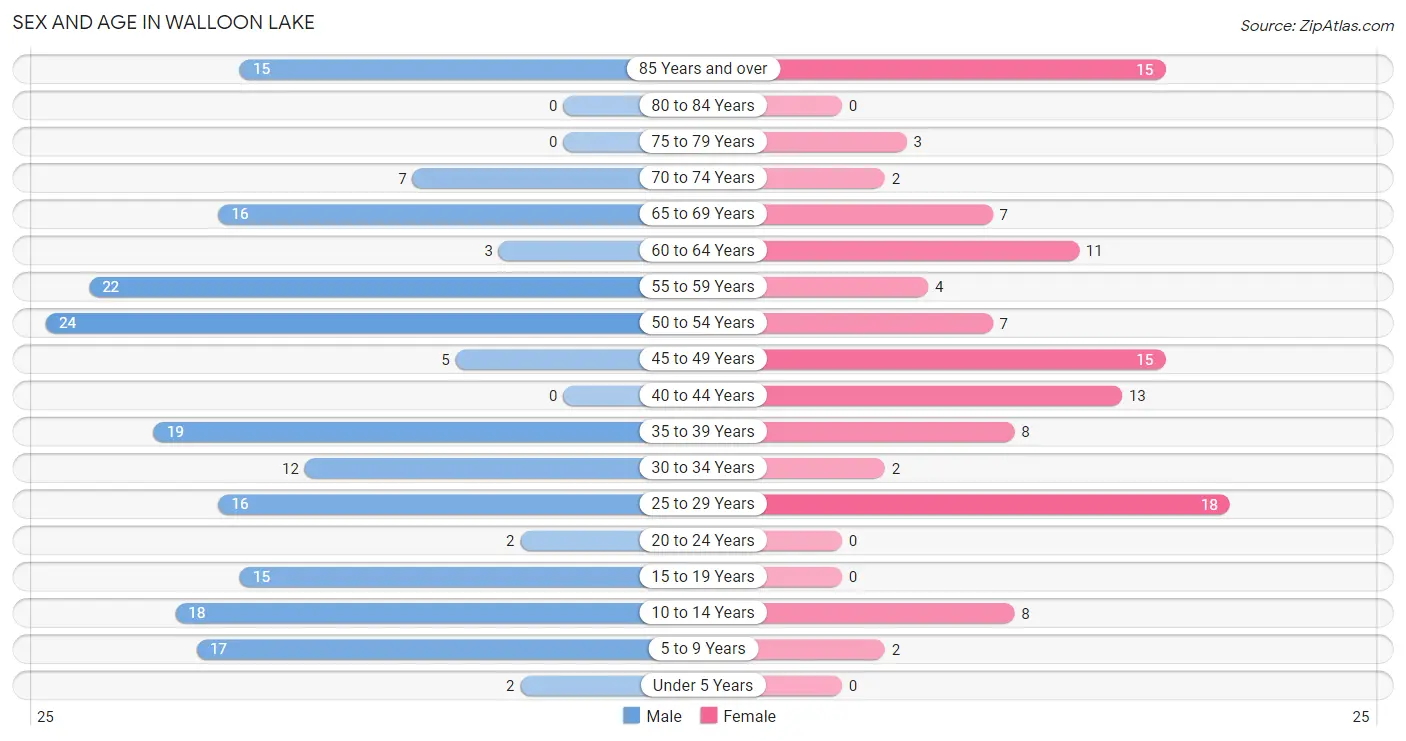
| Age Bracket | Male | Female |
| Under 5 Years | 2 (1.0%) | 0 (0.0%) |
| 5 to 9 Years | 17 (8.8%) | 2 (1.7%) |
| 10 to 14 Years | 18 (9.3%) | 8 (7.0%) |
| 15 to 19 Years | 15 (7.8%) | 0 (0.0%) |
| 20 to 24 Years | 2 (1.0%) | 0 (0.0%) |
| 25 to 29 Years | 16 (8.3%) | 18 (15.7%) |
| 30 to 34 Years | 12 (6.2%) | 2 (1.7%) |
| 35 to 39 Years | 19 (9.8%) | 8 (7.0%) |
| 40 to 44 Years | 0 (0.0%) | 13 (11.3%) |
| 45 to 49 Years | 5 (2.6%) | 15 (13.0%) |
| 50 to 54 Years | 24 (12.4%) | 7 (6.1%) |
| 55 to 59 Years | 22 (11.4%) | 4 (3.5%) |
| 60 to 64 Years | 3 (1.5%) | 11 (9.6%) |
| 65 to 69 Years | 16 (8.3%) | 7 (6.1%) |
| 70 to 74 Years | 7 (3.6%) | 2 (1.7%) |
| 75 to 79 Years | 0 (0.0%) | 3 (2.6%) |
| 80 to 84 Years | 0 (0.0%) | 0 (0.0%) |
| 85 Years and over | 15 (7.8%) | 15 (13.0%) |
| Total | 193 (100.0%) | 115 (100.0%) |
Families and Households in Walloon Lake
Median Family Size in Walloon Lake
The median family size in Walloon Lake is 2.57 persons per family, with single female/mother families (3 | 3.1%) accounting for the largest median family size of 2.67 persons per family. On the other hand, single male/father families (5 | 5.1%) represent the smallest median family size with 1.40 persons per family.
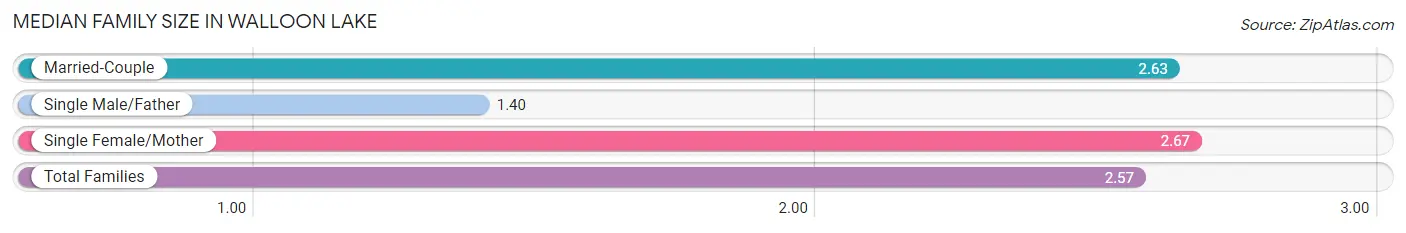
| Family Type | # Families | Family Size |
| Married-Couple | 89 (91.7%) | 2.63 |
| Single Male/Father | 5 (5.1%) | 1.40 |
| Single Female/Mother | 3 (3.1%) | 2.67 |
| Total Families | 97 (100.0%) | 2.57 |
Median Household Size in Walloon Lake
The median household size in Walloon Lake is 2.11 persons per household, with single female/mother households (3 | 2.1%) accounting for the largest median household size of 2.67 persons per household. non-family households (46 | 32.2%) represent the smallest median household size with 1.15 persons per household.
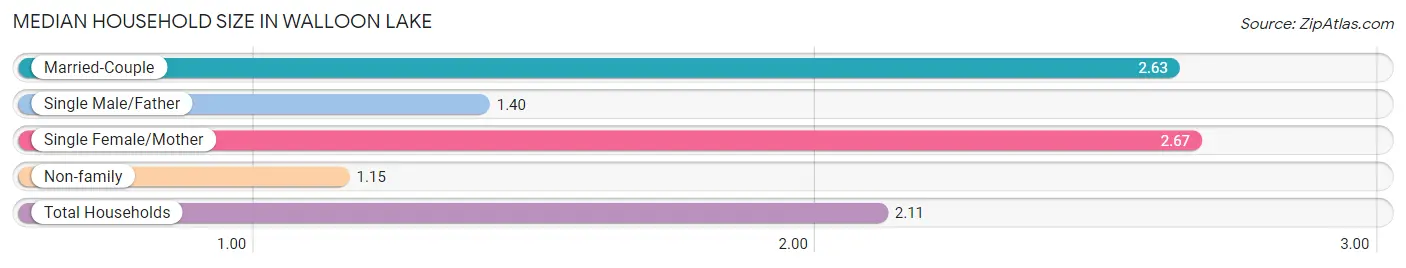
| Household Type | # Households | Household Size |
| Married-Couple | 89 (62.2%) | 2.63 |
| Single Male/Father | 5 (3.5%) | 1.40 |
| Single Female/Mother | 3 (2.1%) | 2.67 |
| Non-family | 46 (32.2%) | 1.15 |
| Total Households | 143 (100.0%) | 2.11 |
Household Size by Marriage Status in Walloon Lake
Out of a total of 143 households in Walloon Lake, 97 (67.8%) are family households, while 46 (32.2%) are nonfamily households. The most numerous type of family households are 2-person households, comprising 57, and the most common type of nonfamily households are 1-person households, comprising 38.
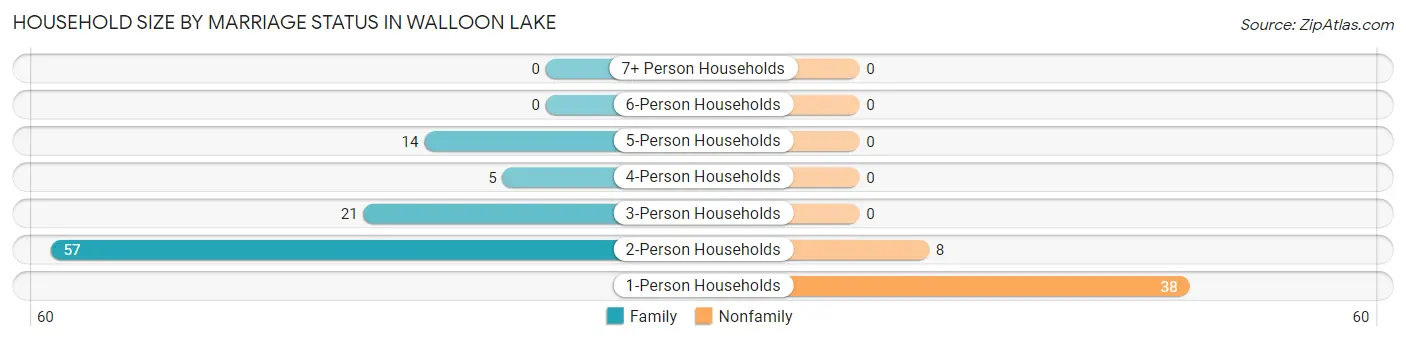
| Household Size | Family Households | Nonfamily Households |
| 1-Person Households | - | 38 (26.6%) |
| 2-Person Households | 57 (39.9%) | 8 (5.6%) |
| 3-Person Households | 21 (14.7%) | 0 (0.0%) |
| 4-Person Households | 5 (3.5%) | 0 (0.0%) |
| 5-Person Households | 14 (9.8%) | 0 (0.0%) |
| 6-Person Households | 0 (0.0%) | 0 (0.0%) |
| 7+ Person Households | 0 (0.0%) | 0 (0.0%) |
| Total | 97 (67.8%) | 46 (32.2%) |
Female Fertility in Walloon Lake
Fertility by Age in Walloon Lake
Average fertility rate in Walloon Lake is 54.0 births per 1,000 women. Women in the age bracket of 35 to 50 years have the highest fertility rate with 83.0 births per 1,000 women. Women in the age bracket of 35 to 50 years acount for 100.0% of all women with births.
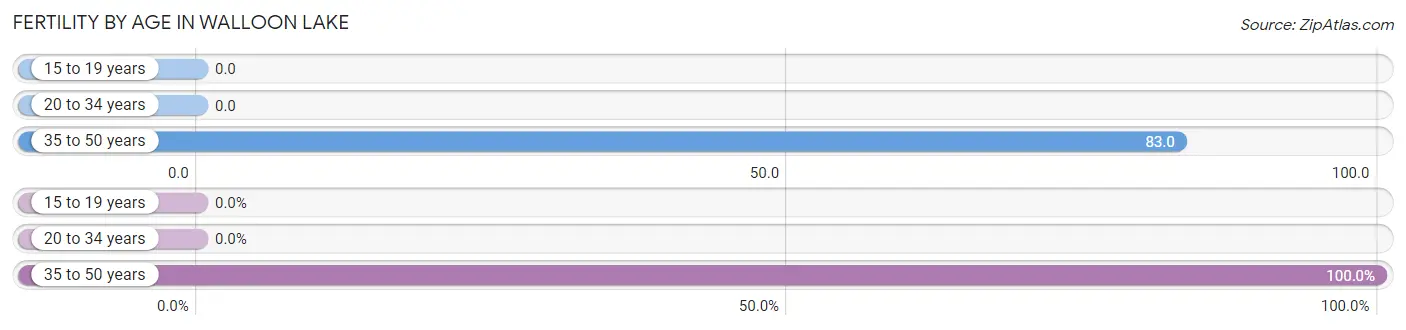
| Age Bracket | Women with Births | Births / 1,000 Women |
| 15 to 19 years | 0 (0.0%) | 0.0 |
| 20 to 34 years | 0 (0.0%) | 0.0 |
| 35 to 50 years | 3 (100.0%) | 83.0 |
| Total | 3 (100.0%) | 54.0 |
Fertility by Age by Marriage Status in Walloon Lake
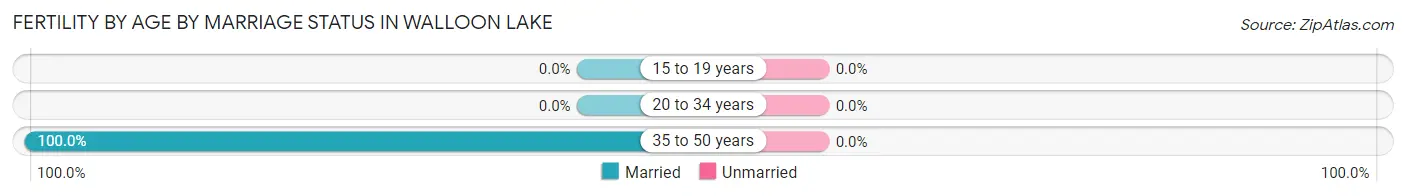
| Age Bracket | Married | Unmarried |
| 15 to 19 years | 0 (0.0%) | 0 (0.0%) |
| 20 to 34 years | 0 (0.0%) | 0 (0.0%) |
| 35 to 50 years | 3 (100.0%) | 0 (0.0%) |
| Total | 3 (100.0%) | 0 (0.0%) |
Fertility by Education in Walloon Lake
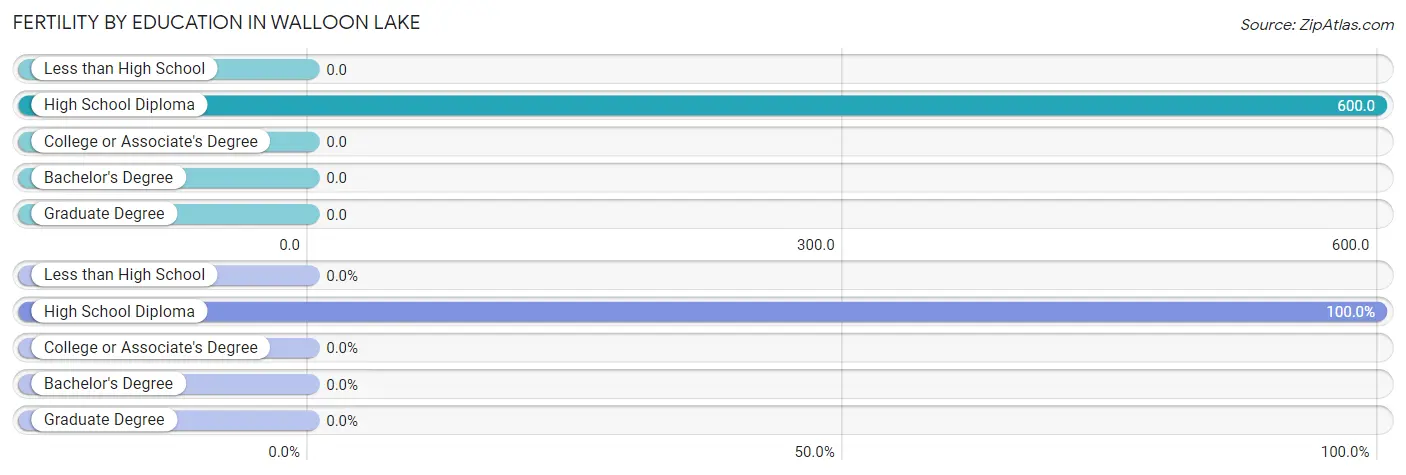
| Educational Attainment | Women with Births | Births / 1,000 Women |
| Less than High School | 0 (0.0%) | 0.0 |
| High School Diploma | 3 (100.0%) | 600.0 |
| College or Associate's Degree | 0 (0.0%) | 0.0 |
| Bachelor's Degree | 0 (0.0%) | 0.0 |
| Graduate Degree | 0 (0.0%) | 0.0 |
| Total | 3 (100.0%) | 54.0 |
Fertility by Education by Marriage Status in Walloon Lake
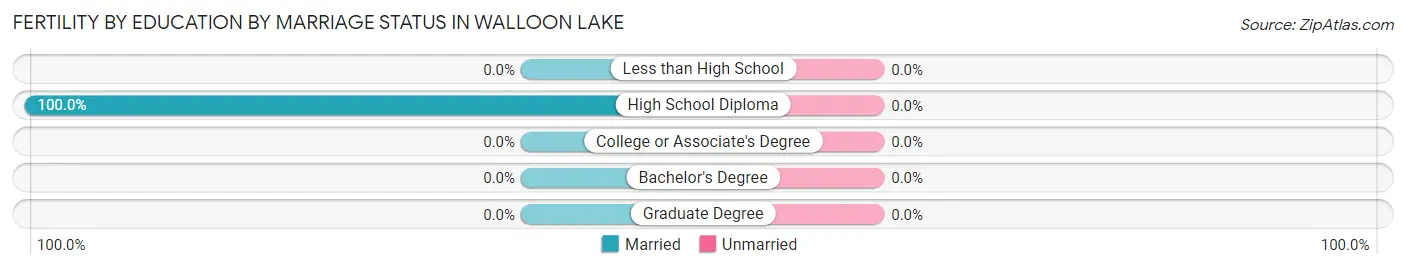
| Educational Attainment | Married | Unmarried |
| Less than High School | 0 (0.0%) | 0 (0.0%) |
| High School Diploma | 3 (100.0%) | 0 (0.0%) |
| College or Associate's Degree | 0 (0.0%) | 0 (0.0%) |
| Bachelor's Degree | 0 (0.0%) | 0 (0.0%) |
| Graduate Degree | 0 (0.0%) | 0 (0.0%) |
| Total | 3 (100.0%) | 0 (0.0%) |
Employment Characteristics in Walloon Lake
Employment by Class of Employer in Walloon Lake
Among the 161 employed individuals in Walloon Lake, private company employees (90 | 55.9%), not-for-profit organizations (35 | 21.7%), and self-employed (not incorporated) (17 | 10.6%) make up the most common classes of employment.
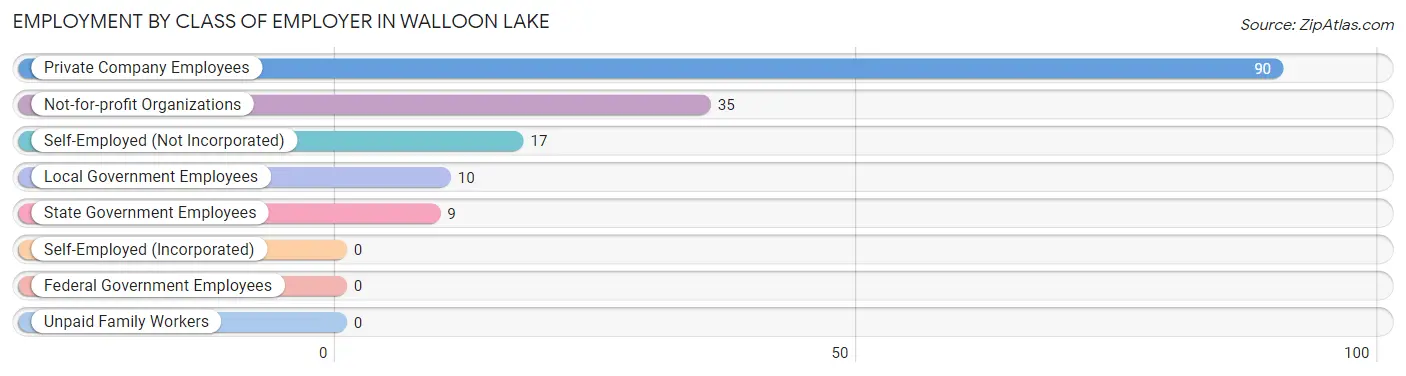
| Employer Class | # Employees | % Employees |
| Private Company Employees | 90 | 55.9% |
| Self-Employed (Incorporated) | 0 | 0.0% |
| Self-Employed (Not Incorporated) | 17 | 10.6% |
| Not-for-profit Organizations | 35 | 21.7% |
| Local Government Employees | 10 | 6.2% |
| State Government Employees | 9 | 5.6% |
| Federal Government Employees | 0 | 0.0% |
| Unpaid Family Workers | 0 | 0.0% |
| Total | 161 | 100.0% |
Employment Status by Age in Walloon Lake
According to the labor force statistics for Walloon Lake, out of the total population over 16 years of age (246), 66.3% or 163 individuals are in the labor force, with 1.2% or 2 of them unemployed. The age group with the highest labor force participation rate is 20 to 24 years, with 100.0% or 2 individuals in the labor force. Within the labor force, the 20 to 24 years age range has the highest percentage of unemployed individuals, with 100.0% or 2 of them being unemployed.
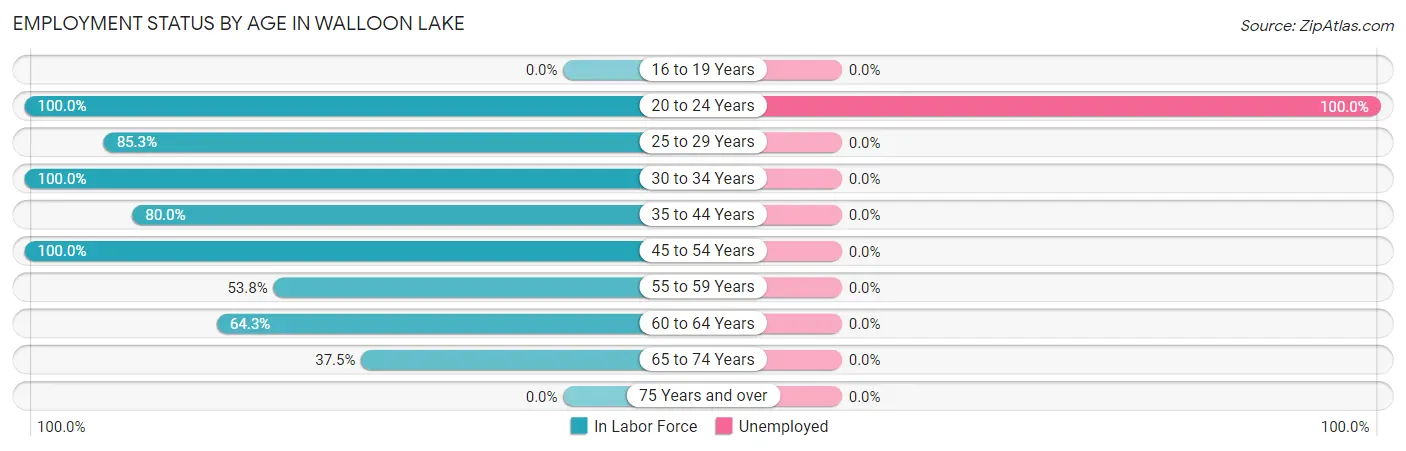
| Age Bracket | In Labor Force | Unemployed |
| 16 to 19 Years | 0 (0.0%) | 0 (0.0%) |
| 20 to 24 Years | 2 (100.0%) | 2 (100.0%) |
| 25 to 29 Years | 29 (85.3%) | 0 (0.0%) |
| 30 to 34 Years | 14 (100.0%) | 0 (0.0%) |
| 35 to 44 Years | 32 (80.0%) | 0 (0.0%) |
| 45 to 54 Years | 51 (100.0%) | 0 (0.0%) |
| 55 to 59 Years | 14 (53.8%) | 0 (0.0%) |
| 60 to 64 Years | 9 (64.3%) | 0 (0.0%) |
| 65 to 74 Years | 12 (37.5%) | 0 (0.0%) |
| 75 Years and over | 0 (0.0%) | 0 (0.0%) |
| Total | 163 (66.3%) | 2 (1.2%) |
Employment Status by Educational Attainment in Walloon Lake
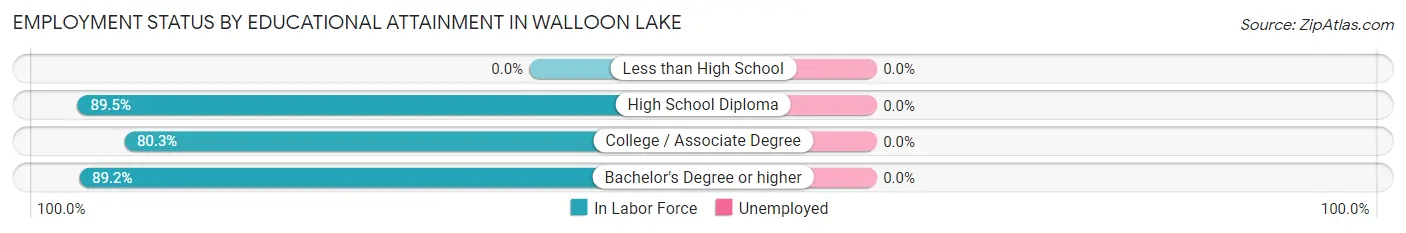
| Educational Attainment | In Labor Force | Unemployed |
| Less than High School | 0 (0.0%) | 0 (0.0%) |
| High School Diploma | 17 (89.5%) | 0 (0.0%) |
| College / Associate Degree | 49 (80.3%) | 0 (0.0%) |
| Bachelor's Degree or higher | 83 (89.2%) | 0 (0.0%) |
| Total | 149 (83.2%) | 0 (0.0%) |
Employment Occupations by Sex in Walloon Lake
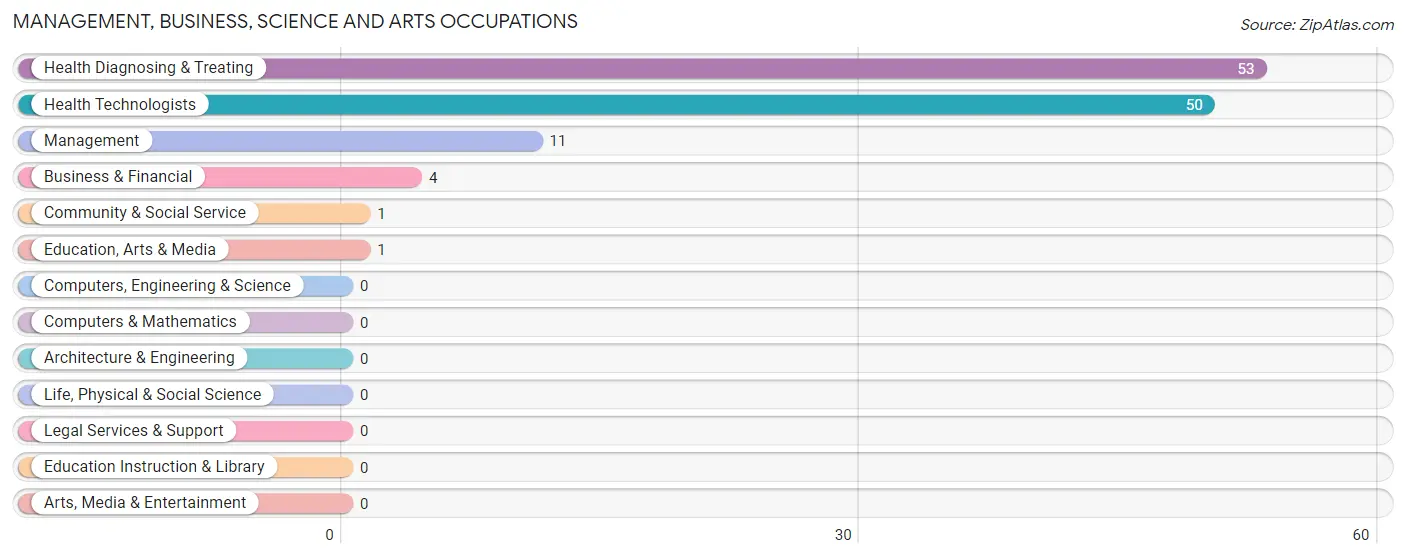
Management, Business, Science and Arts Occupations
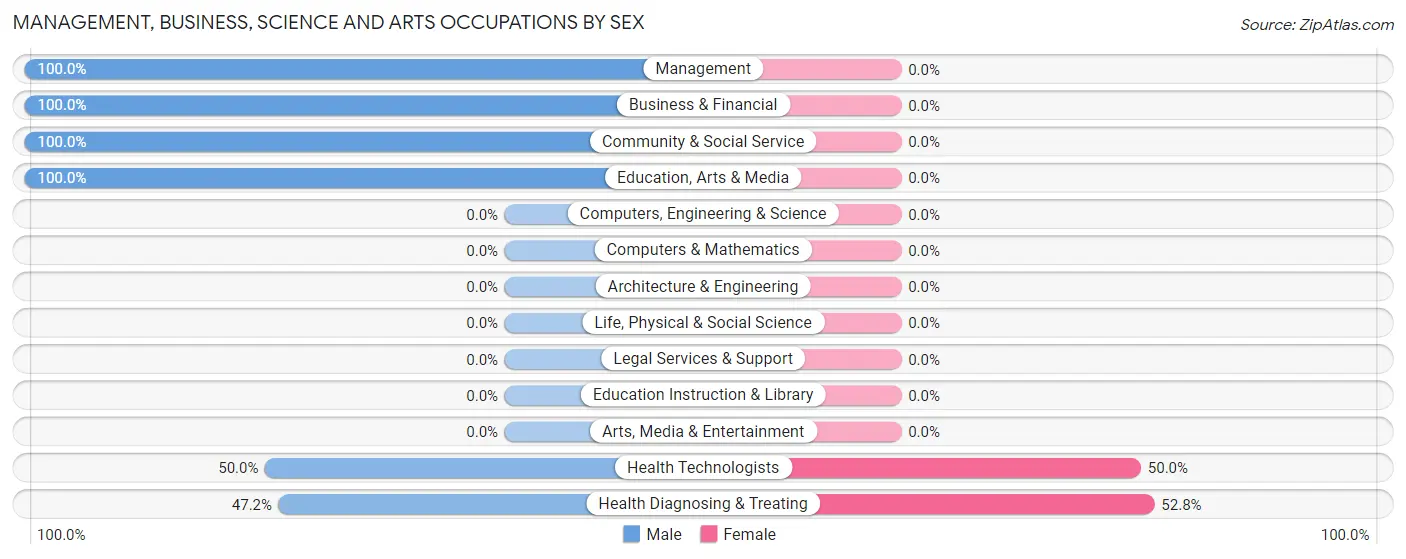
The most common Management, Business, Science and Arts occupations in Walloon Lake are Health Diagnosing & Treating (53 | 32.9%), Health Technologists (50 | 31.1%), Management (11 | 6.8%), Business & Financial (4 | 2.5%), and Community & Social Service (1 | 0.6%).
Management, Business, Science and Arts Occupations by Sex
Within the Management, Business, Science and Arts occupations in Walloon Lake, the most male-oriented occupations are Management (100.0%), Business & Financial (100.0%), and Community & Social Service (100.0%), while the most female-oriented occupations are Health Diagnosing & Treating (52.8%), and Health Technologists (50.0%).
| Occupation | Male | Female |
| Management | 11 (100.0%) | 0 (0.0%) |
| Business & Financial | 4 (100.0%) | 0 (0.0%) |
| Computers, Engineering & Science | 0 (0.0%) | 0 (0.0%) |
| Computers & Mathematics | 0 (0.0%) | 0 (0.0%) |
| Architecture & Engineering | 0 (0.0%) | 0 (0.0%) |
| Life, Physical & Social Science | 0 (0.0%) | 0 (0.0%) |
| Community & Social Service | 1 (100.0%) | 0 (0.0%) |
| Education, Arts & Media | 1 (100.0%) | 0 (0.0%) |
| Legal Services & Support | 0 (0.0%) | 0 (0.0%) |
| Education Instruction & Library | 0 (0.0%) | 0 (0.0%) |
| Arts, Media & Entertainment | 0 (0.0%) | 0 (0.0%) |
| Health Diagnosing & Treating | 25 (47.2%) | 28 (52.8%) |
| Health Technologists | 25 (50.0%) | 25 (50.0%) |
| Total (Category) | 41 (59.4%) | 28 (40.6%) |
| Total (Overall) | 101 (62.7%) | 60 (37.3%) |
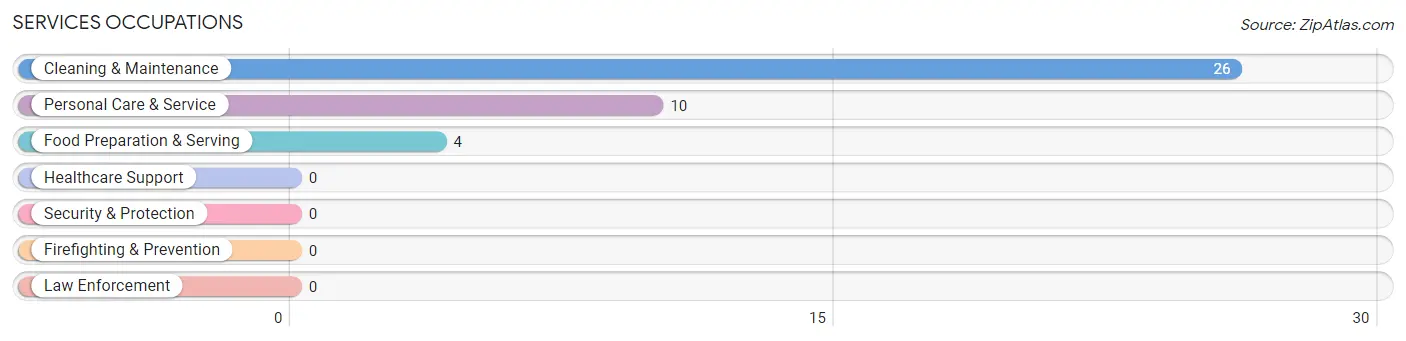
Services Occupations
The most common Services occupations in Walloon Lake are Cleaning & Maintenance (26 | 16.2%), Personal Care & Service (10 | 6.2%), and Food Preparation & Serving (4 | 2.5%).
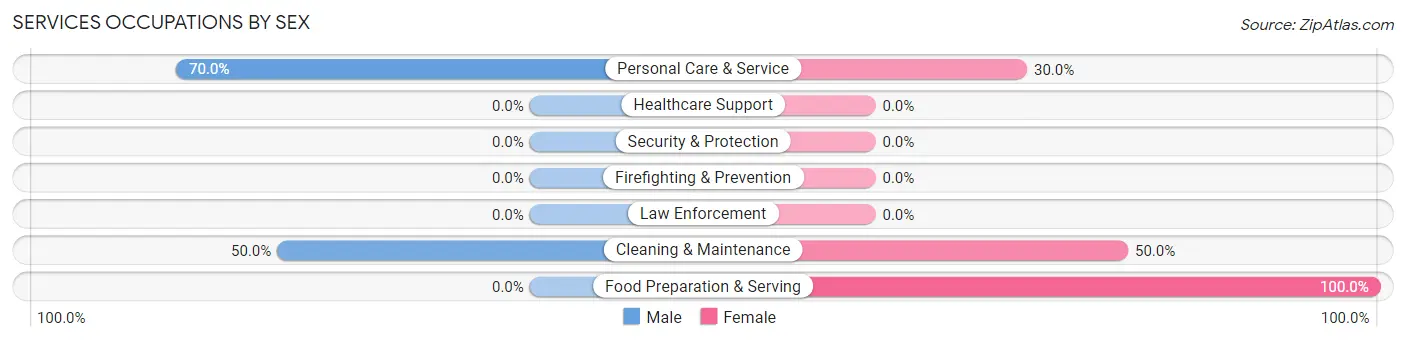
Services Occupations by Sex
Within the Services occupations in Walloon Lake, the most male-oriented occupations are Personal Care & Service (70.0%), and Cleaning & Maintenance (50.0%), while the most female-oriented occupations are Food Preparation & Serving (100.0%), Cleaning & Maintenance (50.0%), and Personal Care & Service (30.0%).
| Occupation | Male | Female |
| Healthcare Support | 0 (0.0%) | 0 (0.0%) |
| Security & Protection | 0 (0.0%) | 0 (0.0%) |
| Firefighting & Prevention | 0 (0.0%) | 0 (0.0%) |
| Law Enforcement | 0 (0.0%) | 0 (0.0%) |
| Food Preparation & Serving | 0 (0.0%) | 4 (100.0%) |
| Cleaning & Maintenance | 13 (50.0%) | 13 (50.0%) |
| Personal Care & Service | 7 (70.0%) | 3 (30.0%) |
| Total (Category) | 20 (50.0%) | 20 (50.0%) |
| Total (Overall) | 101 (62.7%) | 60 (37.3%) |
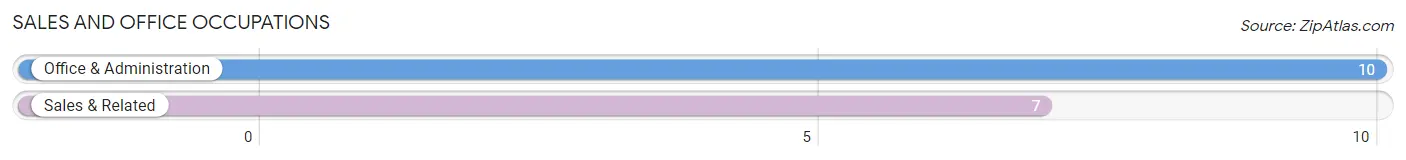
Sales and Office Occupations
The most common Sales and Office occupations in Walloon Lake are Office & Administration (10 | 6.2%), and Sales & Related (7 | 4.3%).
Sales and Office Occupations by Sex
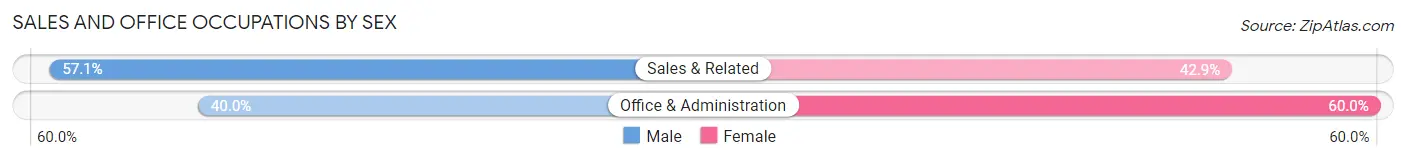
| Occupation | Male | Female |
| Sales & Related | 4 (57.1%) | 3 (42.9%) |
| Office & Administration | 4 (40.0%) | 6 (60.0%) |
| Total (Category) | 8 (47.1%) | 9 (52.9%) |
| Total (Overall) | 101 (62.7%) | 60 (37.3%) |
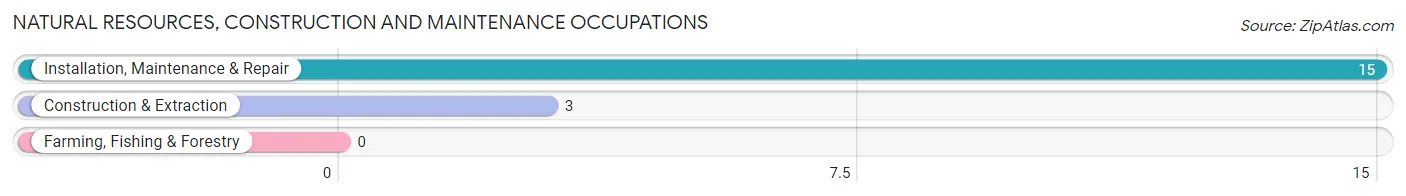
Natural Resources, Construction and Maintenance Occupations
The most common Natural Resources, Construction and Maintenance occupations in Walloon Lake are Installation, Maintenance & Repair (15 | 9.3%), and Construction & Extraction (3 | 1.9%).
Natural Resources, Construction and Maintenance Occupations by Sex
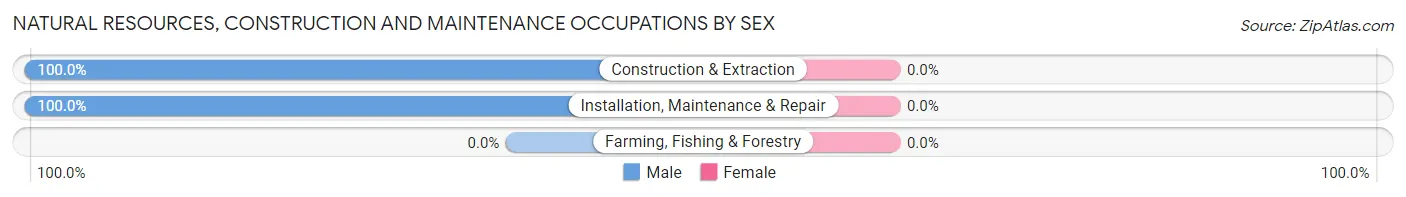
| Occupation | Male | Female |
| Farming, Fishing & Forestry | 0 (0.0%) | 0 (0.0%) |
| Construction & Extraction | 3 (100.0%) | 0 (0.0%) |
| Installation, Maintenance & Repair | 15 (100.0%) | 0 (0.0%) |
| Total (Category) | 18 (100.0%) | 0 (0.0%) |
| Total (Overall) | 101 (62.7%) | 60 (37.3%) |
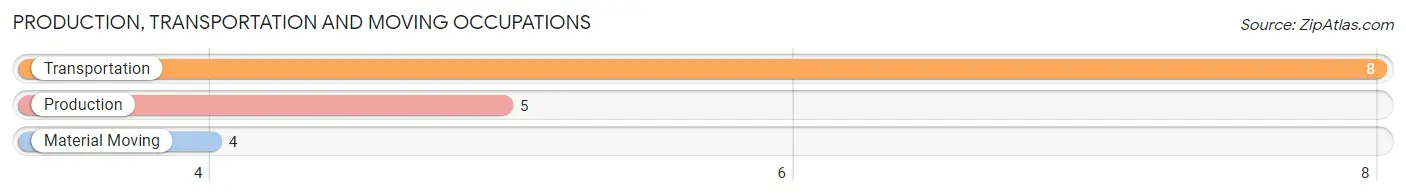
Production, Transportation and Moving Occupations
The most common Production, Transportation and Moving occupations in Walloon Lake are Transportation (8 | 5.0%), Production (5 | 3.1%), and Material Moving (4 | 2.5%).
Production, Transportation and Moving Occupations by Sex
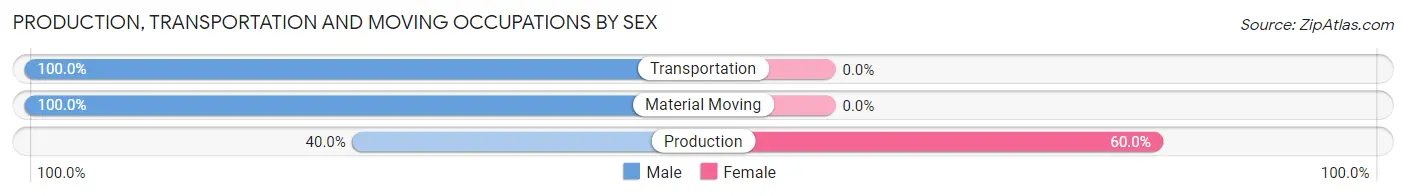
| Occupation | Male | Female |
| Production | 2 (40.0%) | 3 (60.0%) |
| Transportation | 8 (100.0%) | 0 (0.0%) |
| Material Moving | 4 (100.0%) | 0 (0.0%) |
| Total (Category) | 14 (82.4%) | 3 (17.6%) |
| Total (Overall) | 101 (62.7%) | 60 (37.3%) |
Employment Industries by Sex in Walloon Lake
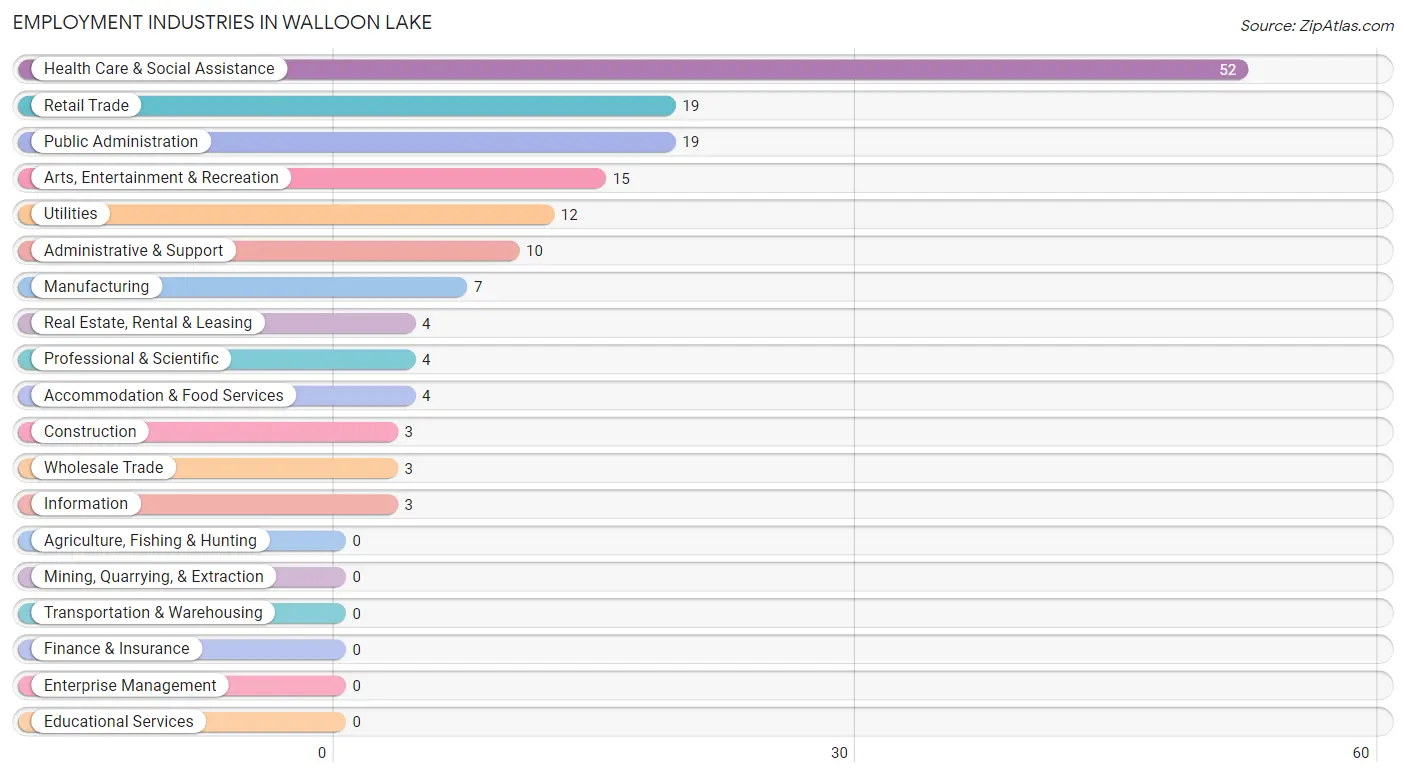
Employment Industries in Walloon Lake
The major employment industries in Walloon Lake include Health Care & Social Assistance (52 | 32.3%), Retail Trade (19 | 11.8%), Public Administration (19 | 11.8%), Arts, Entertainment & Recreation (15 | 9.3%), and Utilities (12 | 7.4%).
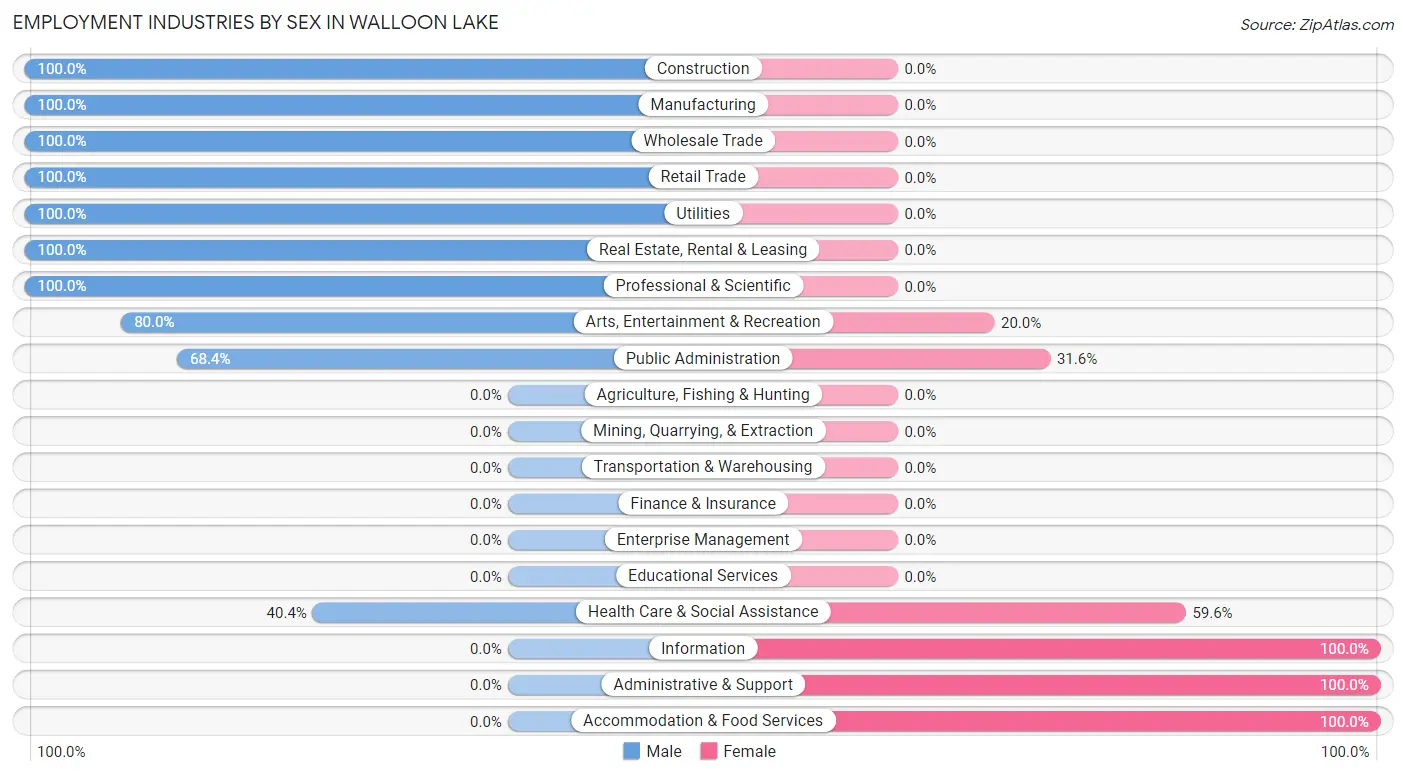
Employment Industries by Sex in Walloon Lake
The Walloon Lake industries that see more men than women are Construction (100.0%), Manufacturing (100.0%), and Wholesale Trade (100.0%), whereas the industries that tend to have a higher number of women are Information (100.0%), Administrative & Support (100.0%), and Accommodation & Food Services (100.0%).
| Industry | Male | Female |
| Agriculture, Fishing & Hunting | 0 (0.0%) | 0 (0.0%) |
| Mining, Quarrying, & Extraction | 0 (0.0%) | 0 (0.0%) |
| Construction | 3 (100.0%) | 0 (0.0%) |
| Manufacturing | 7 (100.0%) | 0 (0.0%) |
| Wholesale Trade | 3 (100.0%) | 0 (0.0%) |
| Retail Trade | 19 (100.0%) | 0 (0.0%) |
| Transportation & Warehousing | 0 (0.0%) | 0 (0.0%) |
| Utilities | 12 (100.0%) | 0 (0.0%) |
| Information | 0 (0.0%) | 3 (100.0%) |
| Finance & Insurance | 0 (0.0%) | 0 (0.0%) |
| Real Estate, Rental & Leasing | 4 (100.0%) | 0 (0.0%) |
| Professional & Scientific | 4 (100.0%) | 0 (0.0%) |
| Enterprise Management | 0 (0.0%) | 0 (0.0%) |
| Administrative & Support | 0 (0.0%) | 10 (100.0%) |
| Educational Services | 0 (0.0%) | 0 (0.0%) |
| Health Care & Social Assistance | 21 (40.4%) | 31 (59.6%) |
| Arts, Entertainment & Recreation | 12 (80.0%) | 3 (20.0%) |
| Accommodation & Food Services | 0 (0.0%) | 4 (100.0%) |
| Public Administration | 13 (68.4%) | 6 (31.6%) |
| Total | 101 (62.7%) | 60 (37.3%) |
Education in Walloon Lake
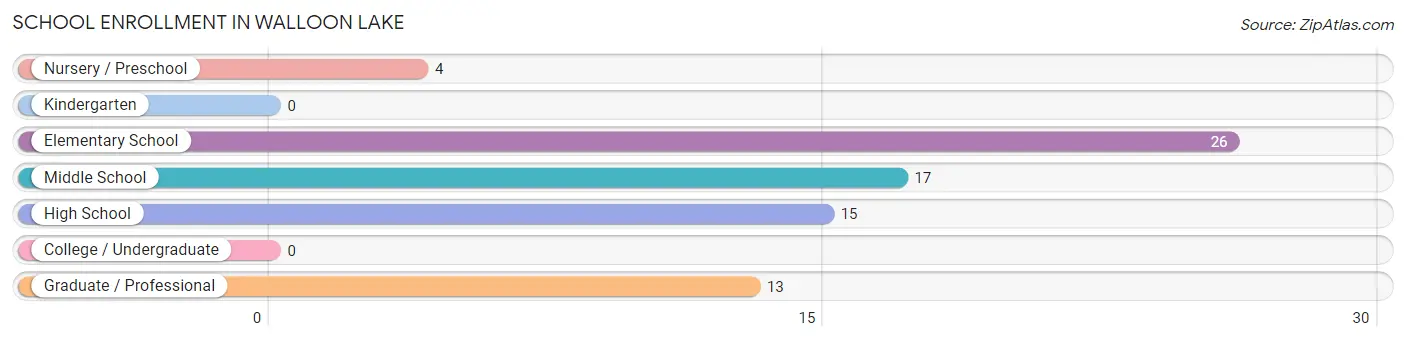
School Enrollment in Walloon Lake
The most common levels of schooling among the 75 students in Walloon Lake are elementary school (26 | 34.7%), middle school (17 | 22.7%), and high school (15 | 20.0%).
| School Level | # Students | % Students |
| Nursery / Preschool | 4 | 5.3% |
| Kindergarten | 0 | 0.0% |
| Elementary School | 26 | 34.7% |
| Middle School | 17 | 22.7% |
| High School | 15 | 20.0% |
| College / Undergraduate | 0 | 0.0% |
| Graduate / Professional | 13 | 17.3% |
| Total | 75 | 100.0% |
School Enrollment by Age by Funding Source in Walloon Lake
Out of a total of 75 students who are enrolled in schools in Walloon Lake, 6 (8.0%) attend a private institution, while the remaining 69 (92.0%) are enrolled in public schools. The age group of 5 to 9 year old has the highest likelihood of being enrolled in private schools, with 6 (31.6% in the age bracket) enrolled. Conversely, the age group of 3 to 4 year olds has the lowest likelihood of being enrolled in a private school, with 2 (100.0% in the age bracket) attending a public institution.
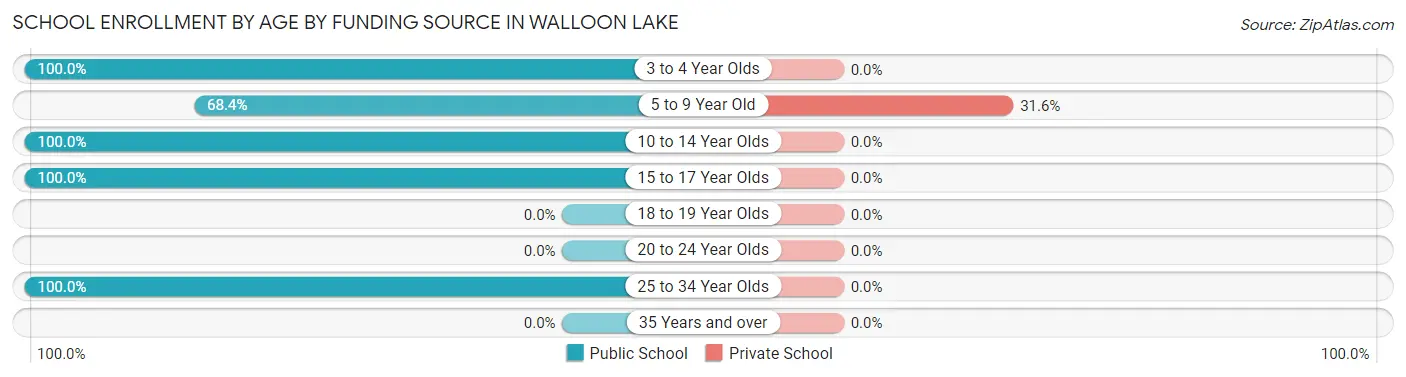
| Age Bracket | Public School | Private School |
| 3 to 4 Year Olds | 2 (100.0%) | 0 (0.0%) |
| 5 to 9 Year Old | 13 (68.4%) | 6 (31.6%) |
| 10 to 14 Year Olds | 26 (100.0%) | 0 (0.0%) |
| 15 to 17 Year Olds | 15 (100.0%) | 0 (0.0%) |
| 18 to 19 Year Olds | 0 (0.0%) | 0 (0.0%) |
| 20 to 24 Year Olds | 0 (0.0%) | 0 (0.0%) |
| 25 to 34 Year Olds | 13 (100.0%) | 0 (0.0%) |
| 35 Years and over | 0 (0.0%) | 0 (0.0%) |
| Total | 69 (92.0%) | 6 (8.0%) |
Educational Attainment by Field of Study in Walloon Lake
Science & technology (40 | 30.8%), business (21 | 16.2%), bio, nature & agricultural (16 | 12.3%), psychology (14 | 10.8%), and visual & performing arts (11 | 8.5%) are the most common fields of study among 130 individuals in Walloon Lake who have obtained a bachelor's degree or higher.
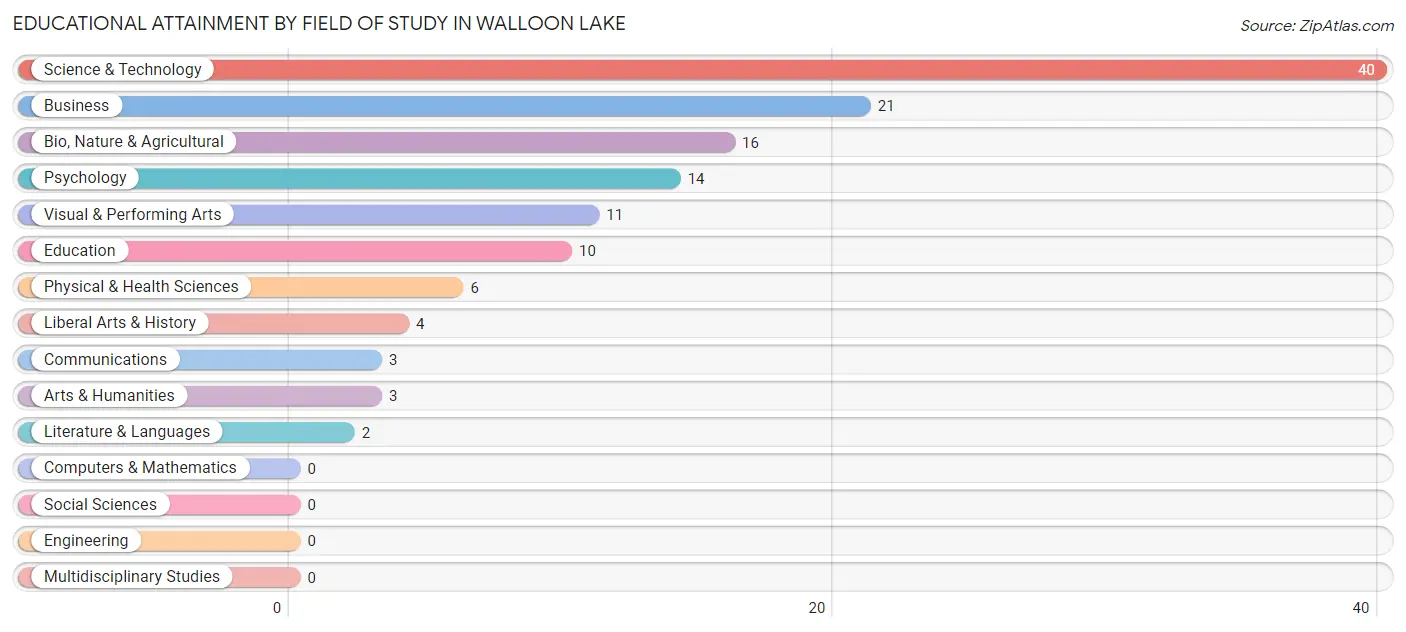
| Field of Study | # Graduates | % Graduates |
| Computers & Mathematics | 0 | 0.0% |
| Bio, Nature & Agricultural | 16 | 12.3% |
| Physical & Health Sciences | 6 | 4.6% |
| Psychology | 14 | 10.8% |
| Social Sciences | 0 | 0.0% |
| Engineering | 0 | 0.0% |
| Multidisciplinary Studies | 0 | 0.0% |
| Science & Technology | 40 | 30.8% |
| Business | 21 | 16.2% |
| Education | 10 | 7.7% |
| Literature & Languages | 2 | 1.5% |
| Liberal Arts & History | 4 | 3.1% |
| Visual & Performing Arts | 11 | 8.5% |
| Communications | 3 | 2.3% |
| Arts & Humanities | 3 | 2.3% |
| Total | 130 | 100.0% |
Transportation & Commute in Walloon Lake
Vehicle Availability by Sex in Walloon Lake
The most prevalent vehicle ownership categories in Walloon Lake are males with 2 vehicles (52, accounting for 51.5%) and females with 2 vehicles (39, making up 86.7%).
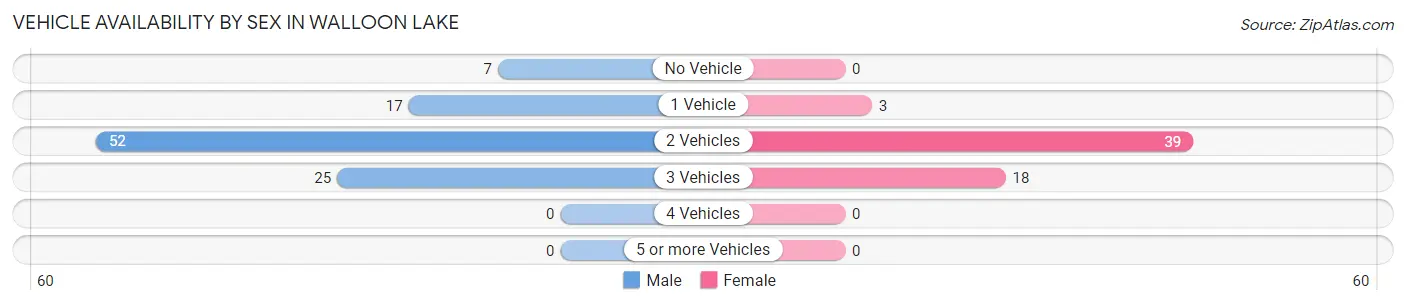
| Vehicles Available | Male | Female |
| No Vehicle | 7 (6.9%) | 0 (0.0%) |
| 1 Vehicle | 17 (16.8%) | 3 (5.0%) |
| 2 Vehicles | 52 (51.5%) | 39 (65.0%) |
| 3 Vehicles | 25 (24.7%) | 18 (30.0%) |
| 4 Vehicles | 0 (0.0%) | 0 (0.0%) |
| 5 or more Vehicles | 0 (0.0%) | 0 (0.0%) |
| Total | 101 (100.0%) | 60 (100.0%) |
Commute Time in Walloon Lake
The most frequently occuring commute durations in Walloon Lake are 15 to 19 minutes (61 commuters, 38.9%), 10 to 14 minutes (45 commuters, 28.7%), and 20 to 24 minutes (33 commuters, 21.0%).
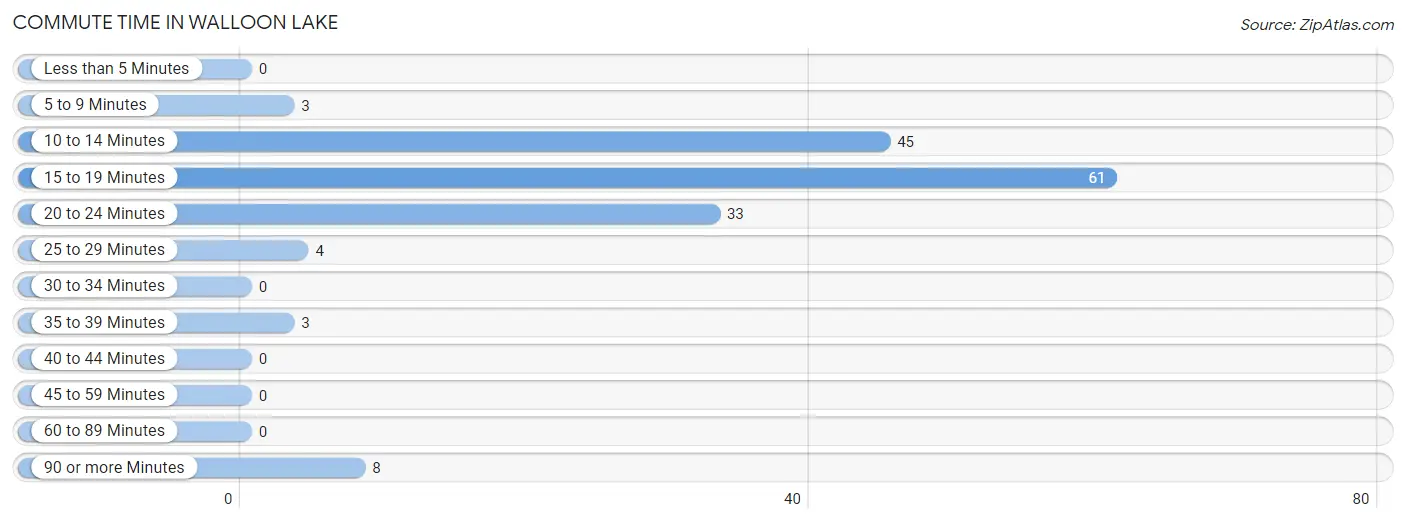
| Commute Time | # Commuters | % Commuters |
| Less than 5 Minutes | 0 | 0.0% |
| 5 to 9 Minutes | 3 | 1.9% |
| 10 to 14 Minutes | 45 | 28.7% |
| 15 to 19 Minutes | 61 | 38.9% |
| 20 to 24 Minutes | 33 | 21.0% |
| 25 to 29 Minutes | 4 | 2.5% |
| 30 to 34 Minutes | 0 | 0.0% |
| 35 to 39 Minutes | 3 | 1.9% |
| 40 to 44 Minutes | 0 | 0.0% |
| 45 to 59 Minutes | 0 | 0.0% |
| 60 to 89 Minutes | 0 | 0.0% |
| 90 or more Minutes | 8 | 5.1% |
Commute Time by Sex in Walloon Lake
The most common commute times in Walloon Lake are 10 to 14 minutes (31 commuters, 32.0%) for males and 15 to 19 minutes (30 commuters, 50.0%) for females.
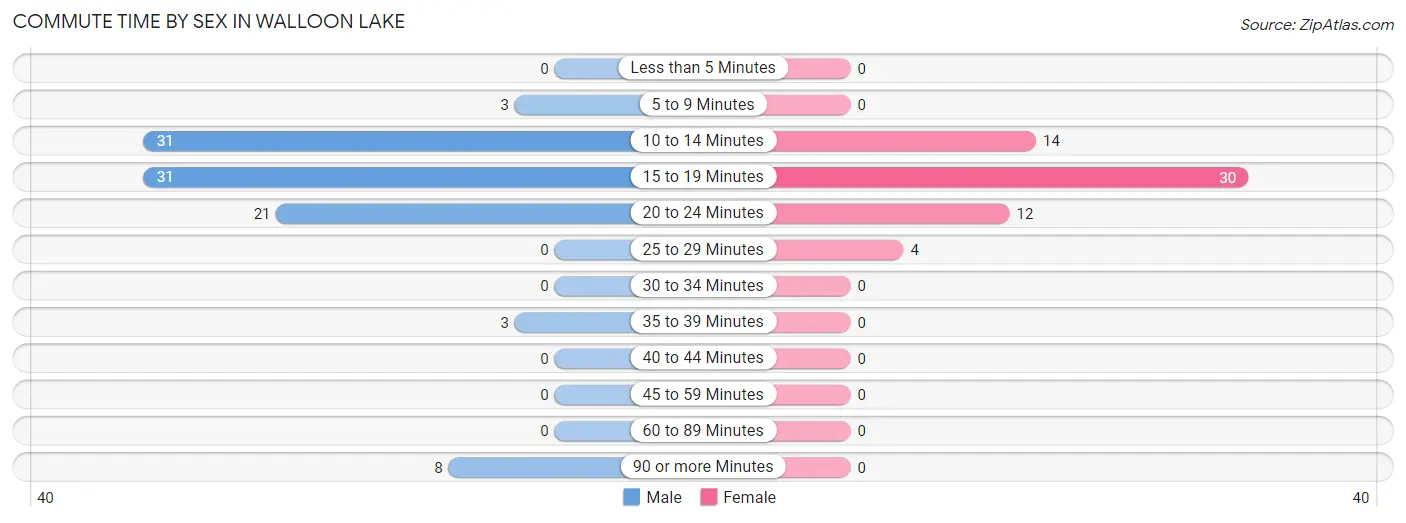
| Commute Time | Male | Female |
| Less than 5 Minutes | 0 (0.0%) | 0 (0.0%) |
| 5 to 9 Minutes | 3 (3.1%) | 0 (0.0%) |
| 10 to 14 Minutes | 31 (32.0%) | 14 (23.3%) |
| 15 to 19 Minutes | 31 (32.0%) | 30 (50.0%) |
| 20 to 24 Minutes | 21 (21.6%) | 12 (20.0%) |
| 25 to 29 Minutes | 0 (0.0%) | 4 (6.7%) |
| 30 to 34 Minutes | 0 (0.0%) | 0 (0.0%) |
| 35 to 39 Minutes | 3 (3.1%) | 0 (0.0%) |
| 40 to 44 Minutes | 0 (0.0%) | 0 (0.0%) |
| 45 to 59 Minutes | 0 (0.0%) | 0 (0.0%) |
| 60 to 89 Minutes | 0 (0.0%) | 0 (0.0%) |
| 90 or more Minutes | 8 (8.3%) | 0 (0.0%) |
Time of Departure to Work by Sex in Walloon Lake
The most frequent times of departure to work in Walloon Lake are 7:30 AM to 7:59 AM (37, 38.1%) for males and 7:00 AM to 7:29 AM (16, 26.7%) for females.
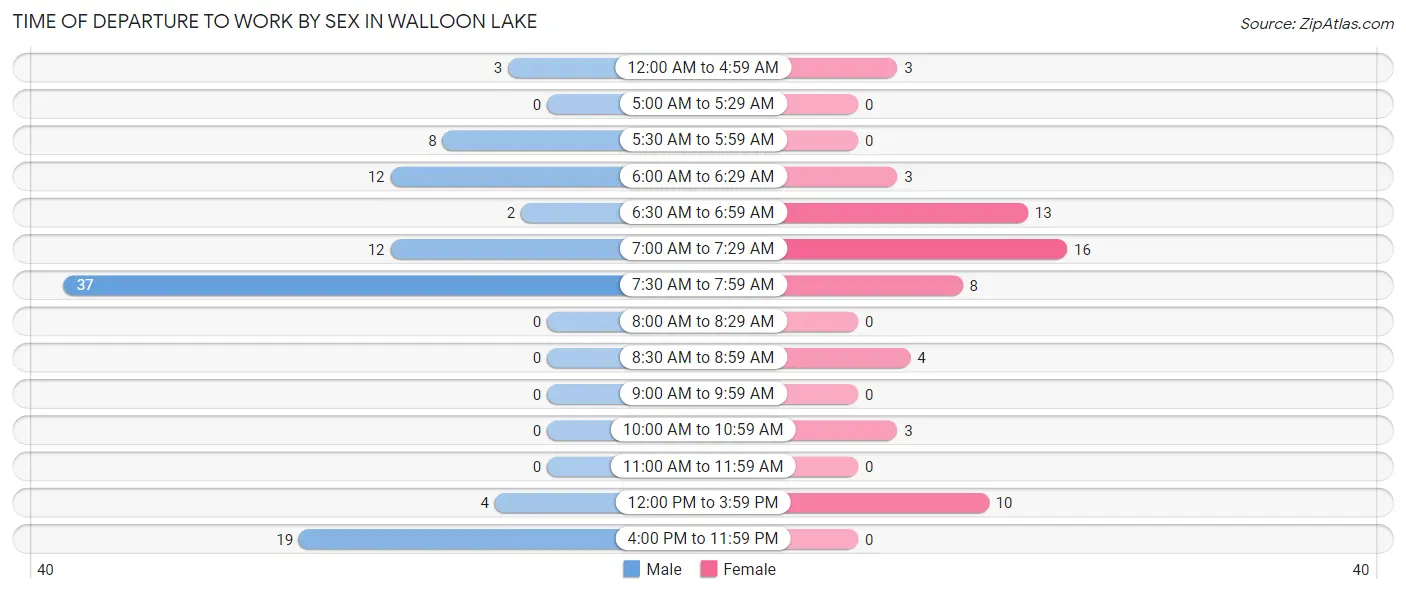
| Time of Departure | Male | Female |
| 12:00 AM to 4:59 AM | 3 (3.1%) | 3 (5.0%) |
| 5:00 AM to 5:29 AM | 0 (0.0%) | 0 (0.0%) |
| 5:30 AM to 5:59 AM | 8 (8.3%) | 0 (0.0%) |
| 6:00 AM to 6:29 AM | 12 (12.4%) | 3 (5.0%) |
| 6:30 AM to 6:59 AM | 2 (2.1%) | 13 (21.7%) |
| 7:00 AM to 7:29 AM | 12 (12.4%) | 16 (26.7%) |
| 7:30 AM to 7:59 AM | 37 (38.1%) | 8 (13.3%) |
| 8:00 AM to 8:29 AM | 0 (0.0%) | 0 (0.0%) |
| 8:30 AM to 8:59 AM | 0 (0.0%) | 4 (6.7%) |
| 9:00 AM to 9:59 AM | 0 (0.0%) | 0 (0.0%) |
| 10:00 AM to 10:59 AM | 0 (0.0%) | 3 (5.0%) |
| 11:00 AM to 11:59 AM | 0 (0.0%) | 0 (0.0%) |
| 12:00 PM to 3:59 PM | 4 (4.1%) | 10 (16.7%) |
| 4:00 PM to 11:59 PM | 19 (19.6%) | 0 (0.0%) |
| Total | 97 (100.0%) | 60 (100.0%) |
Housing Occupancy in Walloon Lake
Occupancy by Ownership in Walloon Lake
Of the total 143 dwellings in Walloon Lake, owner-occupied units account for 106 (74.1%), while renter-occupied units make up 37 (25.9%).
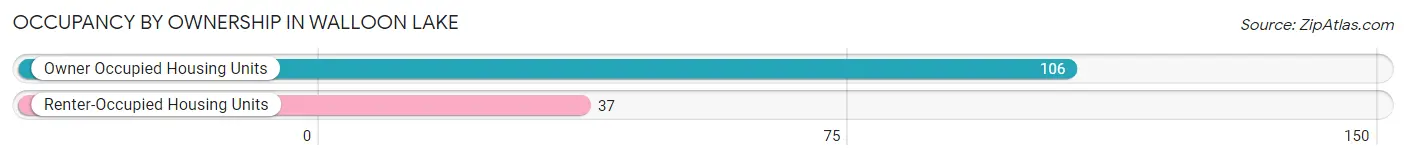
| Occupancy | # Housing Units | % Housing Units |
| Owner Occupied Housing Units | 106 | 74.1% |
| Renter-Occupied Housing Units | 37 | 25.9% |
| Total Occupied Housing Units | 143 | 100.0% |
Occupancy by Household Size in Walloon Lake
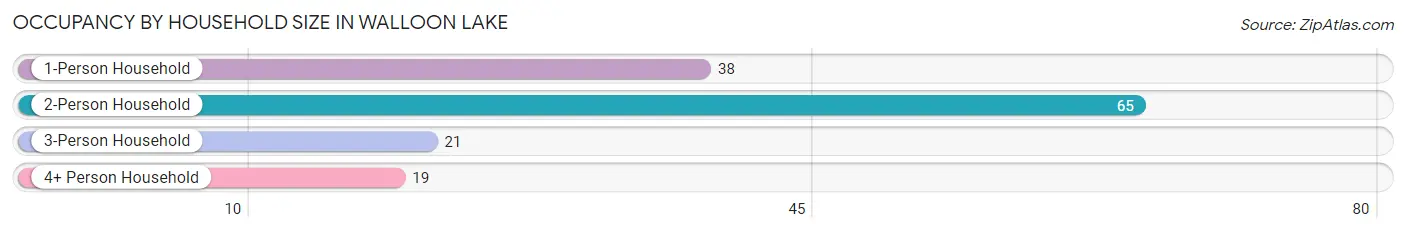
| Household Size | # Housing Units | % Housing Units |
| 1-Person Household | 38 | 26.6% |
| 2-Person Household | 65 | 45.5% |
| 3-Person Household | 21 | 14.7% |
| 4+ Person Household | 19 | 13.3% |
| Total Housing Units | 143 | 100.0% |
Occupancy by Ownership by Household Size in Walloon Lake
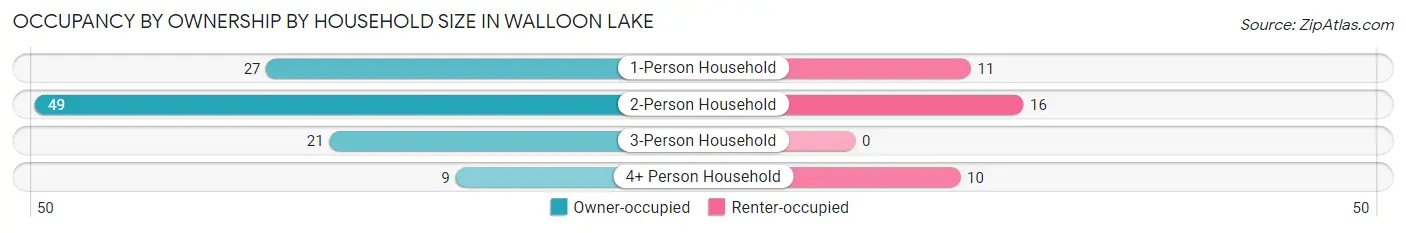
| Household Size | Owner-occupied | Renter-occupied |
| 1-Person Household | 27 (71.1%) | 11 (28.9%) |
| 2-Person Household | 49 (75.4%) | 16 (24.6%) |
| 3-Person Household | 21 (100.0%) | 0 (0.0%) |
| 4+ Person Household | 9 (47.4%) | 10 (52.6%) |
| Total Housing Units | 106 (74.1%) | 37 (25.9%) |
Occupancy by Educational Attainment in Walloon Lake
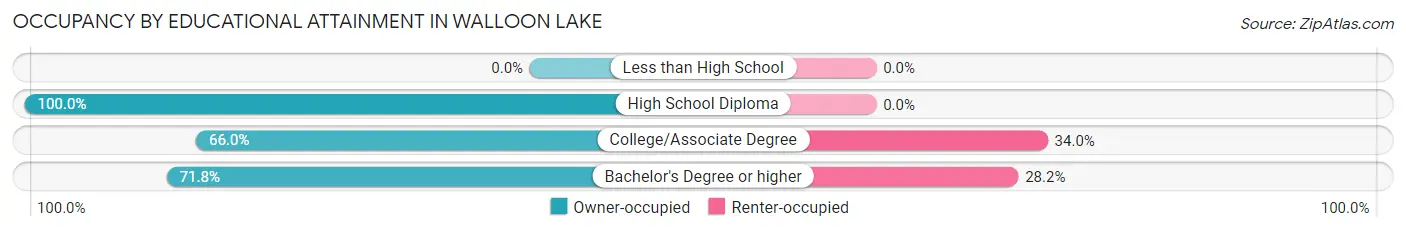
| Household Size | Owner-occupied | Renter-occupied |
| Less than High School | 0 (0.0%) | 0 (0.0%) |
| High School Diploma | 22 (100.0%) | 0 (0.0%) |
| College/Associate Degree | 33 (66.0%) | 17 (34.0%) |
| Bachelor's Degree or higher | 51 (71.8%) | 20 (28.2%) |
Occupancy by Age of Householder in Walloon Lake
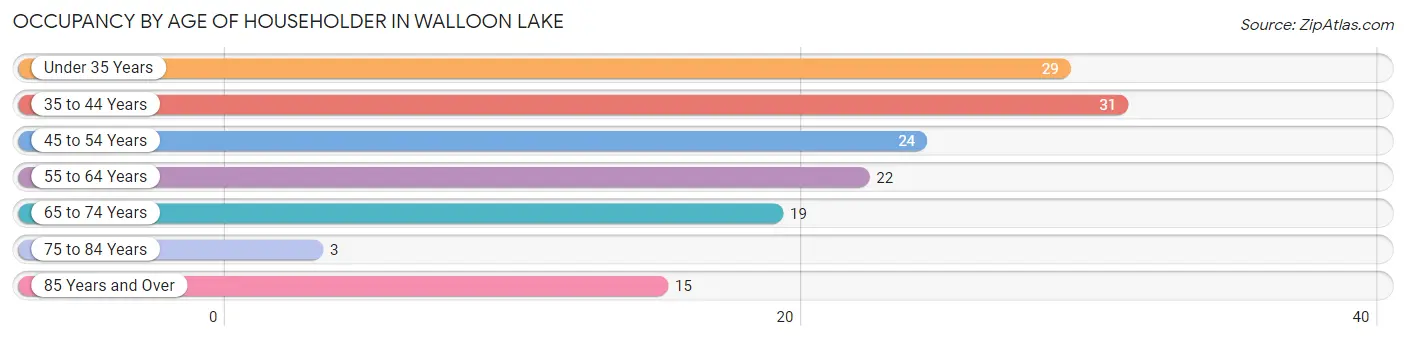
| Age Bracket | # Households | % Households |
| Under 35 Years | 29 | 20.3% |
| 35 to 44 Years | 31 | 21.7% |
| 45 to 54 Years | 24 | 16.8% |
| 55 to 64 Years | 22 | 15.4% |
| 65 to 74 Years | 19 | 13.3% |
| 75 to 84 Years | 3 | 2.1% |
| 85 Years and Over | 15 | 10.5% |
| Total | 143 | 100.0% |
Housing Finances in Walloon Lake
Median Income by Occupancy in Walloon Lake
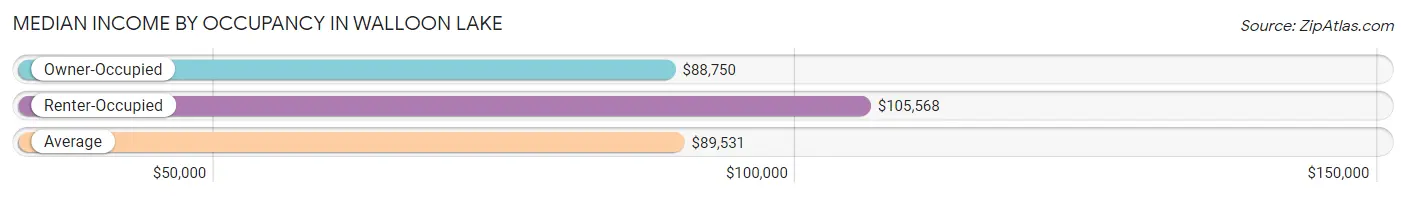
| Occupancy Type | # Households | Median Income |
| Owner-Occupied | 106 (74.1%) | $88,750 |
| Renter-Occupied | 37 (25.9%) | $105,568 |
| Average | 143 (100.0%) | $89,531 |
Occupancy by Householder Income Bracket in Walloon Lake
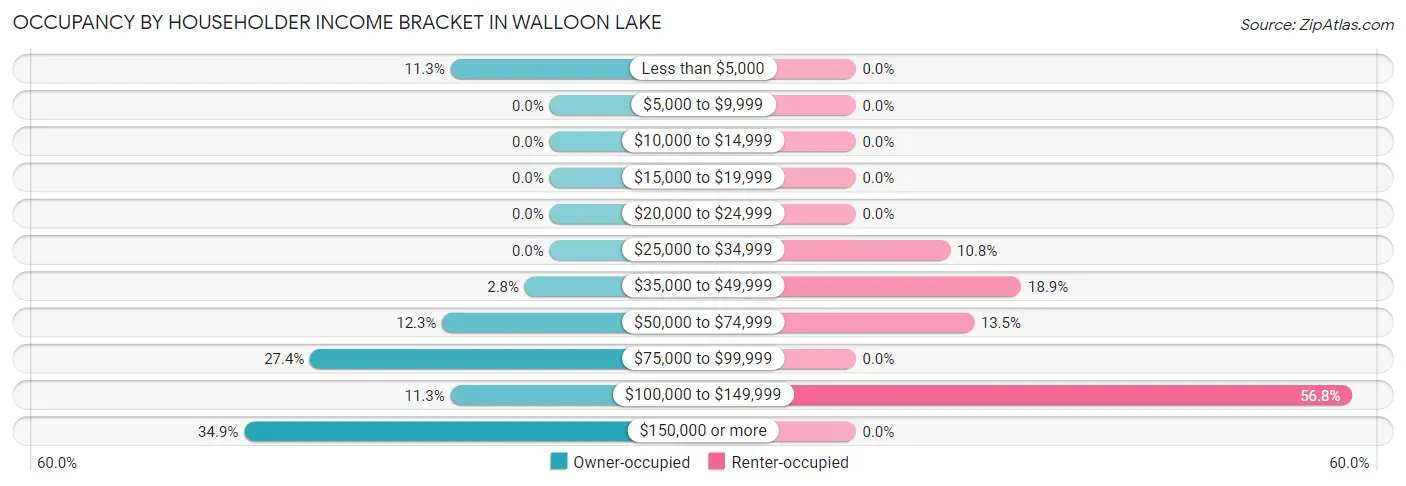
| Income Bracket | Owner-occupied | Renter-occupied |
| Less than $5,000 | 12 (11.3%) | 0 (0.0%) |
| $5,000 to $9,999 | 0 (0.0%) | 0 (0.0%) |
| $10,000 to $14,999 | 0 (0.0%) | 0 (0.0%) |
| $15,000 to $19,999 | 0 (0.0%) | 0 (0.0%) |
| $20,000 to $24,999 | 0 (0.0%) | 0 (0.0%) |
| $25,000 to $34,999 | 0 (0.0%) | 4 (10.8%) |
| $35,000 to $49,999 | 3 (2.8%) | 7 (18.9%) |
| $50,000 to $74,999 | 13 (12.3%) | 5 (13.5%) |
| $75,000 to $99,999 | 29 (27.4%) | 0 (0.0%) |
| $100,000 to $149,999 | 12 (11.3%) | 21 (56.8%) |
| $150,000 or more | 37 (34.9%) | 0 (0.0%) |
| Total | 106 (100.0%) | 37 (100.0%) |
Monthly Housing Cost Tiers in Walloon Lake
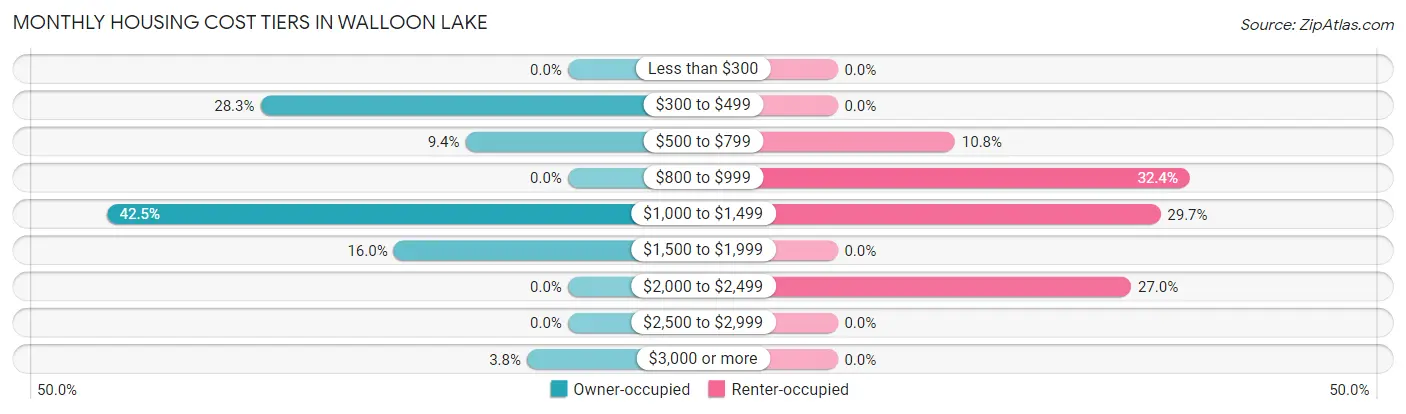
| Monthly Cost | Owner-occupied | Renter-occupied |
| Less than $300 | 0 (0.0%) | 0 (0.0%) |
| $300 to $499 | 30 (28.3%) | 0 (0.0%) |
| $500 to $799 | 10 (9.4%) | 4 (10.8%) |
| $800 to $999 | 0 (0.0%) | 12 (32.4%) |
| $1,000 to $1,499 | 45 (42.4%) | 11 (29.7%) |
| $1,500 to $1,999 | 17 (16.0%) | 0 (0.0%) |
| $2,000 to $2,499 | 0 (0.0%) | 10 (27.0%) |
| $2,500 to $2,999 | 0 (0.0%) | 0 (0.0%) |
| $3,000 or more | 4 (3.8%) | 0 (0.0%) |
| Total | 106 (100.0%) | 37 (100.0%) |
Physical Housing Characteristics in Walloon Lake
Housing Structures in Walloon Lake
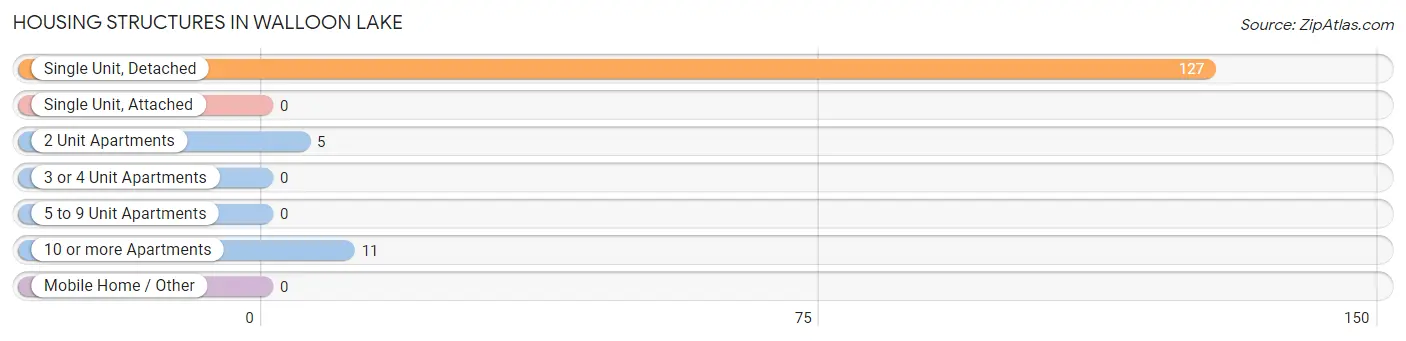
| Structure Type | # Housing Units | % Housing Units |
| Single Unit, Detached | 127 | 88.8% |
| Single Unit, Attached | 0 | 0.0% |
| 2 Unit Apartments | 5 | 3.5% |
| 3 or 4 Unit Apartments | 0 | 0.0% |
| 5 to 9 Unit Apartments | 0 | 0.0% |
| 10 or more Apartments | 11 | 7.7% |
| Mobile Home / Other | 0 | 0.0% |
| Total | 143 | 100.0% |
Housing Structures by Occupancy in Walloon Lake
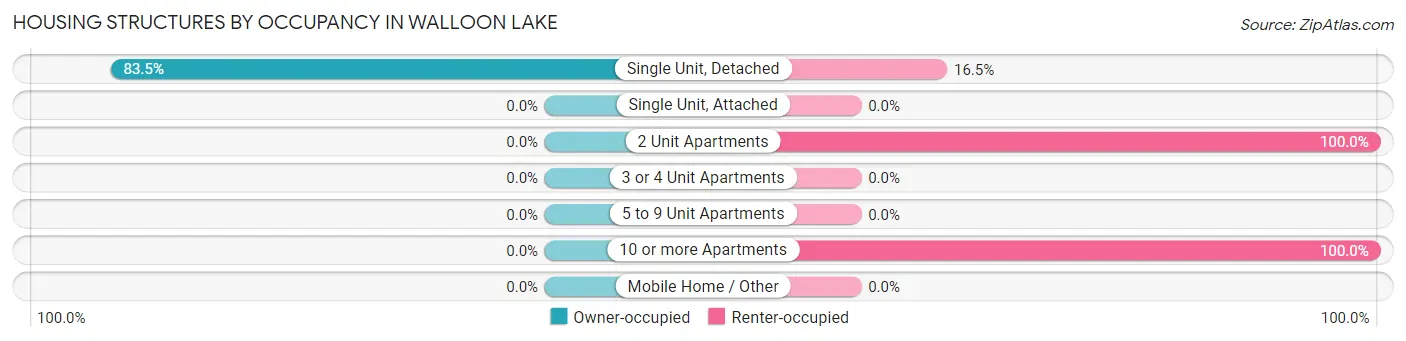
| Structure Type | Owner-occupied | Renter-occupied |
| Single Unit, Detached | 106 (83.5%) | 21 (16.5%) |
| Single Unit, Attached | 0 (0.0%) | 0 (0.0%) |
| 2 Unit Apartments | 0 (0.0%) | 5 (100.0%) |
| 3 or 4 Unit Apartments | 0 (0.0%) | 0 (0.0%) |
| 5 to 9 Unit Apartments | 0 (0.0%) | 0 (0.0%) |
| 10 or more Apartments | 0 (0.0%) | 11 (100.0%) |
| Mobile Home / Other | 0 (0.0%) | 0 (0.0%) |
| Total | 106 (74.1%) | 37 (25.9%) |
Housing Structures by Number of Rooms in Walloon Lake
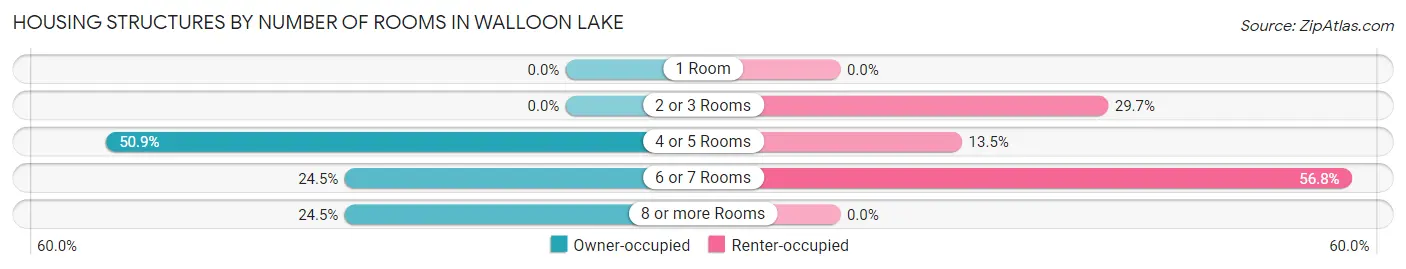
| Number of Rooms | Owner-occupied | Renter-occupied |
| 1 Room | 0 (0.0%) | 0 (0.0%) |
| 2 or 3 Rooms | 0 (0.0%) | 11 (29.7%) |
| 4 or 5 Rooms | 54 (50.9%) | 5 (13.5%) |
| 6 or 7 Rooms | 26 (24.5%) | 21 (56.8%) |
| 8 or more Rooms | 26 (24.5%) | 0 (0.0%) |
| Total | 106 (100.0%) | 37 (100.0%) |
Housing Structure by Heating Type in Walloon Lake
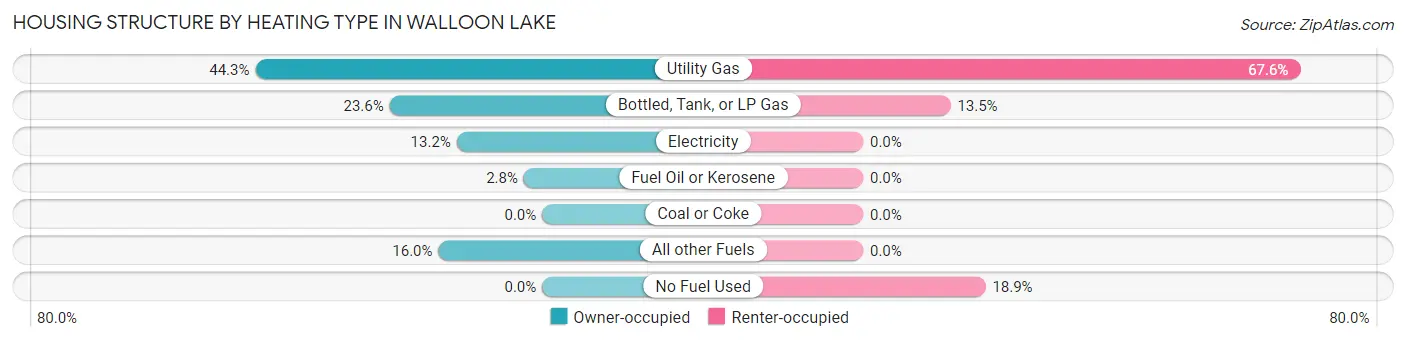
| Heating Type | Owner-occupied | Renter-occupied |
| Utility Gas | 47 (44.3%) | 25 (67.6%) |
| Bottled, Tank, or LP Gas | 25 (23.6%) | 5 (13.5%) |
| Electricity | 14 (13.2%) | 0 (0.0%) |
| Fuel Oil or Kerosene | 3 (2.8%) | 0 (0.0%) |
| Coal or Coke | 0 (0.0%) | 0 (0.0%) |
| All other Fuels | 17 (16.0%) | 0 (0.0%) |
| No Fuel Used | 0 (0.0%) | 7 (18.9%) |
| Total | 106 (100.0%) | 37 (100.0%) |
Household Vehicle Usage in Walloon Lake
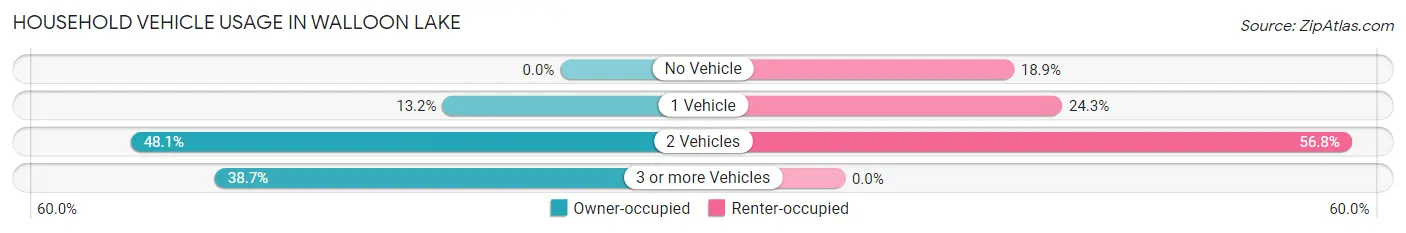
| Vehicles per Household | Owner-occupied | Renter-occupied |
| No Vehicle | 0 (0.0%) | 7 (18.9%) |
| 1 Vehicle | 14 (13.2%) | 9 (24.3%) |
| 2 Vehicles | 51 (48.1%) | 21 (56.8%) |
| 3 or more Vehicles | 41 (38.7%) | 0 (0.0%) |
| Total | 106 (100.0%) | 37 (100.0%) |
Real Estate & Mortgages in Walloon Lake
Real Estate and Mortgage Overview in Walloon Lake
| Characteristic | Without Mortgage | With Mortgage |
| Housing Units | 44 | 62 |
| Median Property Value | $200,000 | $254,200 |
| Median Household Income | $80,667 | $33 |
| Monthly Housing Costs | $387 | $0 |
| Real Estate Taxes | $2,000 | $0 |
Property Value by Mortgage Status in Walloon Lake
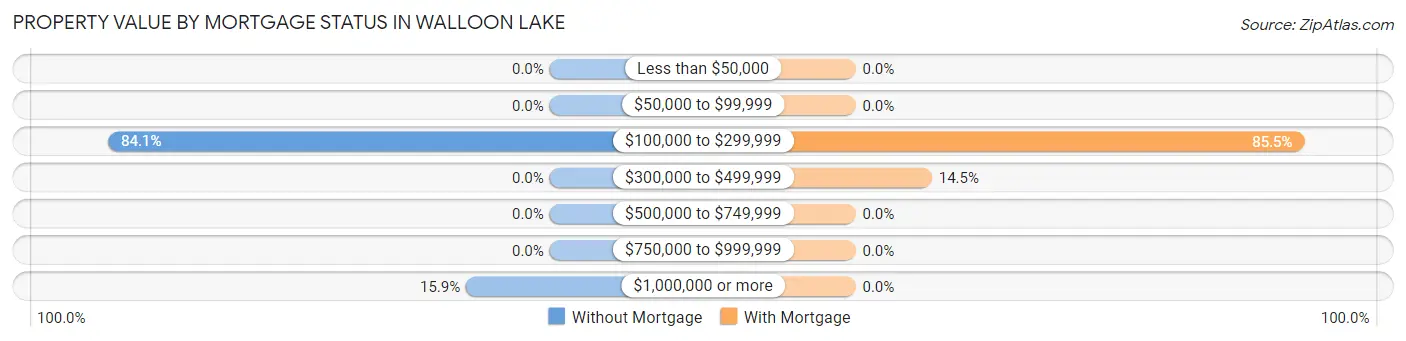
| Property Value | Without Mortgage | With Mortgage |
| Less than $50,000 | 0 (0.0%) | 0 (0.0%) |
| $50,000 to $99,999 | 0 (0.0%) | 0 (0.0%) |
| $100,000 to $299,999 | 37 (84.1%) | 53 (85.5%) |
| $300,000 to $499,999 | 0 (0.0%) | 9 (14.5%) |
| $500,000 to $749,999 | 0 (0.0%) | 0 (0.0%) |
| $750,000 to $999,999 | 0 (0.0%) | 0 (0.0%) |
| $1,000,000 or more | 7 (15.9%) | 0 (0.0%) |
| Total | 44 (100.0%) | 62 (100.0%) |
Household Income by Mortgage Status in Walloon Lake
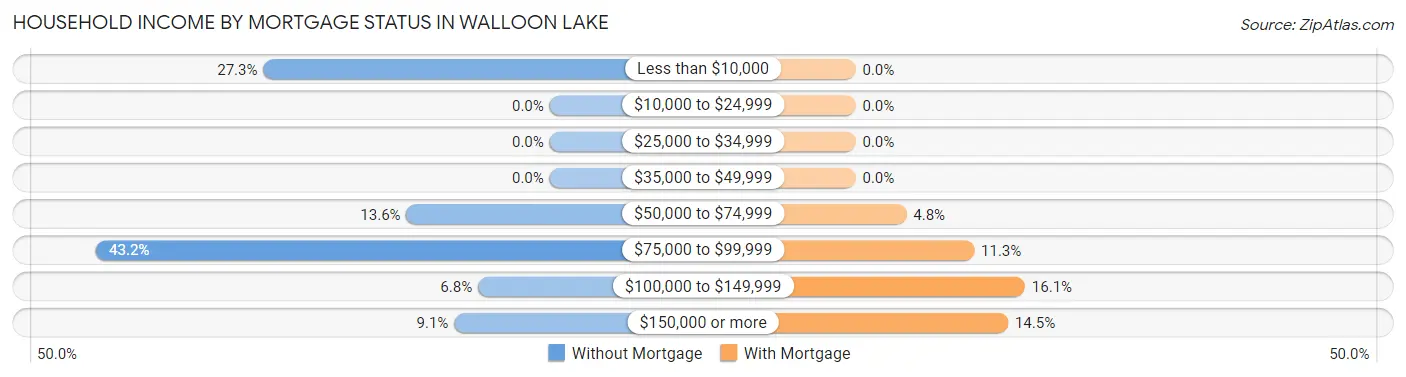
| Household Income | Without Mortgage | With Mortgage |
| Less than $10,000 | 12 (27.3%) | 0 (0.0%) |
| $10,000 to $24,999 | 0 (0.0%) | 0 (0.0%) |
| $25,000 to $34,999 | 0 (0.0%) | 0 (0.0%) |
| $35,000 to $49,999 | 0 (0.0%) | 0 (0.0%) |
| $50,000 to $74,999 | 6 (13.6%) | 3 (4.8%) |
| $75,000 to $99,999 | 19 (43.2%) | 7 (11.3%) |
| $100,000 to $149,999 | 3 (6.8%) | 10 (16.1%) |
| $150,000 or more | 4 (9.1%) | 9 (14.5%) |
| Total | 44 (100.0%) | 62 (100.0%) |
Property Value to Household Income Ratio in Walloon Lake
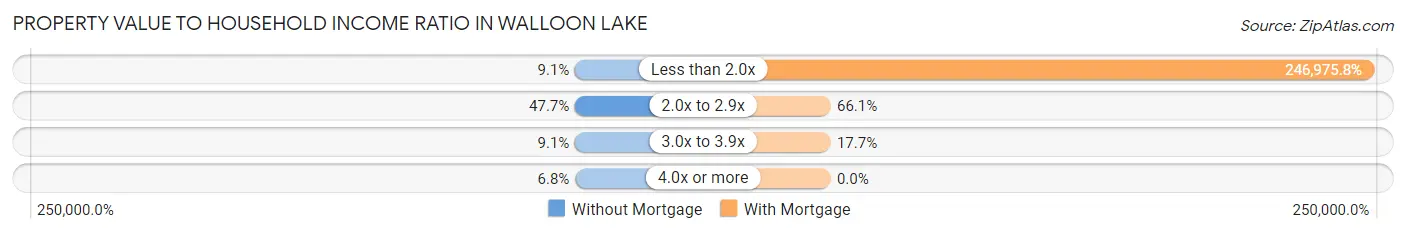
| Value-to-Income Ratio | Without Mortgage | With Mortgage |
| Less than 2.0x | 4 (9.1%) | 153,125 (246,975.8%) |
| 2.0x to 2.9x | 21 (47.7%) | 41 (66.1%) |
| 3.0x to 3.9x | 4 (9.1%) | 11 (17.7%) |
| 4.0x or more | 3 (6.8%) | 0 (0.0%) |
| Total | 44 (100.0%) | 62 (100.0%) |
Real Estate Taxes by Mortgage Status in Walloon Lake
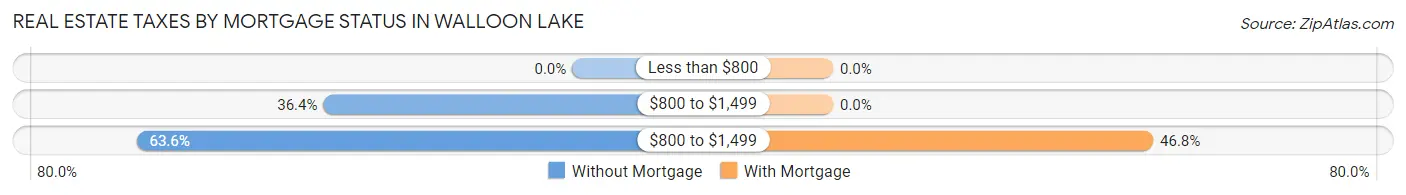
| Property Taxes | Without Mortgage | With Mortgage |
| Less than $800 | 0 (0.0%) | 0 (0.0%) |
| $800 to $1,499 | 16 (36.4%) | 0 (0.0%) |
| $800 to $1,499 | 28 (63.6%) | 29 (46.8%) |
| Total | 44 (100.0%) | 62 (100.0%) |
Health & Disability in Walloon Lake
Health Insurance Coverage by Age in Walloon Lake
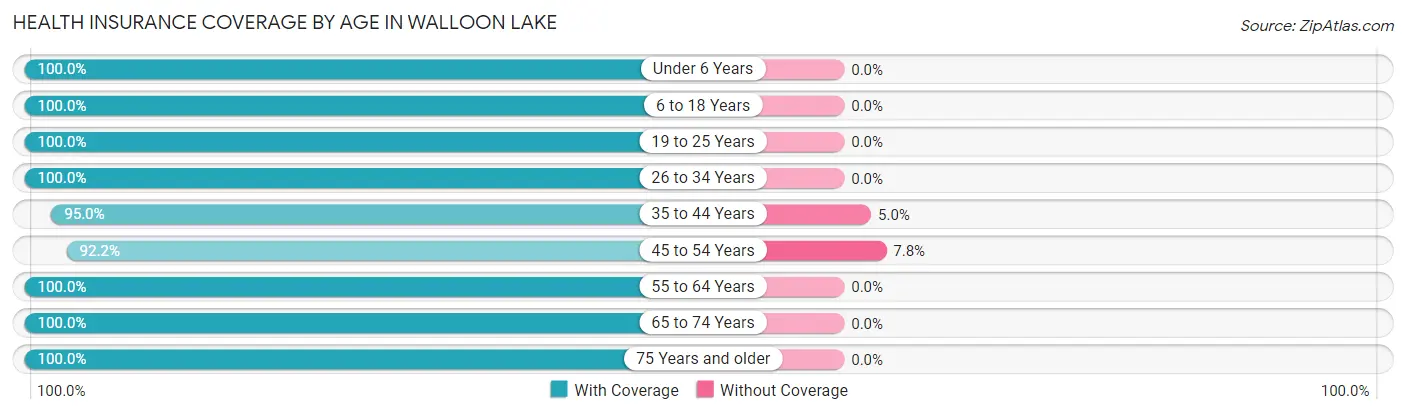
| Age Bracket | With Coverage | Without Coverage |
| Under 6 Years | 4 (100.0%) | 0 (0.0%) |
| 6 to 18 Years | 58 (100.0%) | 0 (0.0%) |
| 19 to 25 Years | 2 (100.0%) | 0 (0.0%) |
| 26 to 34 Years | 48 (100.0%) | 0 (0.0%) |
| 35 to 44 Years | 38 (95.0%) | 2 (5.0%) |
| 45 to 54 Years | 47 (92.2%) | 4 (7.8%) |
| 55 to 64 Years | 40 (100.0%) | 0 (0.0%) |
| 65 to 74 Years | 32 (100.0%) | 0 (0.0%) |
| 75 Years and older | 33 (100.0%) | 0 (0.0%) |
| Total | 302 (98.1%) | 6 (1.9%) |
Health Insurance Coverage by Citizenship Status in Walloon Lake
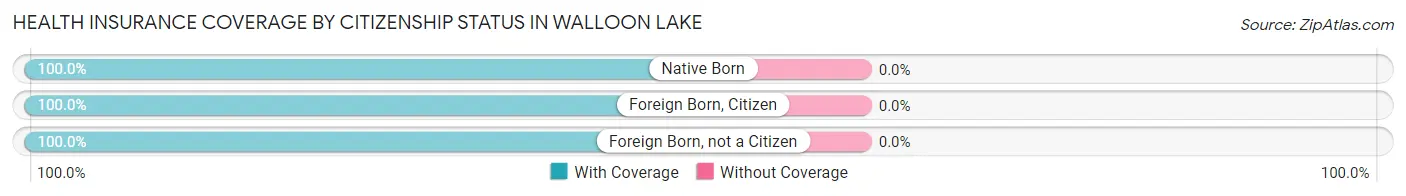
| Citizenship Status | With Coverage | Without Coverage |
| Native Born | 4 (100.0%) | 0 (0.0%) |
| Foreign Born, Citizen | 58 (100.0%) | 0 (0.0%) |
| Foreign Born, not a Citizen | 2 (100.0%) | 0 (0.0%) |
Health Insurance Coverage by Household Income in Walloon Lake
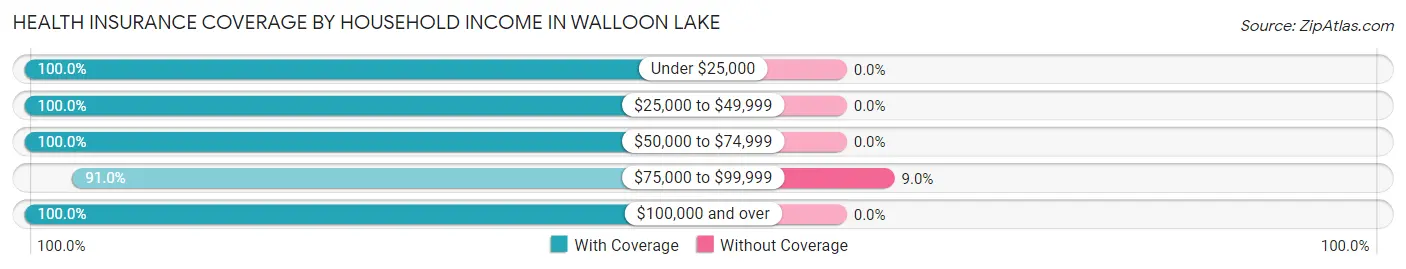
| Household Income | With Coverage | Without Coverage |
| Under $25,000 | 12 (100.0%) | 0 (0.0%) |
| $25,000 to $49,999 | 18 (100.0%) | 0 (0.0%) |
| $50,000 to $74,999 | 31 (100.0%) | 0 (0.0%) |
| $75,000 to $99,999 | 61 (91.0%) | 6 (9.0%) |
| $100,000 and over | 174 (100.0%) | 0 (0.0%) |
Public vs Private Health Insurance Coverage by Age in Walloon Lake
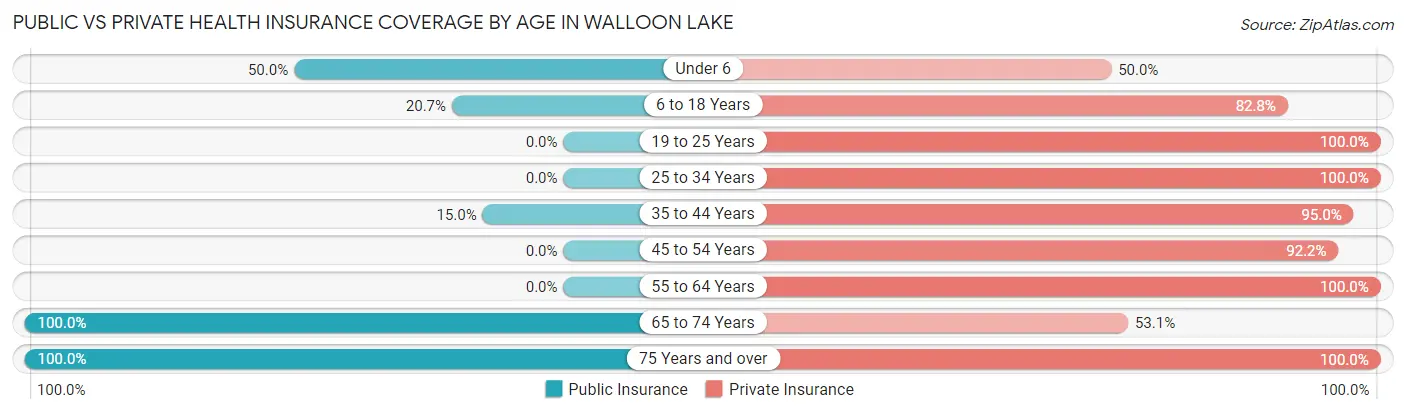
| Age Bracket | Public Insurance | Private Insurance |
| Under 6 | 2 (50.0%) | 2 (50.0%) |
| 6 to 18 Years | 12 (20.7%) | 48 (82.8%) |
| 19 to 25 Years | 0 (0.0%) | 2 (100.0%) |
| 25 to 34 Years | 0 (0.0%) | 48 (100.0%) |
| 35 to 44 Years | 6 (15.0%) | 38 (95.0%) |
| 45 to 54 Years | 0 (0.0%) | 47 (92.2%) |
| 55 to 64 Years | 0 (0.0%) | 40 (100.0%) |
| 65 to 74 Years | 32 (100.0%) | 17 (53.1%) |
| 75 Years and over | 33 (100.0%) | 33 (100.0%) |
| Total | 85 (27.6%) | 275 (89.3%) |
Disability Status by Sex by Age in Walloon Lake
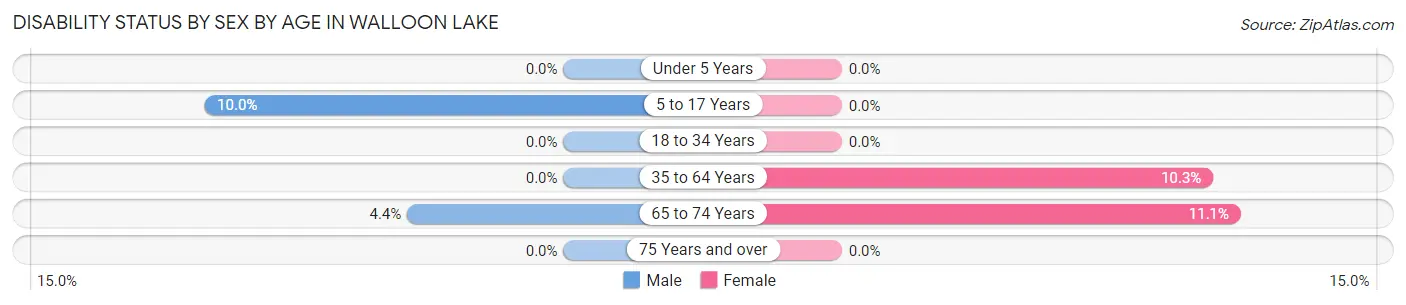
| Age Bracket | Male | Female |
| Under 5 Years | 0 (0.0%) | 0 (0.0%) |
| 5 to 17 Years | 5 (10.0%) | 0 (0.0%) |
| 18 to 34 Years | 0 (0.0%) | 0 (0.0%) |
| 35 to 64 Years | 0 (0.0%) | 6 (10.3%) |
| 65 to 74 Years | 1 (4.3%) | 1 (11.1%) |
| 75 Years and over | 0 (0.0%) | 0 (0.0%) |
Disability Class by Sex by Age in Walloon Lake
Disability Class: Hearing Difficulty
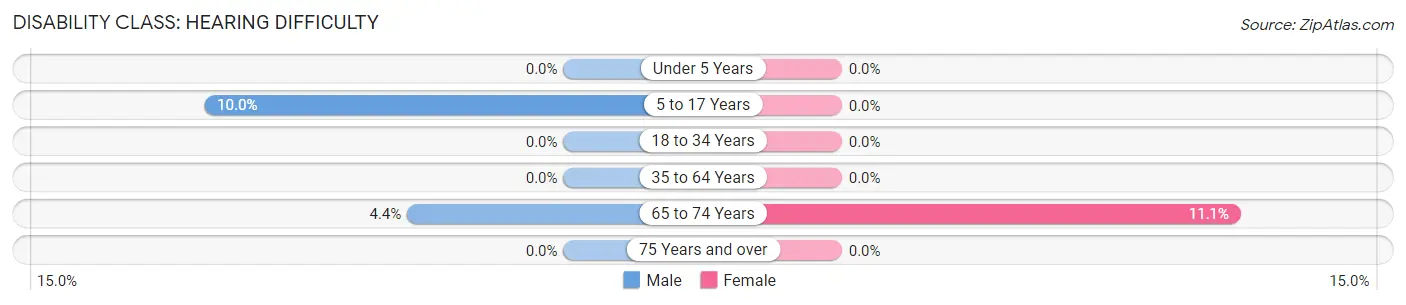
| Age Bracket | Male | Female |
| Under 5 Years | 0 (0.0%) | 0 (0.0%) |
| 5 to 17 Years | 5 (10.0%) | 0 (0.0%) |
| 18 to 34 Years | 0 (0.0%) | 0 (0.0%) |
| 35 to 64 Years | 0 (0.0%) | 0 (0.0%) |
| 65 to 74 Years | 1 (4.3%) | 1 (11.1%) |
| 75 Years and over | 0 (0.0%) | 0 (0.0%) |
Disability Class: Vision Difficulty
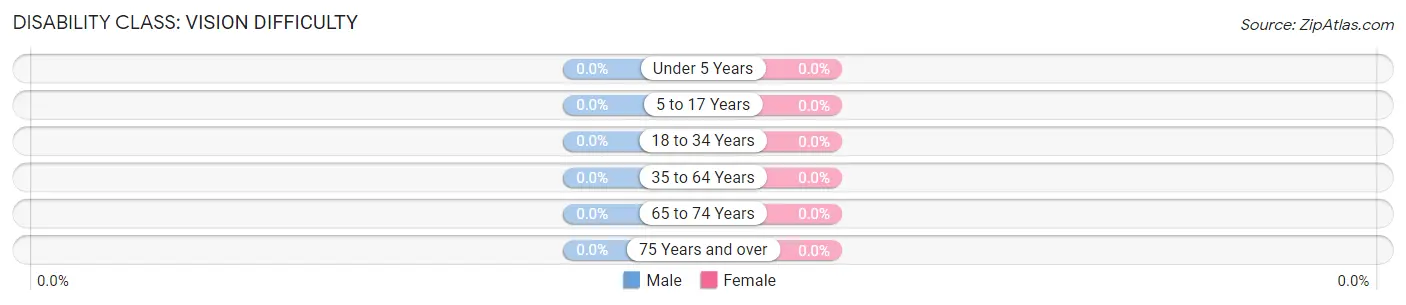
| Age Bracket | Male | Female |
| Under 5 Years | 0 (0.0%) | 0 (0.0%) |
| 5 to 17 Years | 0 (0.0%) | 0 (0.0%) |
| 18 to 34 Years | 0 (0.0%) | 0 (0.0%) |
| 35 to 64 Years | 0 (0.0%) | 0 (0.0%) |
| 65 to 74 Years | 0 (0.0%) | 0 (0.0%) |
| 75 Years and over | 0 (0.0%) | 0 (0.0%) |
Disability Class: Cognitive Difficulty
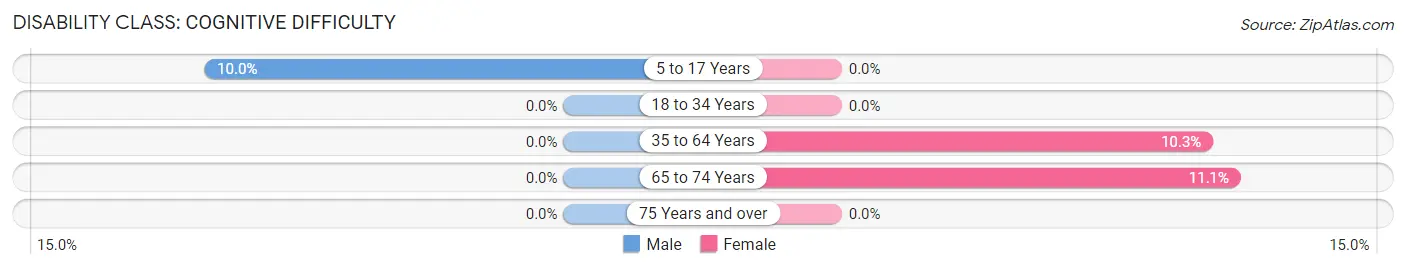
| Age Bracket | Male | Female |
| 5 to 17 Years | 5 (10.0%) | 0 (0.0%) |
| 18 to 34 Years | 0 (0.0%) | 0 (0.0%) |
| 35 to 64 Years | 0 (0.0%) | 6 (10.3%) |
| 65 to 74 Years | 0 (0.0%) | 1 (11.1%) |
| 75 Years and over | 0 (0.0%) | 0 (0.0%) |
Disability Class: Ambulatory Difficulty
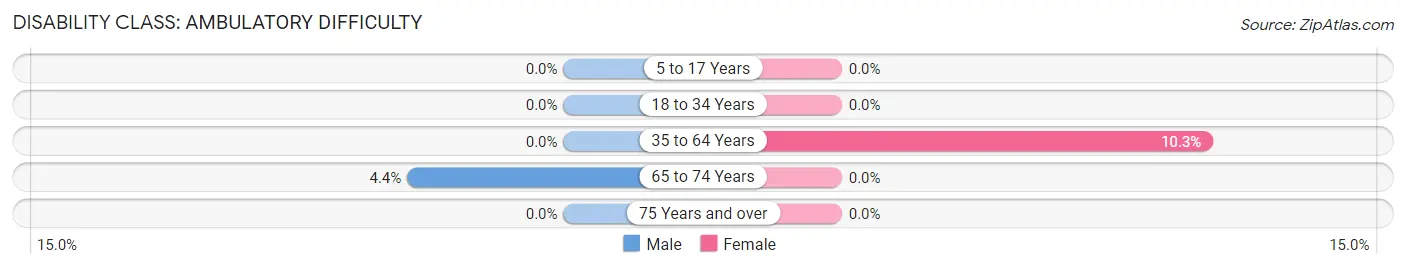
| Age Bracket | Male | Female |
| 5 to 17 Years | 0 (0.0%) | 0 (0.0%) |
| 18 to 34 Years | 0 (0.0%) | 0 (0.0%) |
| 35 to 64 Years | 0 (0.0%) | 6 (10.3%) |
| 65 to 74 Years | 1 (4.3%) | 0 (0.0%) |
| 75 Years and over | 0 (0.0%) | 0 (0.0%) |
Disability Class: Self-Care Difficulty
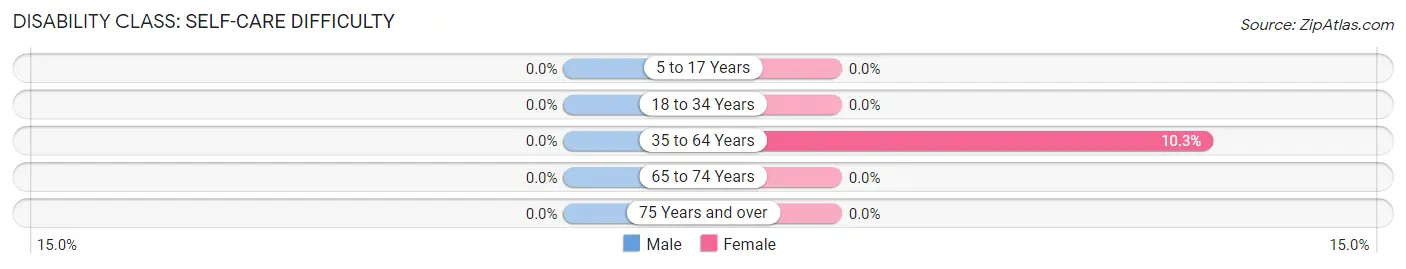
| Age Bracket | Male | Female |
| 5 to 17 Years | 0 (0.0%) | 0 (0.0%) |
| 18 to 34 Years | 0 (0.0%) | 0 (0.0%) |
| 35 to 64 Years | 0 (0.0%) | 6 (10.3%) |
| 65 to 74 Years | 0 (0.0%) | 0 (0.0%) |
| 75 Years and over | 0 (0.0%) | 0 (0.0%) |
Technology Access in Walloon Lake
Computing Device Access in Walloon Lake
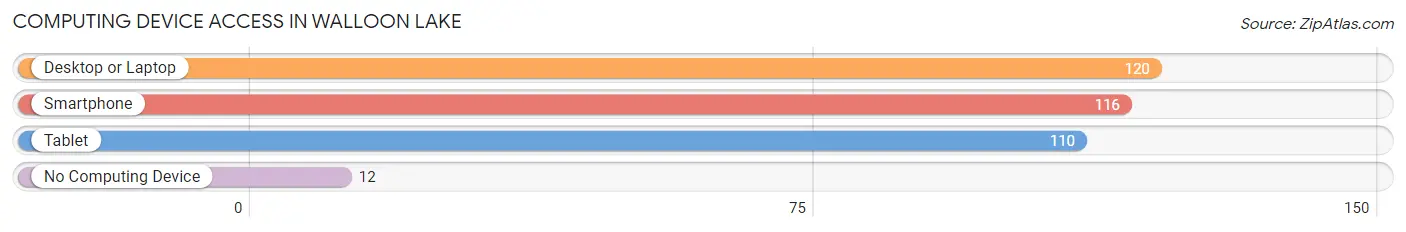
| Device Type | # Households | % Households |
| Desktop or Laptop | 120 | 83.9% |
| Smartphone | 116 | 81.1% |
| Tablet | 110 | 76.9% |
| No Computing Device | 12 | 8.4% |
| Total | 143 | 100.0% |
Internet Access in Walloon Lake
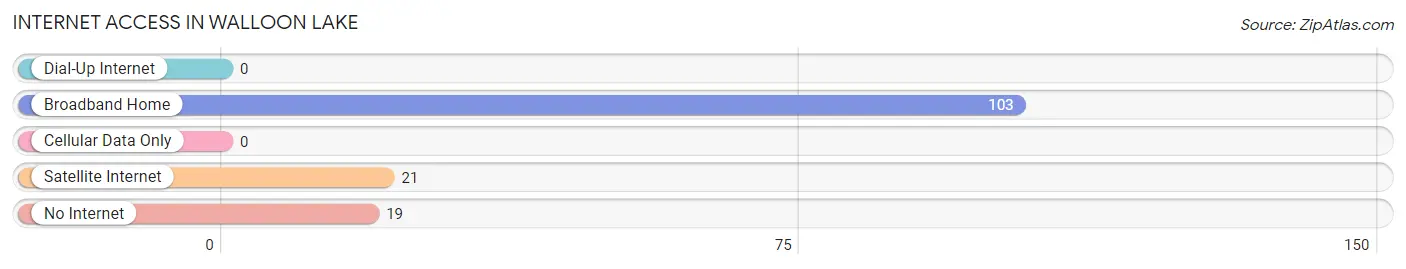
| Internet Type | # Households | % Households |
| Dial-Up Internet | 0 | 0.0% |
| Broadband Home | 103 | 72.0% |
| Cellular Data Only | 0 | 0.0% |
| Satellite Internet | 21 | 14.7% |
| No Internet | 19 | 13.3% |
| Total | 143 | 100.0% |
Walloon Lake Summary
Walloon Lake is a small lake located in Charlevoix County, Michigan. It is part of the Chain of Lakes, which includes Lake Charlevoix, Lake Michigan, and Lake Huron. The lake is approximately 4,000 acres in size and is the largest natural lake in the state of Michigan.
History
The history of Walloon Lake dates back to the early 1800s when the area was first settled by French-Canadian fur traders. The lake was named after the Walloon people, who were French-speaking settlers from the Netherlands. The lake was used for fishing and transportation, and the surrounding area was used for logging.
In the late 1800s, the lake became a popular destination for wealthy vacationers from Detroit and Chicago. The lake was home to several resorts, including the Walloon Lake Hotel, which was built in 1891. The hotel was a popular destination for wealthy vacationers, and it was the site of many social events.
In the early 1900s, the lake became a popular destination for boaters and fishermen. The lake was also home to several resorts, including the Walloon Lake Inn, which was built in 1912. The inn was a popular destination for vacationers, and it was the site of many social events.
In the mid-1900s, the lake became a popular destination for water sports enthusiasts. The lake was home to several resorts, including the Walloon Lake Yacht Club, which was built in 1954. The yacht club was a popular destination for boaters and fishermen, and it was the site of many social events.
Geography
Walloon Lake is located in Charlevoix County, Michigan. The lake is approximately 4,000 acres in size and is the largest natural lake in the state of Michigan. The lake is surrounded by rolling hills and forests, and it is fed by several small streams. The lake is approximately 10 miles long and 1.5 miles wide.
The lake is divided into two sections, the North Arm and the South Arm. The North Arm is the larger of the two sections and is approximately 4 miles long and 1 mile wide. The South Arm is approximately 6 miles long and 1 mile wide.
Economy
The economy of Walloon Lake is largely based on tourism. The lake is a popular destination for boaters, fishermen, and water sports enthusiasts. The lake is also home to several resorts, including the Walloon Lake Inn and the Walloon Lake Yacht Club.
The lake is also home to several marinas, which provide boat rentals and other services. The lake is also home to several restaurants, which serve local cuisine.
Demographics
The population of Walloon Lake is approximately 1,000 people. The majority of the population is white (95%), followed by Native American (2%), African American (1%), and Asian (1%). The median household income is approximately $50,000. The median age is approximately 45 years old.
Conclusion
Walloon Lake is a small lake located in Charlevoix County, Michigan. The lake is approximately 4,000 acres in size and is the largest natural lake in the state of Michigan. The lake is a popular destination for boaters, fishermen, and water sports enthusiasts. The lake is also home to several resorts, marinas, and restaurants. The population of Walloon Lake is approximately 1,000 people, and the median household income is approximately $50,000.
Common Questions
What is Per Capita Income in Walloon Lake?
Per Capita income in Walloon Lake is $66,344.
What is the Median Family Income in Walloon Lake?
Median Family Income in Walloon Lake is $107,386.
What is the Median Household income in Walloon Lake?
Median Household Income in Walloon Lake is $89,531.
What is Income or Wage Gap in Walloon Lake?
Income or Wage Gap in Walloon Lake is 46.0%.
Women in Walloon Lake earn 54.0 cents for every dollar earned by a man.
What is Inequality or Gini Index in Walloon Lake?
Inequality or Gini Index in Walloon Lake is 0.51.
What is the Total Population of Walloon Lake?
Total Population of Walloon Lake is 308.
What is the Total Male Population of Walloon Lake?
Total Male Population of Walloon Lake is 193.
What is the Total Female Population of Walloon Lake?
Total Female Population of Walloon Lake is 115.
What is the Ratio of Males per 100 Females in Walloon Lake?
There are 167.83 Males per 100 Females in Walloon Lake.
What is the Ratio of Females per 100 Males in Walloon Lake?
There are 59.59 Females per 100 Males in Walloon Lake.
What is the Median Population Age in Walloon Lake?
Median Population Age in Walloon Lake is 45.3 Years.
What is the Average Family Size in Walloon Lake
Average Family Size in Walloon Lake is 2.6 People.
What is the Average Household Size in Walloon Lake
Average Household Size in Walloon Lake is 2.1 People.
How Large is the Labor Force in Walloon Lake?
There are 163 People in the Labor Forcein in Walloon Lake.
What is the Percentage of People in the Labor Force in Walloon Lake?
66.3% of People are in the Labor Force in Walloon Lake.
What is the Unemployment Rate in Walloon Lake?
Unemployment Rate in Walloon Lake is 1.2%.