Cities with the Most Immigrants from France in Michigan
RELATED REPORTS & OPTIONS
France
Michigan
Compare Cities
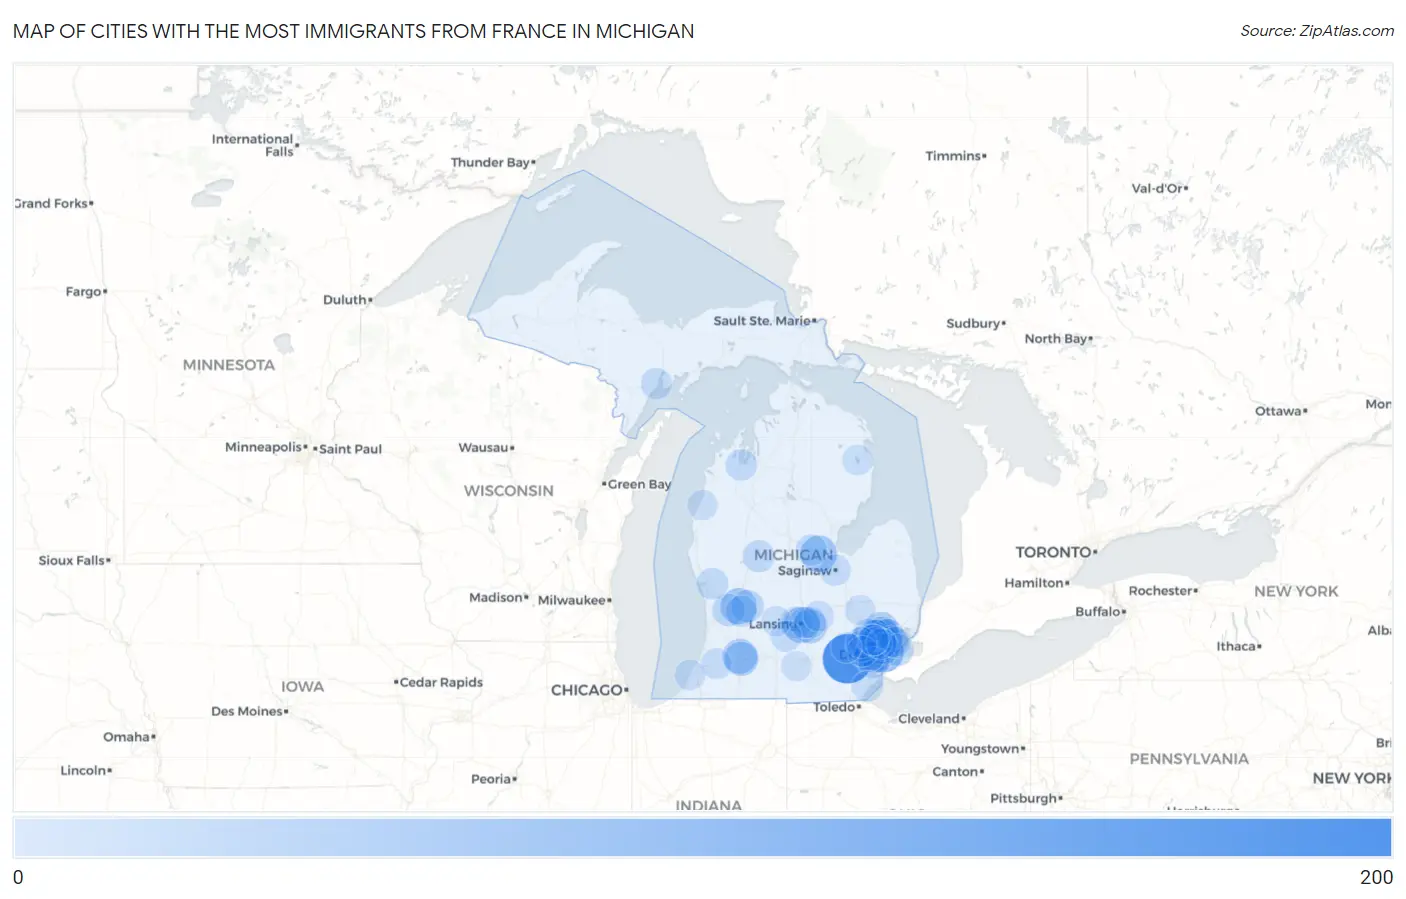
Map of Cities with the Most Immigrants from France in Michigan
0
200
Cities with the Most Immigrants from France in Michigan
| City | France | vs State | vs National | |
| 1. | Ann Arbor | 182 | 2,568(7.09%)#1 | 184,998(0.10%)#131 |
| 2. | Royal Oak | 125 | 2,568(4.87%)#2 | 184,998(0.07%)#210 |
| 3. | Detroit | 88 | 2,568(3.43%)#3 | 184,998(0.05%)#292 |
| 4. | Midland | 58 | 2,568(2.26%)#4 | 184,998(0.03%)#471 |
| 5. | Troy | 56 | 2,568(2.18%)#5 | 184,998(0.03%)#488 |
| 6. | Grand Rapids | 55 | 2,568(2.14%)#6 | 184,998(0.03%)#497 |
| 7. | Lansing | 55 | 2,568(2.14%)#7 | 184,998(0.03%)#498 |
| 8. | Farmington Hills | 52 | 2,568(2.02%)#8 | 184,998(0.03%)#525 |
| 9. | Birmingham | 51 | 2,568(1.99%)#9 | 184,998(0.03%)#542 |
| 10. | Westwood | 42 | 2,568(1.64%)#10 | 184,998(0.02%)#648 |
| 11. | Kalamazoo | 37 | 2,568(1.44%)#11 | 184,998(0.02%)#712 |
| 12. | Okemos | 37 | 2,568(1.44%)#12 | 184,998(0.02%)#720 |
| 13. | Rochester Hills | 34 | 2,568(1.32%)#13 | 184,998(0.02%)#779 |
| 14. | Beverly Hills | 33 | 2,568(1.29%)#14 | 184,998(0.02%)#807 |
| 15. | Southfield | 25 | 2,568(0.97%)#15 | 184,998(0.01%)#981 |
| 16. | Dearborn | 24 | 2,568(0.93%)#16 | 184,998(0.01%)#1,006 |
| 17. | Livonia | 24 | 2,568(0.93%)#17 | 184,998(0.01%)#1,009 |
| 18. | Forest Hills | 22 | 2,568(0.86%)#18 | 184,998(0.01%)#1,099 |
| 19. | Dearborn Heights | 21 | 2,568(0.82%)#19 | 184,998(0.01%)#1,123 |
| 20. | Jenison | 21 | 2,568(0.82%)#20 | 184,998(0.01%)#1,137 |
| 21. | Orchard Lake Village | 21 | 2,568(0.82%)#21 | 184,998(0.01%)#1,155 |
| 22. | Sterling Heights | 20 | 2,568(0.78%)#22 | 184,998(0.01%)#1,161 |
| 23. | Grosse Pointe Farms | 19 | 2,568(0.74%)#23 | 184,998(0.01%)#1,231 |
| 24. | Canadian Lakes | 16 | 2,568(0.62%)#24 | 184,998(0.01%)#1,429 |
| 25. | Garden City | 13 | 2,568(0.51%)#25 | 184,998(0.01%)#1,594 |
| 26. | Waverly | 13 | 2,568(0.51%)#26 | 184,998(0.01%)#1,600 |
| 27. | Kentwood | 12 | 2,568(0.47%)#27 | 184,998(0.01%)#1,647 |
| 28. | Ferndale | 12 | 2,568(0.47%)#28 | 184,998(0.01%)#1,670 |
| 29. | Haslett | 12 | 2,568(0.47%)#29 | 184,998(0.01%)#1,674 |
| 30. | Traverse City | 12 | 2,568(0.47%)#30 | 184,998(0.01%)#1,679 |
| 31. | Highland Park | 12 | 2,568(0.47%)#31 | 184,998(0.01%)#1,694 |
| 32. | Wolf Lake | 12 | 2,568(0.47%)#32 | 184,998(0.01%)#1,707 |
| 33. | East Lansing | 11 | 2,568(0.43%)#33 | 184,998(0.01%)#1,723 |
| 34. | Sanford | 11 | 2,568(0.43%)#34 | 184,998(0.01%)#1,805 |
| 35. | Roseville | 10 | 2,568(0.39%)#35 | 184,998(0.01%)#1,828 |
| 36. | Saginaw | 10 | 2,568(0.39%)#36 | 184,998(0.01%)#1,829 |
| 37. | Escanaba | 10 | 2,568(0.39%)#37 | 184,998(0.01%)#1,868 |
| 38. | Lathrup Village | 10 | 2,568(0.39%)#38 | 184,998(0.01%)#1,894 |
| 39. | Westland | 9 | 2,568(0.35%)#39 | 184,998(0.00%)#1,922 |
| 40. | Northville | 9 | 2,568(0.35%)#40 | 184,998(0.00%)#1,977 |
| 41. | Bloomfield Hills | 9 | 2,568(0.35%)#41 | 184,998(0.00%)#1,981 |
| 42. | St Clair Shores | 8 | 2,568(0.31%)#42 | 184,998(0.00%)#2,013 |
| 43. | Charlotte | 8 | 2,568(0.31%)#43 | 184,998(0.00%)#2,069 |
| 44. | Franklin | 8 | 2,568(0.31%)#44 | 184,998(0.00%)#2,101 |
| 45. | Taylor | 7 | 2,568(0.27%)#45 | 184,998(0.00%)#2,122 |
| 46. | Monroe | 7 | 2,568(0.27%)#46 | 184,998(0.00%)#2,137 |
| 47. | Lawrence | 7 | 2,568(0.27%)#47 | 184,998(0.00%)#2,195 |
| 48. | Novi | 6 | 2,568(0.23%)#48 | 184,998(0.00%)#2,214 |
| 49. | Plymouth | 6 | 2,568(0.23%)#49 | 184,998(0.00%)#2,254 |
| 50. | Pleasant Ridge | 4 | 2,568(0.16%)#50 | 184,998(0.00%)#2,423 |
| 51. | Perry | 4 | 2,568(0.16%)#51 | 184,998(0.00%)#2,426 |
| 52. | Bingham Farms | 4 | 2,568(0.16%)#52 | 184,998(0.00%)#2,440 |
| 53. | Shoreham | 3 | 2,568(0.12%)#53 | 184,998(0.00%)#2,532 |
| 54. | Hubbard Lake | 3 | 2,568(0.12%)#54 | 184,998(0.00%)#2,533 |
| 55. | Whitmore Lake | 2 | 2,568(0.08%)#55 | 184,998(0.00%)#2,558 |
| 56. | Goodrich | 2 | 2,568(0.08%)#56 | 184,998(0.00%)#2,567 |
| 57. | Sunfield | 2 | 2,568(0.08%)#57 | 184,998(0.00%)#2,591 |
| 58. | Concord | 1 | 2,568(0.04%)#58 | 184,998(0.00%)#2,637 |
| 59. | Eastlake | 1 | 2,568(0.04%)#59 | 184,998(0.00%)#2,654 |
Common Questions
What are the Top 10 Cities with the Most Immigrants from France in Michigan?
Top 10 Cities with the Most Immigrants from France in Michigan are:
#1
182
#2
125
#3
88
#4
58
#5
56
#6
55
#7
55
#8
52
#9
51
#10
42
What city has the Most Immigrants from France in Michigan?
Ann Arbor has the Most Immigrants from France in Michigan with 182.
What is the Total Immigrants from France in the State of Michigan?
Total Immigrants from France in Michigan is 2,568.
What is the Total Immigrants from France in the United States?
Total Immigrants from France in the United States is 184,998.