Zip Codes with the Highest Percentage of Households with Income Above $200,000 in New Baltimore, MI
RELATED REPORTS & OPTIONS
Household Income | $200k+
New Baltimore
Compare Zip Codes
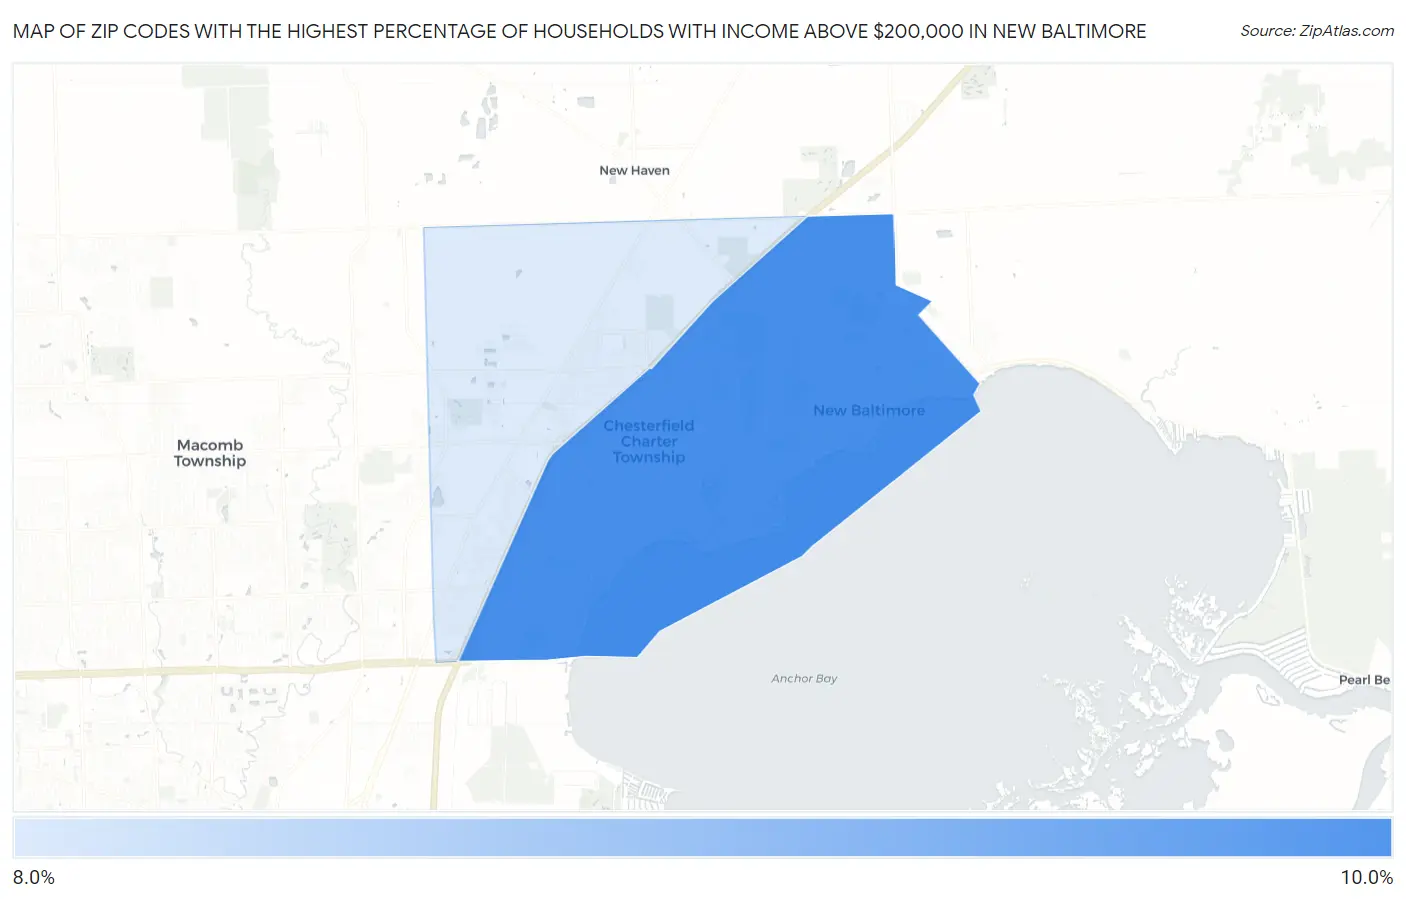
Map of Zip Codes with the Highest Percentage of Households with Income Above $200,000 in New Baltimore
8.4%
8.7%
Zip Codes with the Highest Percentage of Households with Income Above $200,000 in New Baltimore, MI
| Zip Code | Households with Income > $200k | vs State | vs National | |
| 1. | 48047 | 8.7% | 8.2%(+0.500)#214 | 11.4%(-2.70)#9,518 |
| 2. | 48051 | 8.4% | 8.2%(+0.200)#222 | 11.4%(-3.00)#9,885 |
1
Common Questions
What are the Top Zip Codes with the Highest Percentage of Households with Income Above $200,000 in New Baltimore, MI?
Top Zip Codes with the Highest Percentage of Households with Income Above $200,000 in New Baltimore, MI are:
What zip code has the Highest Percentage of Households with Income Above $200,000 in New Baltimore, MI?
48047 has the Highest Percentage of Households with Income Above $200,000 in New Baltimore, MI with 8.7%.
What is the Percentage of Households with Income Above $200,000 in New Baltimore, MI?
Percentage of Households with Income Above $200,000 in New Baltimore is 9.1%.
What is the Percentage of Households with Income Above $200,000 in Michigan?
Percentage of Households with Income Above $200,000 in Michigan is 8.2%.
What is the Percentage of Households with Income Above $200,000 in the United States?
Percentage of Households with Income Above $200,000 in the United States is 11.4%.