Zip Codes with the Highest Percentage of Households with Income Above $200,000 in Brighton, MI
RELATED REPORTS & OPTIONS
Household Income | $200k+
Brighton
Compare Zip Codes
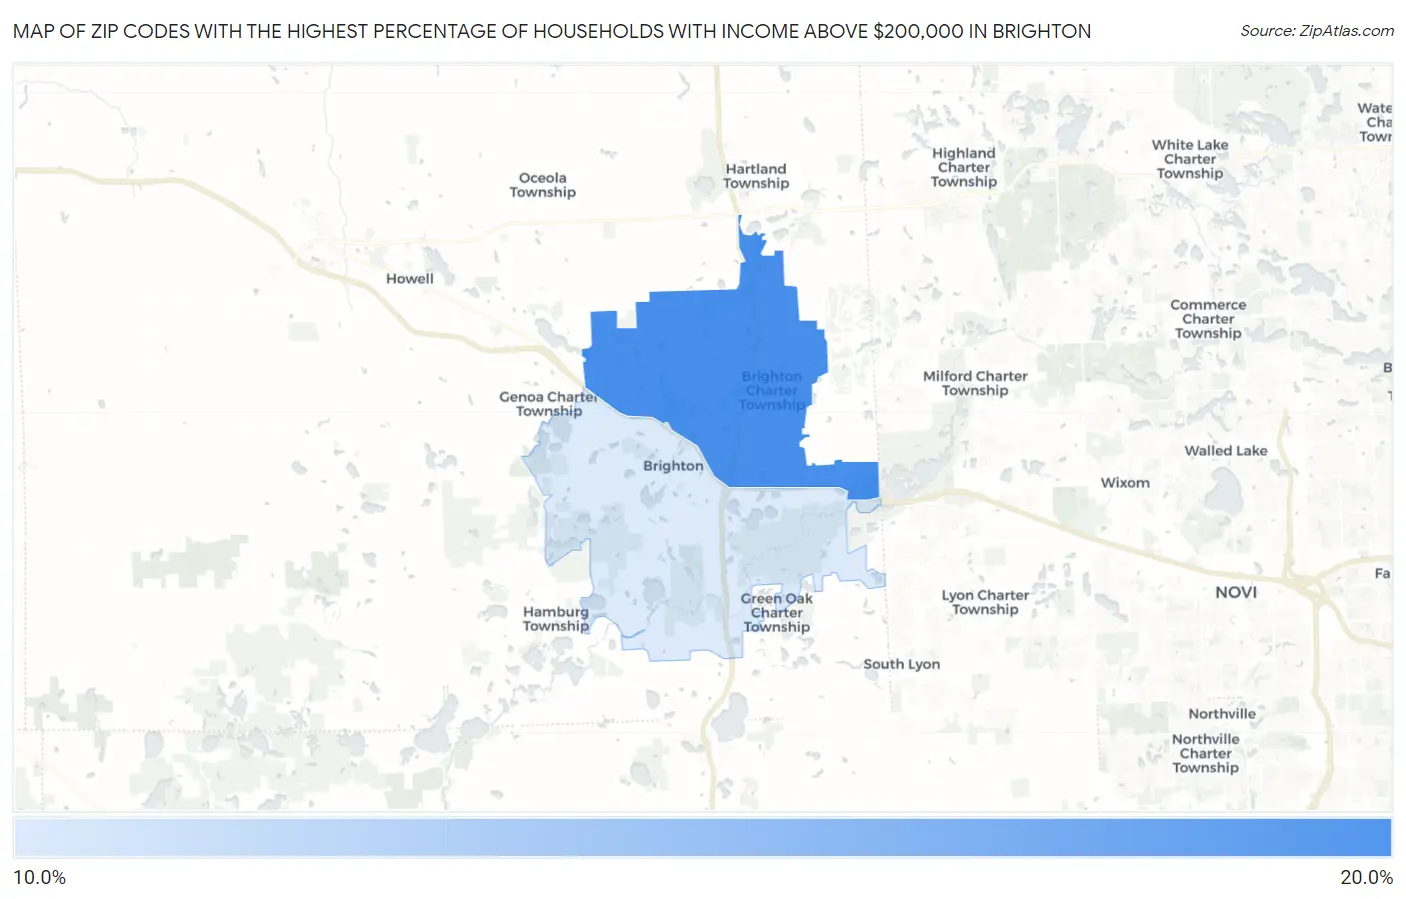
Map of Zip Codes with the Highest Percentage of Households with Income Above $200,000 in Brighton
14.7%
19.9%
Zip Codes with the Highest Percentage of Households with Income Above $200,000 in Brighton, MI
| Zip Code | Households with Income > $200k | vs State | vs National | |
| 1. | 48114 | 19.9% | 8.2%(+11.7)#48 | 11.4%(+8.50)#3,319 |
| 2. | 48116 | 14.7% | 8.2%(+6.50)#91 | 11.4%(+3.30)#5,124 |
1
Common Questions
What are the Top Zip Codes with the Highest Percentage of Households with Income Above $200,000 in Brighton, MI?
Top Zip Codes with the Highest Percentage of Households with Income Above $200,000 in Brighton, MI are:
What zip code has the Highest Percentage of Households with Income Above $200,000 in Brighton, MI?
48114 has the Highest Percentage of Households with Income Above $200,000 in Brighton, MI with 19.9%.
What is the Percentage of Households with Income Above $200,000 in Brighton, MI?
Percentage of Households with Income Above $200,000 in Brighton is 7.1%.
What is the Percentage of Households with Income Above $200,000 in Michigan?
Percentage of Households with Income Above $200,000 in Michigan is 8.2%.
What is the Percentage of Households with Income Above $200,000 in the United States?
Percentage of Households with Income Above $200,000 in the United States is 11.4%.